• Link to Facebook
  • Link to X
  • Link to Instagram
  • Link to Youtube
  • Link to LinkedIn
  • Link to Mail
Synapse Trading
  • Home
  • About
    • My Background
    • My Trading Journey
    • My Travel Log
    • Media & Interviews
  • Mentoring
    • Trading Mastery Program
    • Results & Testimonials
  • Signals
    • Telegram (Free to join!)
    • Daily Trading Signals
    • Daily Trading Signals (Results)
  • Resources
    • Free Trading Guides
    • Tools & Resources
    • Blog & Infographics
  • Contact
    • Contact Us
    • Partnership Opportunities
  • Click to open the search input field Click to open the search input field Search
  • Menu Menu

Learn more about trading strategies, products, analysis, tools to help you supercharge your trading results!

Spencer Li

How to Draw Support and Resistance Levels

Trading Tips
support resistance

So far, we’ve covered the importance of market timing and the need to trade according to the current trend. But when exactly should you be buying or selling a security? This brings us to the topic of support and resistance zones.

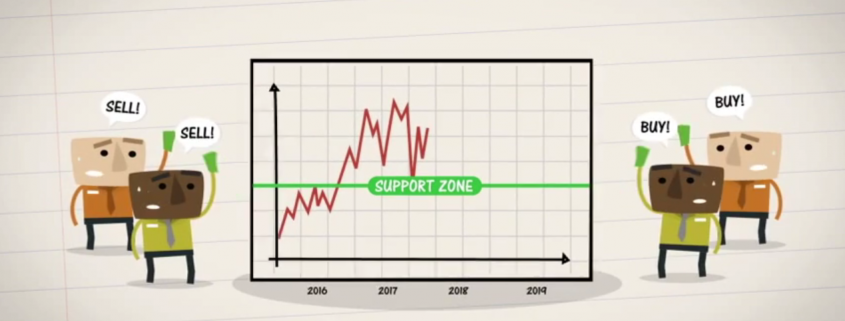
Support and resistance zones are like invisible lines on a price chart which prices and traders react to. They signal a great opportunity to either enter or exit a trade. These zones usually correspond with the pattern by which a particular security has moved in the past. For instance, let’s say a stock reaches a certain price level before declining, it goes down for about a year before hitting its bottom and turning back up again.

The next time that stock approaches, the price at which it first began to decline, some investors will start to sell it off, anticipating that it will decline once again. This is how a resistance zone is created. On the other hand, when that stock approaches the price at which at last turned around, many investors will step in and buy it, creating a support zone. Securities sit in these zones temporarily, while buyers and sellers try to figure out whether to jump in or jump out of the market. The key is to watch carefully how prices react in the support or resistance zone because eventually, one of two things will happen.

The zone will either hold and the price will reverse direction or the security will break through and continue on its trajectory. It’s important to note that breakthroughs have the tendency to recalibrate a security support and resistance zones. For example, often times when a security breaks through a resistance zone that same level becomes its support zone during the next cycle. That’s because of all the investors who missed the chance to benefit last time around and are looking to either buy the security for cheap or sell it before it declines.

As a trader, it’s important to learn how to identify the support and resistance zones for a particular security once you’ve figured out where those zones are, you should then make your buying and selling decisions near those zones. That will provide you with a market edge, allowing you to achieve greater success over the short and long term.

0 Comments/by Spencer Li
https://synapsetrading.com/wp-content/uploads/2015/05/support-resistance.png 709 1269 Spencer Li https://synapsetrading.com/wp-content/uploads/2019/10/logo.jpg Spencer Li2015-05-29 08:00:252021-02-13 13:43:47How to Draw Support and Resistance Levels
Spencer Li

The 2% Money Management Rule for Trade Position-Sizing

Trading Tips
MG 9839

The 2% Rule: Money Management and Position Sizing for Traders

Last updated: 3 July 2026 · By Spencer Li, CFTe


The 2% rule is the one money management rule professionals follow and most retail traders skip: on any single trade, you risk no more than 2% of your account. For a $10,000 account that caps your loss at $200 per trade, no matter how good the setup looks. The point of money management is not to make the most money on your best idea. It is to make sure no single trade, or even a bad streak of them, can take you out of the game. Stick to 2%, and the only way to lose your whole account is to lose 50 trades in a row, which is so unlikely it rounds to zero. Break it, and one oversized loss can erase months of work. That is the line between a trader who is still here next year and one who blew up.

To size a trade under the rule, you work backwards from your stop. Risk per trade equals (entry price minus stop price) times quantity, and you choose the quantity so that number lands at or under 2% of your account.

So how do you actually apply it? Let me walk through the maths the way I first understood it.

Why risking too much blows up accounts

We all know the goal of trading is to make money, and as long as you have an edge (a strategy that wins more than it loses over many trades), you will be profitable in the long run.

So the next question is the one that actually matters: how do you maximise your profit without blowing up your account?

Let me use a simple betting example. You start with $10,000. You have a 60% hit rate (your chance of winning any single bet), and on each bet you either double your stake or lose all of it. How much should you bet each time?

If you bet the whole $10,000, you have a 60% chance of doubling your money. But you also have a 40% chance of losing everything in one shot. That is exciting for a gambler. It is no way to stay profitable in the long run.

Now watch what happens when you split the same $10,000 into smaller bets. Your edge does not change. Your odds of ruin collapse.

How you split $10,000Bet sizeChance of losing every bet in a row
1 bet$10,00040%
2 bets$5,00016% (40% × 40%)
10 bets$1,0000.01%

Same edge, same starting capital. The only thing that changed is how much you put on the line at once. That is position sizing, and it is doing all the work here.

The lesson: in trading, good money management is not about making the most money on a single trade. It is about making sure you do not lose your capital. As Warren Buffett put it, rule number one is never lose money. Rule number two is never forget rule number one.

How does the 2% rule work in practice?

When you take a trade, you risk only 2% of your capital on it. For a $10,000 account, that is $200, and $200 is the most you can lose on that trade, full stop.

Risk is calculated as the difference between your entry price and your stop-loss price, multiplied by the quantity you trade. You flip that around to size the position: decide where your stop goes first, then buy only as many shares (or contracts, or lots) as keeps your risk inside $200.

Here is the same account at work across three setups with different stop distances.

AccountRisk cap (2%)Stop distance (entry − stop)Position size you can take
$10,000$200$1.00200 shares
$10,000$200$2.00100 shares
$10,000$200$0.50400 shares

Do note that, the wider your stop, the smaller your position. That is the rule working as intended. It forces a volatile, far-stop trade to be smaller, so a single loss still costs you the same fixed $200.

What happens if you stick to the 2% rule?

With the 2% rule, the only way to lose all your trading capital is to lose 50 trades in a row. The probability of that is less than 0.000000000000000001%. In plain terms, it does not happen to a trader who follows the rule.

We have all heard the horror stories of traders blowing up their accounts. That happens when they break this rule, not when they follow it. One trade sized at 20% or 50% of the account, one “sure thing” that was not sure, and the damage is permanent. Stick to 2%, and blowing up becomes almost mathematically impossible, and you will see a real improvement in your results simply because no single mistake is fatal.

Where the human edge comes in

A position-size calculator will do the arithmetic for you in a second. That part is free now. What it will not do is stop your hand when the setup looks so good you want to bet 10% “just this once.” It will not keep you at 2% through a four-loss streak when every instinct says to size up and win it back. The maths of sizing is the easy part. The discipline to apply it on the one trade you are sure cannot lose, that is the judgment, and it is one of the Five Edges no tool can trade for you.

Tips from the trading desk

  • Size from the stop, not the entry. Place your stop where the trade is wrong, then let the 2% cap tell you the position size. Never the other way around.
  • 2% is a ceiling, not a target. On a weaker setup, risk less. You are never obligated to use the full 2%.
  • Cap your total open risk too. Five trades each risking 2% is 10% of the account at risk at once if they are correlated. Watch the sum, not just the single trade.
  • Smaller account, same rule. The 2% is a percentage for a reason. It scales down with a $2,000 account and up with a $200,000 one without any change in logic.

FAQ

What is the 2% rule in trading?
The 2% rule means you risk no more than 2% of your account balance on any single trade. For a $10,000 account, your maximum loss per trade is $200. It is a money management rule designed to keep any one trade, or a losing streak, from blowing up your account.

How do I calculate position size using the 2% rule?
Work backwards from your stop. Risk per trade equals (entry price minus stop-loss price) times quantity. Pick the quantity so that figure is at or below 2% of your account. Example: a $10,000 account (2% = $200) with a $2.00 stop distance lets you buy 100 shares.

Is 2% too much or too little to risk per trade?
2% is a common professional ceiling, not a target. Many traders risk 1% or less, especially on lower-conviction setups or larger accounts. Risking more than 2% per trade is where most account blow-ups come from.

Does the 2% rule guarantee I won’t lose money?
No. It controls how much you lose on any single trade, not whether you win. You still need an edge (a strategy that wins over many trades). The 2% rule simply ensures no one loss can take you out before your edge plays out.

What is the difference between money management and position sizing?
Money management is the broader discipline of protecting your capital, including how much you risk per trade and in total. Position sizing is the specific calculation of how many shares or contracts to buy so your risk stays inside that limit. The 2% rule connects the two.


So, which trader are you today? The one who bets the whole account on a feeling, or the one who risks a fixed 2% and lives to trade tomorrow? Let me know in the comments.

And if you want the full framework for protecting your capital, read the pillar: The Complete Guide to Risk Management in Trading.

Want the system that uses this rule by default? Grab the free 15-Minute Swing Trading Starter Kit. It is the exact routine I use to scan once a day and trade any market in 15 minutes, with sizing baked in.


About the author. Spencer Li is the founder of Synapse Trading and a Certified Financial Technician (CFTe) with 15 years of trading across stocks, forex, crypto, commodities, and bonds. His trade log is public, 404 trades, losses left in. He teaches low-risk swing trading in 15 minutes a day, one system for any market.

Education, not financial advice. Synapse Trading is not licensed by MAS to advise on investment products. Trading carries risk of loss; past performance is not indicative of future results.


Related

The Complete Guide to Risk Management in Trading (pillar) · How to set a stop-loss · Risk-reward ratio explained · Trading psychology and discipline

0 Comments/by Spencer Li
https://synapsetrading.com/wp-content/uploads/2015/05/MG_9839.png 1380 1980 Spencer Li https://synapsetrading.com/wp-content/uploads/2019/10/logo.jpg Spencer Li2015-05-29 04:36:372026-07-06 02:43:32The 2% Money Management Rule for Trade Position-Sizing
Spencer Li

Techniques for Identifying Market Trends

Trading Tips
identifying market trends

If you want to make money by timing the stock market you need to follow the trends.

Buying and selling creates its own momentum and a market that’s moving up or down is likely to keep moving in that direction for a certain period of time.

What this means is that you should avoid trading against the current trend.

For example, when the market is bearish and heading down, don’t try to predict which stocks have hit bottom, that would be like trying to catch a falling knife.

Instead, find an objective way to both identify the current trend and decipher when that trend has changed too, because just like the saying goes, “the trend is your friend, except at the end”.

So, let’s explore two simple techniques for identifying market trends.

The most common ways to look at the nature of a trend’s movement. As a stock moves up or down, it rarely does so in a straight line, rather it zigzags forming a series of highs and lows.

If the highs keep getting higher and the lows keep getting higher that stock is in an uptrend. If the highs get lower and the lows get lower, you’re looking at a downtrend. And if the highs and lows are consistent over a certain period, it’s in a sideways trend.

Another way to identify the market trend is to look beyond the daily price fluctuations and determine the general direction of a stock.

You do this by calculating an average. For example, a 20-day simple moving average or an SMA, is an average of the past 20 days of closing prices, which moves or updates on a daily basis by incorporating the latest prices.

If the SMA is sloping upwards, that’s an uptrend; sloping down downtrend and sideways, means flat.

A 20-day SMA gives a good picture of the short-term trend but you can also use other periods like the 50-day SMA and the 200-day SMA for the long-term trend. Those aren’t the only moving averages, however, there’s the exponential moving average or EMA, and the weighted moving average or WMA, which gives more weight to recent prices.

As a trader, you can use any of these techniques individually, but for the most accurate picture of market trends, you should use them all.

Because when it comes to behavioral analysis, the best way to increase your chances of success, is to consider as much data as possible.

So that’s market timing! Next, let’s cover support and resistance zones.

0 Comments/by Spencer Li
https://synapsetrading.com/wp-content/uploads/2015/05/identifying-market-trends.png 715 1279 Spencer Li https://synapsetrading.com/wp-content/uploads/2019/10/logo.jpg Spencer Li2015-05-22 08:00:242021-02-15 00:20:10Techniques for Identifying Market Trends
Spencer Li

The Basics of Market Timing

Trading Tips
basics of market timing

The price of every stock or financial product fluctuates over time, and no matter how strong a stock is or how solid its fundamentals, you can only make money when the stock goes up in price relative to where you bought it. That’s why it’s so important to read the market accurately and buy stocks at the right time.

The goal for any investor is to buy a stock just before it makes a big move, and sell it just before it starts to decline. The question is how do you do it?

For starters, you want to look at the big players on the financial landscape, like banks and financial institutions.

These are the organizations who determine the direction of a stock more than any other. If they start to buy a certain stock in large numbers, chances are other investors will follow suit, leading to a rise in value. And if they start to dump a stock, then other shareholders will likely do the same, causing a decrease in value.

By keeping a close eye on what these institutions are doing, you’ll be able to spot shifts in the market before they happen.

This study of market behavior is known as behavioural analysis and encompasses three main schools of thought: classical technical analysis, indicator-based technical analysis, and price action and volume analysis.

Classical technical analysis is all about reading charts. The goal is to identify the trend lines of a particular stock and pinpoint the support and resistance zones, where buying and selling usually takes place.

Classical technical analysis also includes pattern recognition techniques, used to identify shapes on the chart which have a certain predictive value.

Then, there’s indicator based technical analysis in which you take price and volume data and plug it into a mathematical formula to figure out when to buy or sell. Unfortunately, most indicator signals tend to be lagging, which can result in misleading or inaccurate analysis.

Finally, there’s price action and volume analysis, in which a trader leverages their deep understanding of market movements to interpret price and volume data directly. It’s the methodology that most professional traders use as it allows faster, more accurate predictions.

Those are the basics.

Over the next few videos, we’ll dive a little deeper and teach you how to identify market trends and most importantly how to pinpoint the right time to buy and sell.

0 Comments/by Spencer Li
https://synapsetrading.com/wp-content/uploads/2015/05/basics-of-market-timing.png 706 1271 Spencer Li https://synapsetrading.com/wp-content/uploads/2019/10/logo.jpg Spencer Li2015-05-15 08:00:232021-02-15 00:16:04The Basics of Market Timing
Spencer Li

Shortcuts to Analyzing Financial Ratios for Stocks

Trading Tips
7 essential financial ratios

Reading financial statements is one thing; analyzing them and deciphering their true meaning is another. To do that, you need to understand the seven essential financial ratios. They’re like a shortcut for filtering out good stocks.

The first is gross profit margin. This represents the proportion of money left over after subtracting the cost of goods sold. To calculate gross profit margin, take gross profit and divide by sales. The higher the margin, the more profitable a company is. Margins of 15% or more are considered good.

The second ratio is net profit margin. This represents the portion of money left after subtracting all expenses to calculate net profit margin divided net profit by sales. The higher the margin, the more profitable the company is. In general, look for margins of 7% or more.

The third ratio is return on equity or ROE. This measures how much profit a company makes from shareholder equity. To calculate ROE, take the net profit and divide it by equity. The higher the number, the more money the company makes for its shareholders. Look for an ROE of 15% or higher.

The fourth essential ratio is the current ratio. This measures a company’s current assets against its current liabilities. To calculate the current ratio, simply divide the current assets by the current liabilities. The higher the ratio, the more likely the company will be able to cover short term liabilities. A good current ratio is anything above 1.

The fifth ratio you should know is the debt to cash flow ratio. This measures the company’s debts against its operating cash flow. To calculate this, take the company’s total debt and divide it by operating cash flow. The lower the ratio, the better the company’s ability to finance their operations, any ratio less than or equal to three is considered good.

The sixth essential ratio is the net gearing ratio. This measures the company’s debts against its shareholder equity. To calculate this ratio, first take the total debt and subtract the company’s cash, then divide that number by the equity. The higher the ratio, the more debt and therefore risk the company has. Look for a net gearing ratio of 0.5 or less.

Finally, the seventh essential ratio is the dividend yield. This measures how much in dividends the company pays out compared to their stock price. To calculate the dividend yield, take the dividend per share and divide it by share price. The higher the yield, the more dividends shareholders receive. Look for companies with consistent yields between 4 and 7 percent.

And that’s it!

By applying these 7 essential ratios, you too can uncover hidden gems in the stock market!

0 Comments/by Spencer Li
https://synapsetrading.com/wp-content/uploads/2015/05/7-essential-financial-ratios.png 711 1276 Spencer Li https://synapsetrading.com/wp-content/uploads/2019/10/logo.jpg Spencer Li2015-05-08 08:00:332021-02-14 17:16:11Shortcuts to Analyzing Financial Ratios for Stocks
Page 9 of 12«‹7891011›»

Free Trading Guides

Free Trading Guides

Blog Categories

  • Beginner's Guide
  • Blockchain & Crypto
  • Book Summaries
  • Candlestick Patterns
  • Economics & News Trading
  • Investing & Portfolio Management
  • Living Your Best Life
  • Market Analysis
  • News & Events
  • Price Chart Patterns
  • Promotions
  • Risk & Money Management
  • Stock Trading
  • Testimonials
  • Tools & Resources
  • Trading Psychology
  • Trading Strategies
  • Trading Tips
  • Travel & Lifestyle

Free Trading Guides

Free Trading Guides

Contact Us

Synapse Trading Pte Ltd
Registration No. 201316168H

Whatsapp: +65-8897-1204
Telegram: @iamrecneps
Email: info@synapsetrading.com

Links

Disclaimer
Privacy policy
Terms & Conditions
Contact us
Partnerships

© 2012-2024 Synapse Trading | All rights reserved | - powered by Enfold WordPress Theme
  • Link to Facebook
  • Link to X
  • Link to Instagram
  • Link to Youtube
  • Link to LinkedIn
  • Link to Mail
Scroll to top Scroll to top Scroll to top