War, regardless of where or why, is disheartening. Ideally, a world without conflicts is what many desire.
However, reality demands us to be pragmatic, especially investors who need to perceive events as they unfold rather than how we wish them to be.
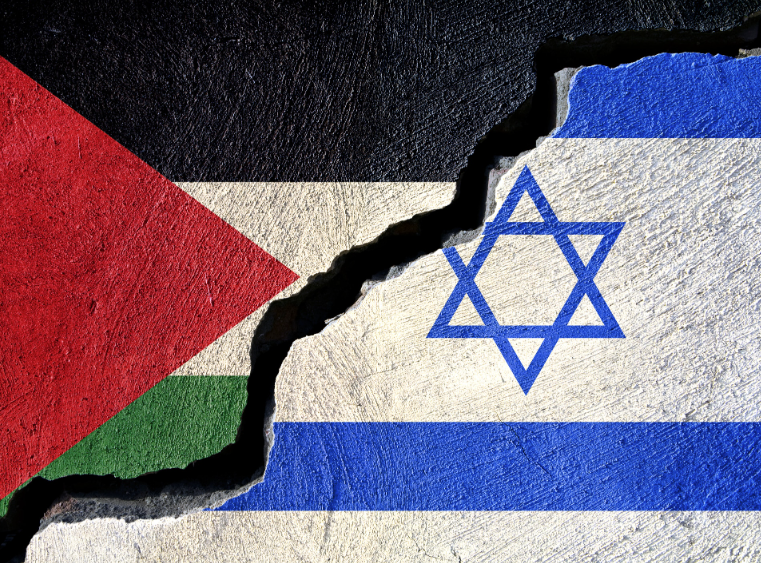
This article delves into the implications of the recent Israel-Hamas conflict and its potential consequences on financial markets.
How Have Various Markets Reacted in the Past?
The Israel-Hamas conflicts have occurred several times, particularly the notable escalations in 2008-09, 2012, and 2014.
The financial markets, while inherently sensitive to geopolitical events, have a multifaceted reaction based on a variety of factors, not just the conflict itself.
Let’s break down the general trends during these periods across various markets:
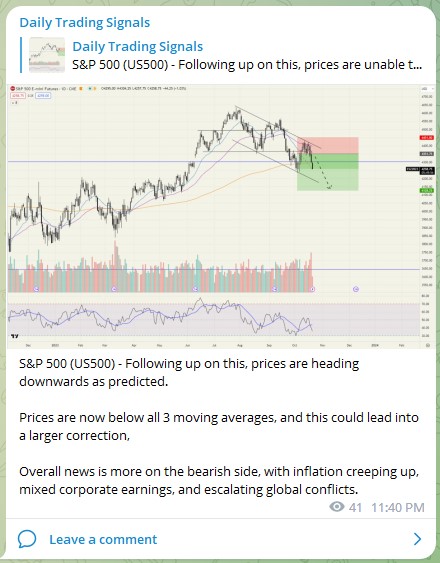
US Stocks (S&P 500)
2008-09: This was the period of the global financial crisis, so it’s difficult to isolate the impact of the Israel-Hamas conflict on US stocks. The S&P 500 was already in decline due to the financial meltdown.
2012: In November, the S&P 500 saw a short-lived decline which coincided with the beginning of the conflict. However, by the end of the month, it had mostly recovered.
2014: The conflict’s start in July saw a modest dip in the S&P 500, but it resumed its upward trend by August.
Bonds & Long-Term Treasury Notes
Geopolitical tensions generally lead to a “flight to safety” where investors buy up government bonds.
During the mentioned conflicts, yields (which move inversely to bond prices) on the long-term Treasury note tended to dip slightly, indicating increased demand for US government debt.
Gold
Gold is another “safe-haven” asset. During the Israel-Hamas escalations, the price of gold generally saw a rise.
For instance, in 2014, gold prices spiked in July but began declining again in August.
Commodities
The broader commodities market didn’t show a clear trend directly attributable to the conflicts, but individual commodities like oil did.
Oil
The Middle East is a significant oil-producing region. While Israel and Gaza aren’t major oil producers, the potential for broader regional instability affects oil prices.
In 2012, for example, oil prices rose by about 10% in the early days of the conflict but started declining as ceasefire talks began.
USD (US Dollar)
The US dollar generally serves as a safe-haven currency during geopolitical tensions.
It witnessed a slight strengthening during the periods of the conflicts, particularly against emerging market currencies.
Cryptocurrencies
Cryptocurrencies like Bitcoin were in their nascent stages during the earlier conflicts and hence didn’t serve as significant indicators.
By the 2014 conflict, Bitcoin’s price remained relatively stable, suggesting it wasn’t significantly impacted by the conflict.
Immediate Repercussions on the Financial Markets
Any disturbance in the Middle East directly affects the oil market due to the region’s control over approximately 30% of the global oil supply.
The recent conflict between Israel and Hamas is no exception, causing oil prices to surge by $3 a barrel at the start off the war.
This uptick is crucial as oil plays a significant role in inflation, which in turn influences the Federal Reserve’s decisions on interest rates.
Potential Setback for the Saudi-Israel-US Agreement?
The ongoing conflict brings into question the potential Saudi-Israel-US trilateral deal which entails:
- Saudi Arabia’s formal recognition of Israel
- The US offering weapon sales, security assurances, and support in developing a domestic nuclear program to Saudi Arabia
- Saudi Arabia’s commitment to amplify oil supply by 2024
However, the recent aggressions make it challenging for Saudi Arabia to formally recognize Israel without facing domestic backlash.
Given the backdrop, the unfolding events hint at a larger geopolitical game, especially considering Iran’s support for Hamas.
Mid-Term Implications
Historically, conflicts in the Middle East have had mixed effects on oil prices.
For instance, the 2006 Lebanon War didn’t leave a lasting impact on oil prices once other macroeconomic factors set in.
Currently, two significant factors play a role: the decreasing demand for oil due to a global economic downturn and the decision of OPEC+ regarding oil supply in 2024.
However, the unpredictability of war makes it essential for investors to be cautious about potential escalations.
Potential for a Larger Scale Conflict
While we hope for peaceful resolutions, there’s always the risk of conflicts escalating.
A potential sequence could be:
- Israel intensifying its military response with a substantial invasion of the Gaza Strip
- Hezbollah’s involvement from Lebanon
- If Hezbollah faces potential defeat, Iran might intervene either directly or indirectly
Given the strategic position of the Strait of Hormuz, any larger-scale conflict involving Iran could disrupt global oil supplies, leading to drastic implications for oil prices, inflation, and consequently, interest rates.
Broader Geopolitical Context
Understanding the Israel-Hamas conflict requires us to view it against the backdrop of the larger geopolitical landscape. This includes:
Changes in Global Energy Dynamics: The aftermath of the Ukraine conflict altered global energy routes, with Europe becoming more reliant on the US and Africa, while Russia shifted its focus to China and India.
Shifts in Global Power Balance: The recent years have seen a noticeable shift in the balance of power, with challenges to US dominance becoming more pronounced, signalling a transition towards a more multi-polar world order.
Historical Context of the Israel-Hamas Conflict
Origins
Late 19th to Early 20th Century: Zionism, a movement supporting the re-establishment of a Jewish homeland in what was then Palestine, grew in prominence. Simultaneously, Arab nationalism also emerged in response to Ottoman and Western colonial rule.
1917: The Balfour Declaration by the British government supported the establishment of a “national home for the Jewish people” in Palestine. Palestine at this time was part of the Ottoman Empire and post-World War I came under British control.
1947: The UN approved a partition plan to divide Palestine into separate Jewish and Arab states, with Jerusalem under international administration. This was accepted by the Jewish leadership but rejected by the Arab leaders.
1948: The State of Israel was proclaimed. Neighboring Arab states intervened, leading to the Arab-Israeli war.
Hamas’ Emergence
1987: Amidst the First Intifada (Palestinian uprising), Hamas (Islamic Resistance Movement) was founded. It emerged as a rival to the secular nationalist Fatah party, which dominated the Palestine Liberation Organization (PLO).
2006: Hamas won the Palestinian legislative elections, leading to tensions with Fatah. This culminated in Hamas taking over the Gaza Strip in 2007, after which the Palestinian territories became divided with Fatah controlling the West Bank and Hamas controlling Gaza.
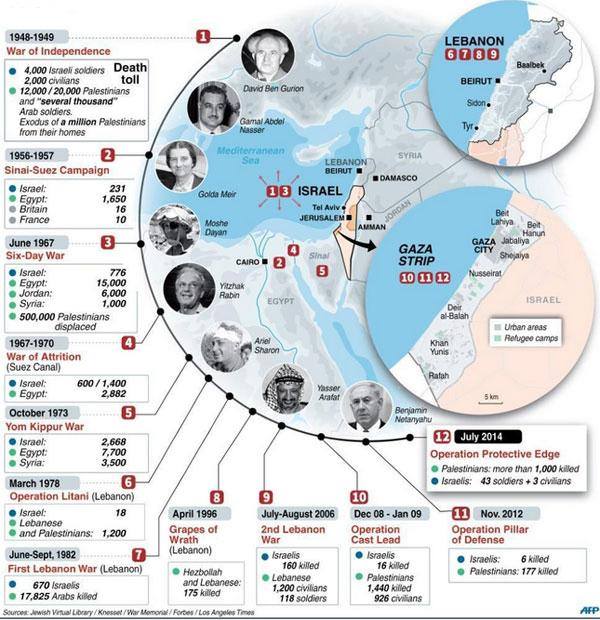
2008-09, 2012, 2014: Major military conflicts erupted between Israel and Hamas, each resulting in significant casualties. The conflicts usually initiated with rocket attacks from Gaza into Israel and were followed by Israeli air strikes, with escalations leading to ground invasions.
Underlying Issues
Several key issues perpetuate the conflict:
Territory: The boundaries and status of Israel and a future Palestinian state remain contentious.
Jerusalem: Both Israelis and Palestinians consider Jerusalem their capital.
Refugees: The Palestinian demand for the right of return of refugees who fled or were expelled during the Arab-Israeli war.
Security: Concerns over recognition, attacks, and the safety of citizens persist on both sides.
The Israel-Hamas conflict is part of the broader Israeli-Palestinian conflict and remains one of the most enduring and complex in modern history.
Concluding Thoughts
While the ongoing events between Israel and Hamas have clear and immediate financial implications, it’s essential to understand their place in the broader geopolitical context.
The changes in energy dynamics and the evolving global power structures play a significant role in shaping these events.
Observing these shifts provides a comprehensive understanding and helps in making informed investment decisions.
As investors, what can we do to protect our portfolio against unexpected events like this?
Let me know in the comments below.
After trading for 18 years, reading 1500+ books, and mentoring 1000+ traders, I specialise in helping people improve their trading results, by using tested trading strategies, and making better decisions via decision science.