• Link to Facebook
  • Link to X
  • Link to Instagram
  • Link to Youtube
  • Link to LinkedIn
  • Link to Mail
Free PDF: The 15-Minute Swing Trader's Checklist, the daily routine of a trader since 2007
Synapse Trading
  • Mentoring
    • Trading Mastery Program
    • All mentoring options
  • Signals
    • Daily trading signals
    • Signals trade log
  • Results
    • Student results and testimonials
    • Public trade log, losses left in
  • Free guides
    • Start here
    • Trading foundations
    • Technical analysis
    • Strategies and systems
    • Risk and money
    • Trading psychology
    • Markets and products
    • Free trading guides
    • Tools and resources
    • Blog
  • About
    • My background
    • My trading journey
    • Media and interviews
    • Travel log
  • Contact
    • Contact me
    • Partnerships
  • Start free
  • Click to open the search input field Click to open the search input field Search
  • Menu Menu

Market analysis, insights and trading ideas on various markets and products!

The Synapse Network

Upside Tasuki Gap

Market Analysis
The upside tasuki gap - candlestick patterns

What Is an Upside Tasuki Gap?

Definition

An Upside Tasuki Gap is a three-bar candlestick formation commonly used to signal the continuation of the current uptrend.

The pattern consists of the following:

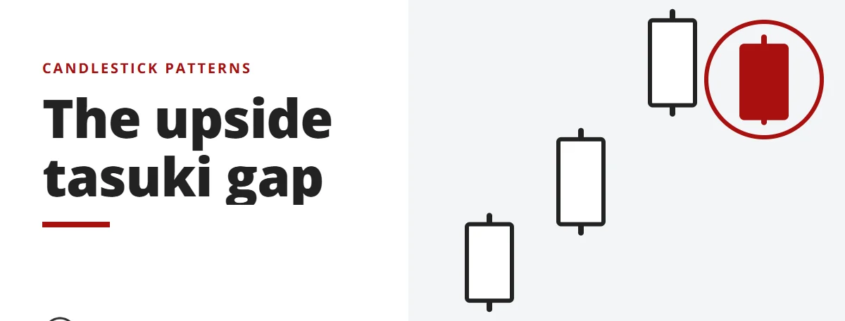
The first bar is a large white/green candlestick within a defined uptrend.

The second bar is another white/green candlestick that opens with a price gap above the close of the previous bar.

The third bar is a black/red candlestick that partially closes the gap between the first two bars.
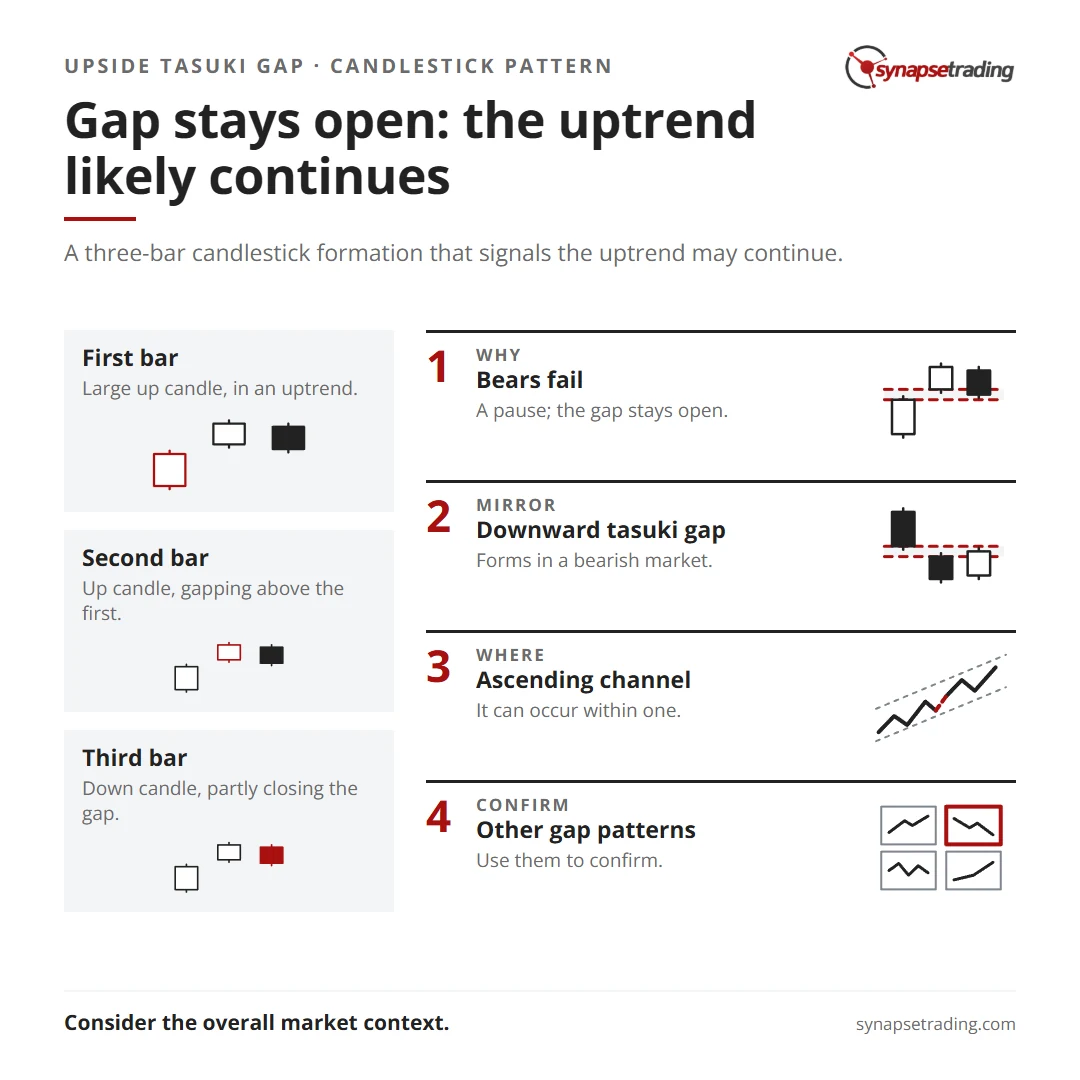
Gap stays open: the uptrend likely continues. Summary card for the post: Upside Tasuki Gap.

Understanding the Upside Tasuki Gap

The Upside Tasuki Gap pattern demonstrates the strength of an uptrend through the gap opening of the pattern’s second candle and its escalating price.

The third candle indicates a pause in the trend as the bears attempt to move the price lower but fail to close the gap between the first and second candles.

The inability of the bears to close this gap suggests that the uptrend is likely to continue.

Traders may also refer to this pattern as a Bullish Tasuki Gap or the Upward Gap Tasuki.

The opposite pattern, which occurs in a bearish market, is known as a Downward Tasuki Gap.

Both patterns are believed to have originated from Japanese technical analysis.

Significance in Trading

The Upside Tasuki Gap is one of many gap patterns that can form during a bullish trend.

Traders often use supporting uptrend gap patterns in conjunction with the Upside Tasuki Gap to confirm a bullish trading strategy.

Gaps represent significant price changes, typically occurring from one trading day to the next, and are crucial for identifying potential trend continuations or reversals.

It is common to see the price of an asset close a gap previously created, which can sometimes result in a slight pullback.

The black/red candlestick forming the Upside Tasuki Gap acts as a minor consolidation period before the bulls continue pushing the price higher.

Upside Tasuki Gap Within an Uptrend

Upside Tasuki Gaps can occur at any time during a bullish trend.

Bullish patterns typically follow a cycle beginning with a breakaway gap that confirms a reversal, followed by several runaway gaps, and concluding with an exhaustion gap.

As the price of a security trends higher, it often forms an ascending channel, which traders construct by drawing two upward-sloping lines at the peak and trough levels of price action.

An Upside Tasuki Gap can occur within this ascending channel and may include one or several of the aforementioned gaps.

Concluding Thoughts

The Upside Tasuki Gap is a significant candlestick pattern for traders looking to identify the continuation of an uptrend.

While it is a strong signal on its own, it is most effective when used in conjunction with other gap patterns and technical analysis tools.

Understanding and recognizing this pattern can provide traders with valuable insights into market trends.

However, it is important to consider the overall market context and use additional indicators to ensure a well-rounded and effective trading strategy.
by The Synapse Network
https://synapsetrading.com/wp-content/uploads/2026/10/upside-tasuki-gap-card.webp 630 1200 The Synapse Network https://synapsetrading.com/wp-content/uploads/2026/10/synapse-logo-horizontal-light.png The Synapse Network2023-08-23 13:25:562026-10-16 17:51:03Upside Tasuki Gap
The Synapse Network

Bullish Separating Lines & Bearish Separating Lines

Market Analysis
Separating lines, bull and bear - candlestick patterns

What is the Separating Lines Pattern?

Definition

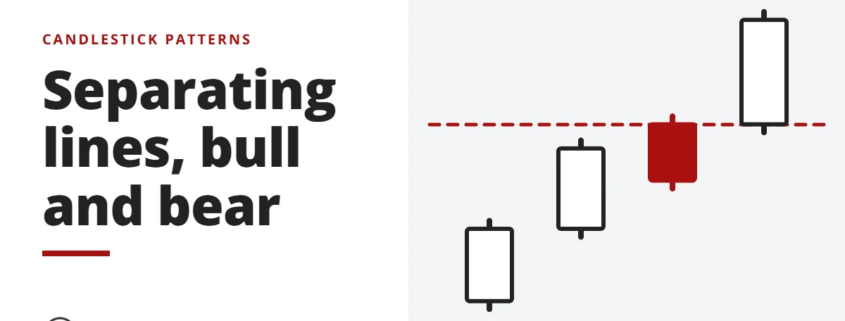
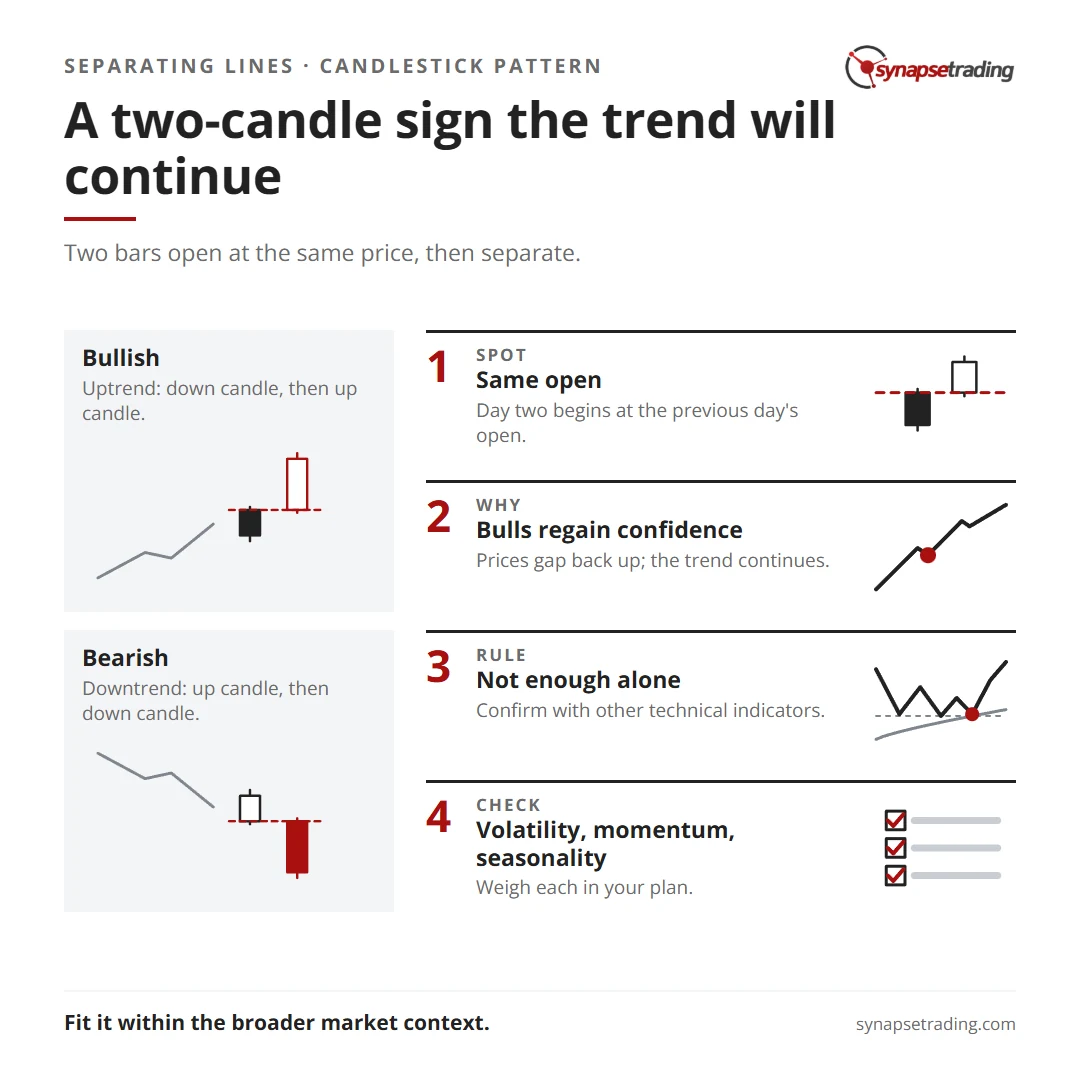
The Separating Lines candlestick pattern is a continuation pattern. In an uptrend, a bearish candle is followed by a bullish candle that opens at the same price the bearish candle opened. In a downtrend, a bullish candle is followed by a bearish candle that opens at the same price the bullish candle opened.

This is a two-candle continuation pattern that can either be bullish or bearish, depending on the previous trend direction.
A two-candle sign the trend will continue. Summary card for the post: Bullish Separating Lines & Bearish Separating Lines.

Bullish Separating Lines

A bullish separating lines pattern is a two-candle bullish continuation candlestick pattern that appears in the middle of a bullish trend.

It indicates that the current bullish trend is about to continue after a temporary pullback.

The most common interpretation is that a bullish separating line shows that the current bullish trend will continue after a small pullback.

The pattern is made up of two candles, with the first being bearish and the second bullish.


Characteristics

– The first candle is bearish.
– The second candle gaps up and opens at the same price as the previous candle’s open.
– The second candle closes higher than it opened.

Bearish Separating Lines

The bearish separating line is a bearish continuation pattern.

The first line is a white candle that forms as a long line in a downtrend.

The second line is a black candle that forms as a long line.

Both bars will open at the same price, and then the prices start separating.

Characteristics

– The first candle is positive and forms in a negative trend.
– The second candle is negative, gaps down and opens at the same price as the previous candle’s open.

How to Identify the Separating Lines Pattern?

Criteria

– A day occurs when there’s an uptrend, and it is the opposite color of the current trend.
– The second day begins at the open of the previous day.
– The second day should open on its low for the day and then go higher.

Pattern Psychology

During the uptrend, a black or red body forms.

This leads to some concern for the bulls, but the next day the prices gap back up to the open of the previous day.

When this happens, the bulls regain confidence, and the trend continues.

Candlestick signals detect where money is flowing in and out of stocks.

Understanding the trader psychology behind candlestick signals offers a great advantage, allowing traders to participate in investments with a high probability of success.

What Does the Separating Lines Tell Traders?

Bullish Separating Lines

After an established uptrend, where the bulls dominate the market, the bears take control temporarily.

The price goes down during the bears’ control, but their time in power is short.

On the second day, the price rises sharply, opening at the same level the previous day opened.

The uptrend is expected to continue as the bulls regain control.

The pattern shows the strength of the trend, indicating that even after a setback, the bulls will come back with full force.

Bearish Separating Lines

In a downtrend, the bears are in control until the bulls temporarily take over.

However, the bears quickly regain control on the second day, and the price drops again.

The downtrend is expected to continue, showing that the bears remain strong and the trend is unlikely to reverse.

How to Trade When You See the Separating Lines Pattern?

Considerations

While candlestick patterns are valuable, they are not enough on their own to make a trade.

It’s crucial to incorporate other types of technical analysis to support predictions.

Some key factors to consider in your trading plan include:

– Volatility: Some patterns work better with high or low volatility.
– Momentum: The momentum of a market impacts the performance of many strategies.
– Seasonality: Analyze the time of day, part of the month, or day of the week to identify bullish or bearish tendencies.

Concluding Thoughts

The Separating Lines pattern, whether bullish or bearish, provides valuable insights into the continuation of current market trends.

While it offers strong signals, it is important to confirm this pattern with other technical indicators and to ensure it fits within the broader market context.

A well-rounded trading strategy should consider factors such as volatility, momentum, and seasonality to improve the accuracy and success of trades based on the Separating Lines pattern.

by The Synapse Network
https://synapsetrading.com/wp-content/uploads/2026/10/bullish-separating-lines-bearish-separating-lines-card.webp 630 1200 The Synapse Network https://synapsetrading.com/wp-content/uploads/2026/10/synapse-logo-horizontal-light.png The Synapse Network2023-08-19 18:30:152026-09-10 13:00:46Bullish Separating Lines & Bearish Separating Lines
The Synapse Network

Bullish Atekubi & Bearish Atekubi

Market Analysis
Atekubi, the on-neck line - candlestick patterns

Above the Neckline – Bullish Atekubi

Definition

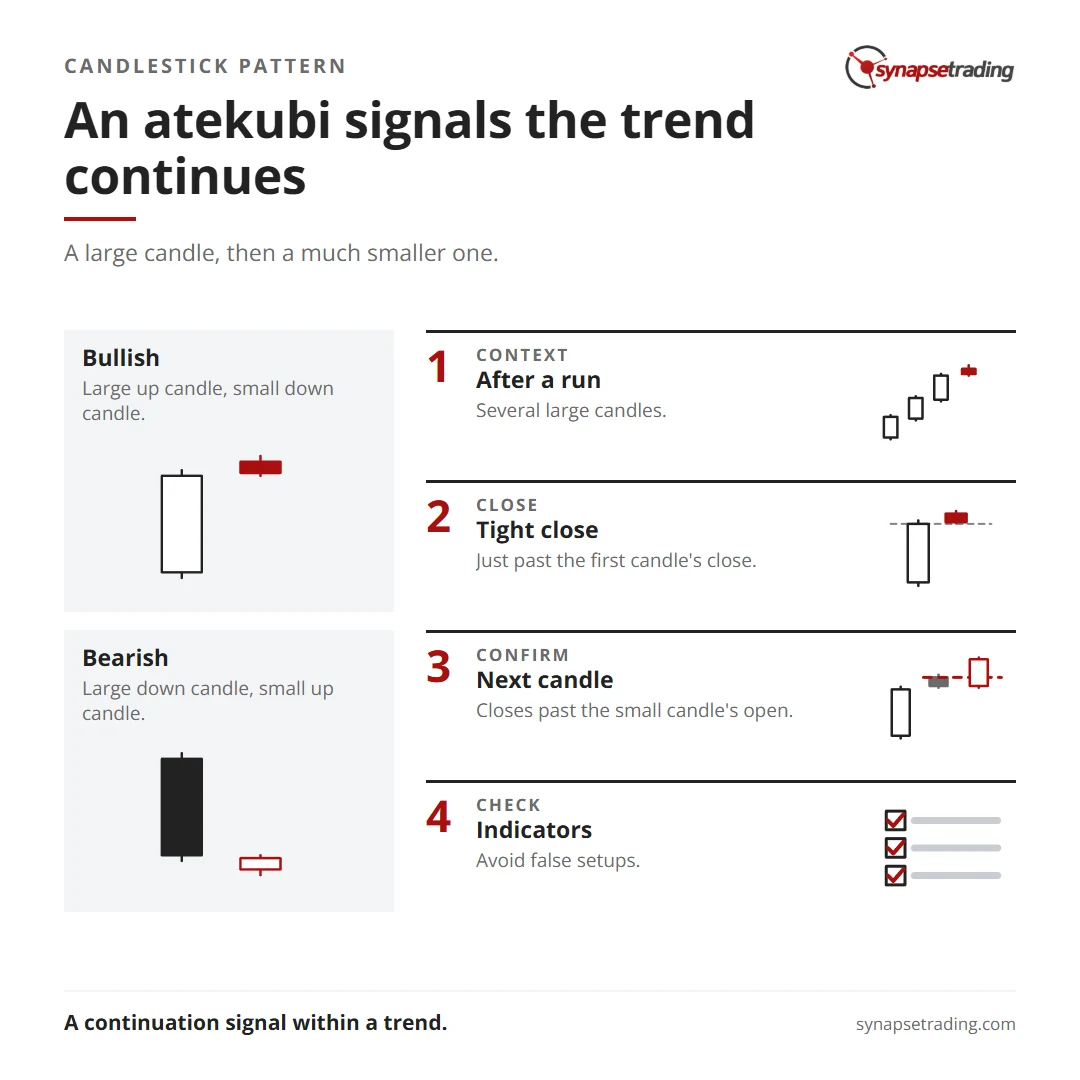
A bullish atekubi (line above the neckline) is a structure comprised of two Japanese candlesticks.

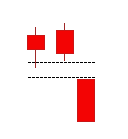
The first candlestick is a large bullish candlestick (green), followed by a small bearish candlestick (red) with a closing just above the closing level of the previous candlestick.

The second candlestick must be significantly smaller than the first.

Illustration

bullish atekubi

Characteristic

A bullish atekubi often forms after a significant increase characterized by several large green Japanese candlesticks.

Significance

A line above the neckline (bullish atekubi) is a continuation pattern, indicating a continuation of the bullish movement.

Note

For the structure to be validated, the next candlestick must be bullish and close above the opening level of the small bearish candlestick (red).

Invalidation

If the next candlestick breaks below the lowest point of the small bearish candlestick, the structure can be considered invalidated.
An atekubi signals the trend continues. Summary card for the post: Bullish Atekubi & Bearish Atekubi.

Below the Neckline – Bearish Atekubi

Definition

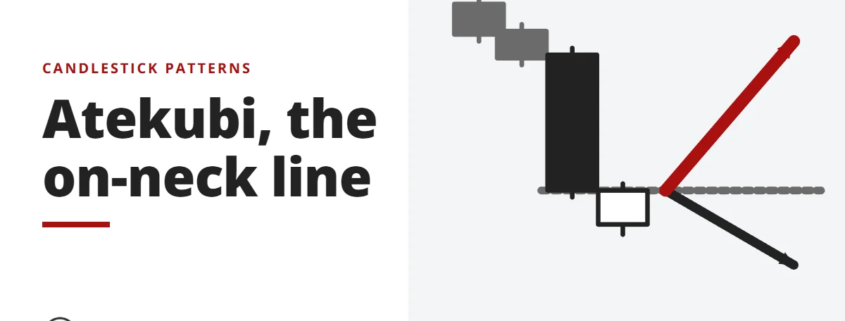
A bearish atekubi (line below the neckline) is a structure comprised of two Japanese candlesticks.

The first candlestick is a large bearish candlestick (red), followed by a small bullish candlestick (green) with a closing just below the closing level of the previous candlestick.

The second candlestick must be significantly smaller than the first.

Illustration

bearish atekubi

Characteristic

A bearish atekubi often forms after a significant decline characterized by several large red Japanese candlesticks.

Significance

A line below the neckline (bearish atekubi) is a continuation pattern, indicating a continuation of the bearish movement.

Note

For the structure to be validated, the next candlestick must be bearish and close below the opening level of the small bullish candlestick (green).

Invalidation

If the next candlestick breaks above the highest point of the small bullish candlestick, the structure can be considered invalidated.

Concluding Thoughts

The bullish and bearish atekubi patterns are valuable continuation signals within a trending market.

They provide insight into the potential for ongoing momentum in the direction of the current trend, offering traders opportunities to position themselves accordingly.

However, as with all candlestick patterns, confirmation from subsequent candlesticks and additional technical indicators is crucial to ensure the reliability of the signal and to avoid false setups.

by The Synapse Network
https://synapsetrading.com/wp-content/uploads/2026/10/bullish-atekubi-bearish-atekubi-card.webp 630 1200 The Synapse Network https://synapsetrading.com/wp-content/uploads/2026/10/synapse-logo-horizontal-light.png The Synapse Network2023-08-19 18:27:112026-10-10 21:04:39Bullish Atekubi & Bearish Atekubi
The Synapse Network

Bullish Gapping Play & Bearish Gapping Play

Market Analysis
Gapping plays, bull and bear - candlestick patterns

Bullish Gapping Play

Definition

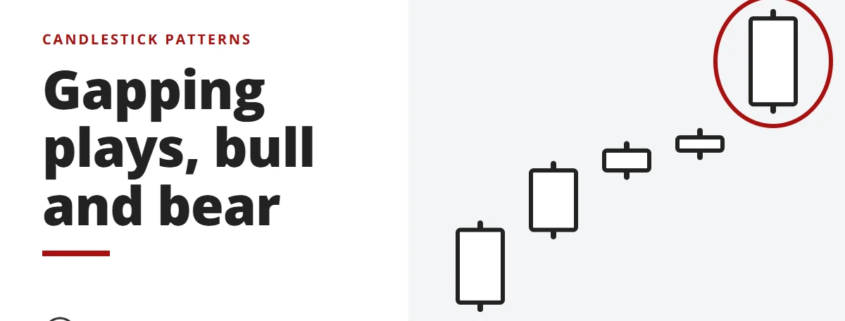
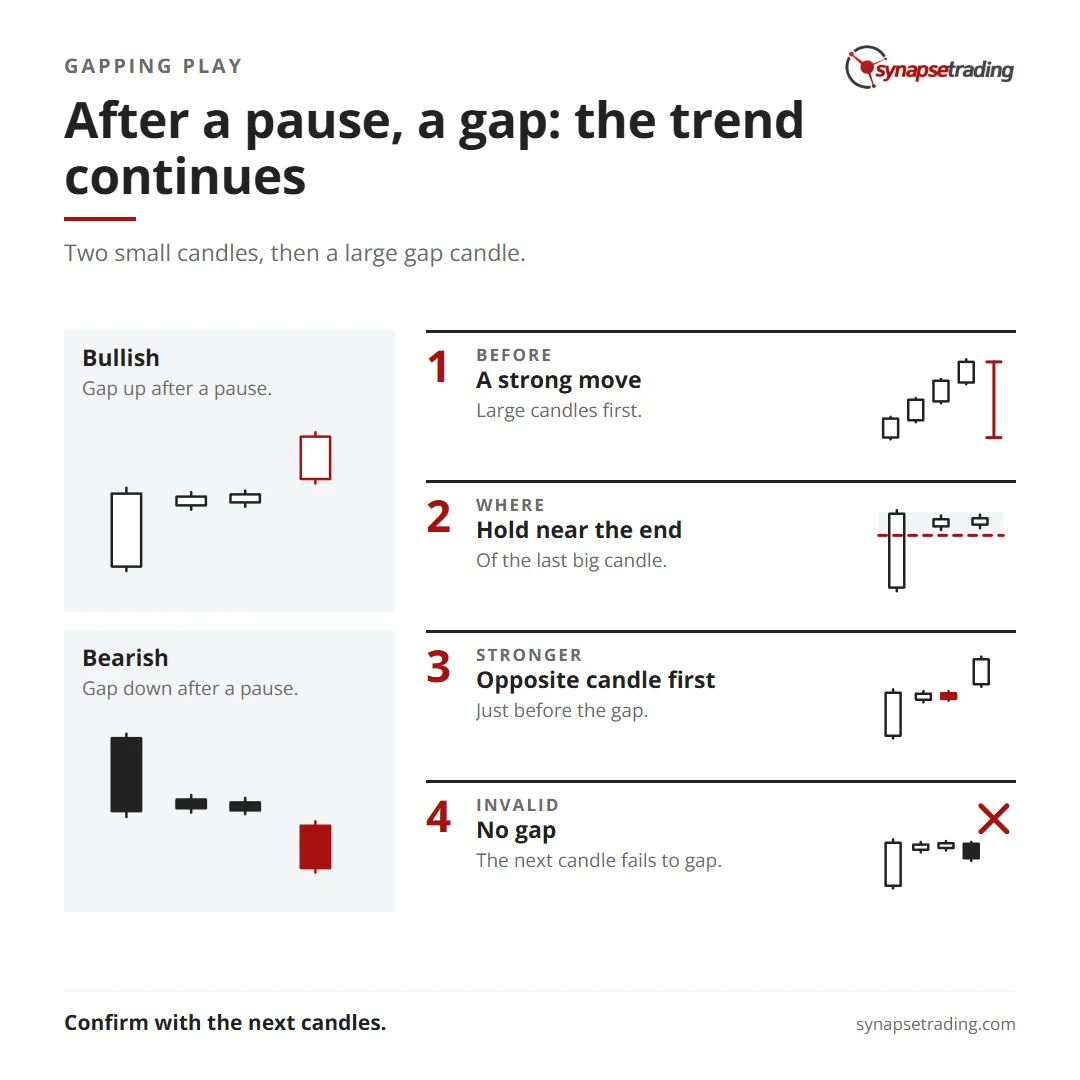
A bullish gapping play structure is comprised of three Japanese candlesticks.

The first two are small and bullish (green), indicating hesitation.

The opening of the third candlestick occurs with a bullish gap, and this candlestick must be large.

Illustration

bullish caping

Characteristic

A bullish gapping play follows a period of hesitation, represented by small candlesticks, after a significant increase characterized by several large green Japanese candlesticks.

The small candlesticks before the gap must remain in the upper area of the last large candlestick.

Significance

A bullish gapping play is a continuation pattern, serving as a strong signal that the bullish movement will continue.

Note

A bullish gapping play is considered stronger if the candlestick before the gap is red.

Invalidation

If the next candlestick is not bullish or does not open with a bullish gap, the bullish gapping play structure is invalidated.
After a pause, a gap: the trend continues. Summary card for the post: Bullish Gapping Play & Bearish Gapping Play.

Bearish Gapping Play

Definition

A bearish gapping play structure is comprised of three Japanese candlesticks.

The first two are small and bearish (red), indicating hesitation.

The opening of the third candlestick occurs with a bearish gap, and this candlestick must be large.

Illustration

bearish gaping

Characteristic

A bearish gapping play follows a period of hesitation, represented by small candlesticks, after a significant decline characterized by several large red Japanese candlesticks.

The small candlesticks before the gap must remain in the lower zone of the last large candlestick of the descent.

Significance

A bearish gapping play is a continuation pattern, serving as a strong signal that the bearish movement will continue.

Note

A bearish gapping play is considered stronger if the candlestick before the gap is green.

Invalidation

If the next candlestick is not bearish or does not open with a bearish gap, the bearish gapping play structure is invalidated.

Concluding Thoughts

The bullish and bearish gapping play patterns are important continuation signals in technical analysis, highlighting potential ongoing trends after brief periods of hesitation.

These patterns gain additional strength if the candlestick preceding the gap is of the opposite color, suggesting a failed attempt to reverse the trend.

However, traders should always be vigilant and confirm the pattern with subsequent candlestick behavior, as invalidation occurs if the next candlestick does not follow the expected direction with a gap.

As with all technical indicators, it’s advisable to use these patterns in combination with other analytical tools for a well-rounded trading strategy.

by The Synapse Network
https://synapsetrading.com/wp-content/uploads/2026/10/bullish-gapping-play-bearish-gapping-play-card.webp 630 1200 The Synapse Network https://synapsetrading.com/wp-content/uploads/2026/10/synapse-logo-horizontal-light.png The Synapse Network2023-08-18 16:55:182026-09-19 19:04:06Bullish Gapping Play & Bearish Gapping Play
The Synapse Network

Best Forex Trading Entries to Take a Trade Position

Market Analysis
Best forex entries to take - forex

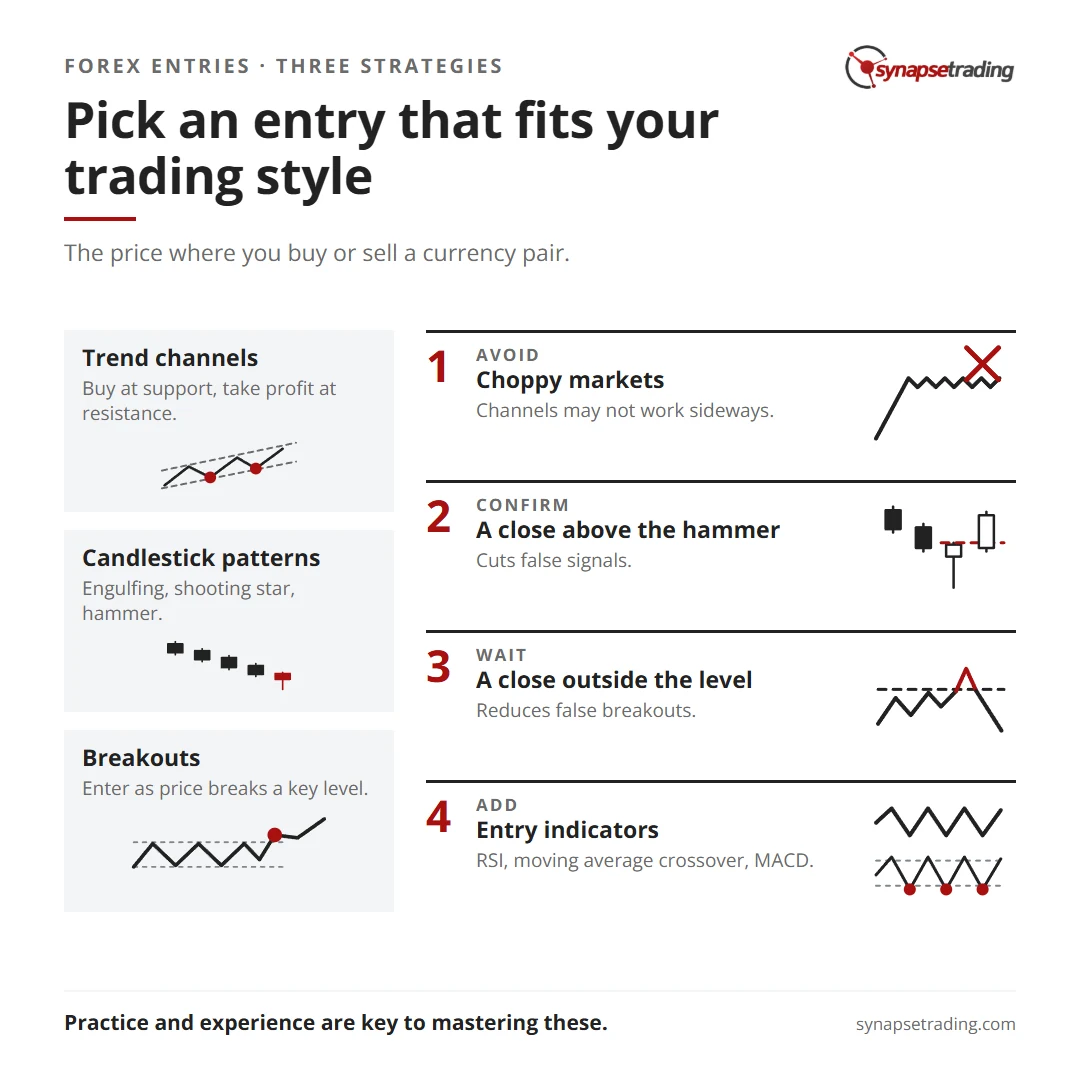
A forex entry point is the specific price level or position at which a trader decides to enter a trade, either by buying or selling a currency pair. Determining the right entry point is crucial for successful trading, as it directly impacts the potential profitability and risk of the trade. However, choosing an entry point can be complex due to the various factors that influence forex market movements. Below, we explore how to identify effective forex entry points through three popular strategies: trend channels, candlestick patterns, and breakouts.
Pick an entry that fits your trading style. Summary card for the post: Best Forex Trading Entries to Take a Trade Position.

When is the Best Time to Enter a Forex Trade?

The ideal time to enter a forex trade depends on your trading strategy and style. Different approaches suit different market conditions and trader preferences. The following are three commonly used strategies for determining entry points:

Forex Entry Strategy #1: Trend Channels

Trend channels are a fundamental tool in technical analysis, used to identify support and resistance levels within a trending market. In an uptrend, for example, the price typically makes higher highs and higher lows, forming a channel. Traders can use these channels to establish a bias for buying at support (the lower boundary of the channel) and taking profit at resistance (the upper boundary). If the price breaks through these key levels, it could signal a potential breakout or reversal in the trend.

Pros:
– Clear visual representation of market trends.
– Provides defined entry and exit points.
– Effective in trending markets.

Cons:
– May not work well in choppy or sideways markets.
– Requires ongoing market monitoring to adjust channels.
– Breakouts can sometimes lead to false signals.

Forex Entry Strategy #2: Candlestick Patterns

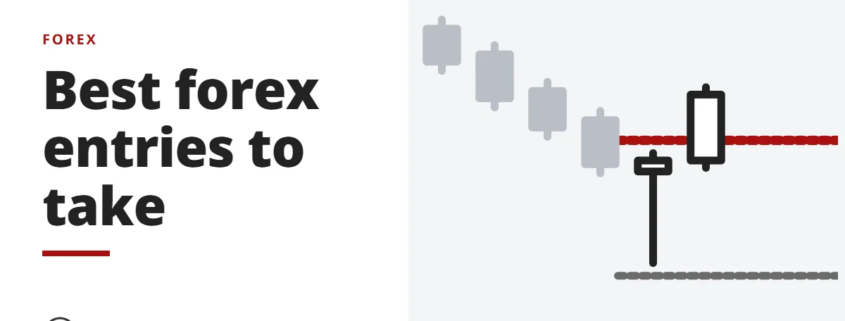
Candlestick patterns are powerful tools for identifying potential entry points in the forex market. Patterns such as engulfing, shooting star, and hammer are frequently used by traders to signal reversals or continuations. For instance, the hammer candlestick pattern often indicates a potential reversal in a downtrend. However, traders should not rely solely on the pattern itself. A confirmation, such as a close above the hammer candle, strengthens the validity of the entry point, reducing the risk of false signals.

Pros:
– Provides early signals for potential market reversals.
– Easy to identify with practice.
– Can be combined with other indicators for stronger signals.

Cons:
– Requires confirmation to avoid false signals.
– May not be effective in all market conditions.
– Some patterns can be subjective and open to interpretation.

Forex Entry Strategy #3: Breakouts

Breakout trading is a widely used strategy that involves identifying key levels of support and resistance and entering trades when the price breaks through these levels. Breakouts can signal a strong move in the direction of the breakout, making this strategy particularly appealing to novice traders. For instance, if the price breaks below a key support level with increased volume, this may indicate a strong bearish trend, prompting a sell entry. Some traders prefer to wait for a confirmation candle to close outside the key level before entering the trade to reduce the risk of a false breakout.

Pros:
– Simple and straightforward strategy, ideal for beginners.
– Effective in volatile markets where significant price movements occur.
– Can capture strong directional moves.

Cons:
– False breakouts can result in losses.
– Requires quick decision-making and market monitoring.
– May involve higher risk in volatile markets.

Popular Forex Entry Indicators

Forex entry indicators are often used in conjunction with the strategies mentioned above to enhance decision-making. Here are some of the most popular forex entry indicators and how they are applied:

Entry IndicatorUse
RSIIdentifies overbought and oversold conditions. Most effective in range-bound and trending markets.
Moving Average (MA) CrossoverTraders look for crossovers between short and long period MAs to generate entry signals.
MACDWorks best in range or trending markets, with crossover points used to signal entries in the direction of the trend.

Concluding Thoughts

Identifying the right forex entry point is a critical aspect of successful trading. Whether you prefer using trend channels, candlestick patterns, or breakout strategies, it’s essential to choose an approach that aligns with your trading style and risk tolerance. Combining these strategies with popular entry indicators can further refine your entry points, helping to increase your chances of making profitable trades. Remember, practice and experience are key to mastering these techniques and achieving consistent results in the forex market.

by The Synapse Network
https://synapsetrading.com/wp-content/uploads/2026/10/best-forex-trading-entries-to-take-a-trade-position-card.webp 630 1200 The Synapse Network https://synapsetrading.com/wp-content/uploads/2026/10/synapse-logo-horizontal-light.png The Synapse Network2023-08-11 05:03:092026-10-10 17:03:38Best Forex Trading Entries to Take a Trade Position
Page 6 of 13«‹45678›»

Free checklist

The 15-Minute Swing Trader’s Checklist

The daily and weekly routine I use to find, manage and review trades in about 15 minutes a day, trading since 2007.

Get the free checklist

Topics

  • Trading foundations
  • Technical analysis
  • Strategies and systems
  • Risk and money
  • Trading psychology
  • Markets and products

Synapse Trading

Swing trading for busy professionals, in 15 minutes a day.

Start free

Learn

  • Start here
  • Free trading guides
  • Blog
  • Tools and resources

Programs

  • Trading Mastery Program
  • Daily trading signals
  • Student results
  • Public trade log

Company

  • About
  • Contact me
  • Partnerships
  • Disclaimer
  • Privacy policy
  • Terms & Conditions

Synapse Trading Pte Ltd
Registration No. 201316168H
WhatsApp +65-8897-1204
info@synapsetrading.com

Contact Us

Synapse Trading Pte Ltd
Registration No. 201316168H

Whatsapp: +65-8897-1204
Telegram: @iamrecneps
Email: info@synapsetrading.com

Links

Disclaimer
Privacy policy
Terms & Conditions
Contact us
Partnerships

© 2012-2026 Synapse Trading | All rights reserved. Educational content only, not personalised financial advice. Trading carries risk, including loss of capital. Past performance is not indicative of future results. Synapse Trading is not licensed or regulated by MAS.
  • Link to Facebook
  • Link to X
  • Link to Instagram
  • Link to Youtube
  • Link to LinkedIn
  • Link to Mail
Scroll to top Scroll to top Scroll to top