As we look back on 2023 and look forward to the rest of 2024, what are some of the best investment and trading opportunities across various asset classes that we can invest in at the moment?
In this video collaboration with XM brokerage, I will cover various asset classes such as stocks, stock sectors, bonds, commodities, cryptocurrencies, and analyse which ones give the best upside potential.
For this blog post, the first part will be a review of 2023, looking at what the investment themes were, and how various asset classes performed.
The second part will be looking at the investment themes for 2024, macro-economic outlook, and lasted the projected market performance of each asset class, and whether it will be a good investment.
Overview of 2023
2023 marked a significant year in the world of finance, characterized by recovery and realignment in the wake of the COVID-19 pandemic. Technology and consumer discretionary sectors notably rebounded, outperforming defensive sectors as they adapted to post-pandemic economic conditions and shifts in consumer behavior.
Central banks, particularly the Federal Reserve, played a pivotal role in this landscape through strategic interest rate adjustments in response to previous high inflation rates. These policy shifts greatly influenced bond markets, especially those sensitive to interest rates, while commodities like oil, gas, and gold saw notable price movements reflecting global economic trends and investor sentiment towards safe-haven assets.
The year also witnessed challenges in the banking sector, highlighted by a regional banking crisis in spring 2023, which tested financial system resilience and prompted intervention by central banks and authorities.
Geopolitical tensions further shaped the financial narrative, affecting currency values and investment strategies globally. Cryptocurrencies experienced a resurgence, highlighting renewed investor interest and confidence in digital assets.
Overall, 2023 was a testament to the adaptability and resilience of global financial markets, navigating through a complex mix of economic challenges, policy shifts, and geopolitical events. This review encapsulates these developments, providing insights into market performances and implications for the future.
Top Investment Themes of 2023
Revival of Technology Stocks: The year 2023 witnessed a remarkable resurgence in technology stocks, with the leading “Magnificent 7” mega-cap tech stocks, including Apple, Amazon, and Microsoft, propelling the sector forward. This renaissance in tech stocks, after a period of relative underperformance, underscored the sector’s resilience and innovation capacity.
Generative AI Revolution: Another significant investment theme was the surge in interest in generative AI technologies. Companies involved in AI development and application attracted substantial investment, indicating the market’s recognition of AI’s potential as a transformative force in the economy.
Cryptocurrency Recovery: The cryptocurrency market rebounded in 2023, marking an end to the previous year’s downturn. This recovery was partly fueled by expectations around the introduction of a Bitcoin ETF, which boosted investor confidence and prices.
Market Performance of Various Asset Classes in 2023
Equities
Technology and Consumer Discretionary Sectors: In 2023, the equity market was led by a remarkable comeback in technology and consumer discretionary stocks. The rebound was fueled by investor optimism about future growth prospects, technological innovations, and a shift in consumer spending patterns. Tech giants, often referred to as the “Magnificent 7,” including Apple, Amazon, and Microsoft, demonstrated strong performance, significantly outperforming the broader market. This resurgence indicated investor confidence in the tech sector’s ability to navigate through economic uncertainties.
Defensive Sectors: In contrast, defensive sectors such as utilities, healthcare, and consumer staples underperformed. This trend was largely attributed to their sensitivity to rising interest rates and a general shift in investor preference towards more growth-oriented stocks. Investors typically turn to defensive stocks for stability and consistent dividends, but in 2023, the focus was clearly on growth and recovery potential.
Bonds
Interest Rate Sensitivity: The bond market in 2023 was significantly impacted by the economic landscape, particularly the rising interest rates. Government bonds and other interest rate-sensitive bonds saw a decline in value. As central banks, especially the Federal Reserve, continued to adjust interest rates to combat inflation, bond prices moved inversely. The yield on these bonds rose, reflecting increased risk and reduced demand.
Commodities
Oil and Gas Stocks: The commodities market, especially oil and gas stocks, experienced a strong year. High energy prices were a key driver of this performance, influenced by ongoing geopolitical tensions and supply constraints. Energy companies benefited from increased demand as global economies recovered from the pandemic-induced slowdown, leading to higher revenues and stock prices.
Gold
Safe-Haven Appeal: Gold witnessed a significant rally in 2023, with prices reaching levels not seen since 2020. This surge was primarily driven by investors seeking safe-haven assets amid economic uncertainties and inflation concerns. Gold’s traditional role as a hedge against inflation and currency devaluation came into play, as investors diversified their portfolios away from more volatile assets.
Oil
Robust Prices: Oil prices remained strong throughout 2023. This robustness can be attributed to a combination of factors, including sustained global demand, geopolitical tensions, and supply-side constraints. The ongoing conflict in Ukraine, tensions in the Middle East, and OPEC’s supply management contributed to the price stability and strength in the oil market.
USD and Crypto
USD Fluctuations: The U.S. dollar experienced fluctuations as a result of the geopolitical tensions and varying economic policies across different nations. While traditionally a safe-haven currency, the dollar’s value was influenced by domestic inflation concerns and the Federal Reserve’s monetary policy decisions.
Cryptocurrency Recovery: Cryptocurrencies rebounded from their previous downturn, witnessing significant gains in 2023. This recovery was spurred by growing mainstream adoption, the potential launch of Bitcoin ETFs, and an increasing perception of cryptocurrencies as alternative investment vehicles. Bitcoin and other major cryptocurrencies regained investor interest, suggesting a more stable footing for the crypto market going forward.
This detailed analysis of various asset classes in 2023 highlights a complex financial landscape shaped by macroeconomic factors, geopolitical tensions, and shifting investor sentiments. Each asset class responded uniquely to these dynamics, reflecting the diverse and interconnected nature of global financial markets.
Top Investment Themes of 2024
Emergence of AI as a Key Driver: The year 2024 is set to see artificial intelligence (AI) solidify its position as a dominant investment theme. Following a surge in AI-related investments in 2023, companies in the tech sector, particularly those involved in semiconductors, computer hardware, and software, are expected to lead the charge. The focus is likely to shift towards companies that adopt AI for enhancing productivity across various industries.
Renewed Interest in Specific Stock Sectors: The real estate and financial sectors, having experienced turbulent times in the recent past, are anticipated to make a strong comeback. These sectors are poised to benefit from the easing monetary policies and are expected to outperform the broader market.
Growing Significance of Cryptocurrency: After a period of recovery and regulatory shifts in 2023, digital currencies are expected to gain further traction. This resurgence is likely driven by increasing mainstream adoption, innovations in blockchain technology, and a growing recognition of cryptocurrencies as alternative investment vehicles. With regulatory frameworks becoming clearer and more investor-friendly, the crypto market could see enhanced stability and growth, attracting both retail and institutional investors.
Macroeconomic Outlook & Important Factors
Modest Global Economic Growth: The global economic landscape in 2024 is expected to be characterized by gradual yet steady growth. Analysts predict this trend to persist until at least mid-2025, marking a phase of elongated expansion, albeit at a subdued pace compared to previous years. The U.S. economy, in particular, is expected to play a crucial role in this scenario. Its ability to effectively manage and navigate through ongoing inflationary pressures will be critical. If the U.S. succeeds in balancing growth with inflation control, it could set a positive tone for the global economy. However, the risk remains that aggressive measures to combat inflation could inadvertently lead to a slowdown or even a recession.
European Economy: Europe’s economic outlook for 2024 appears more complex. High energy prices, partly driven by ongoing geopolitical tensions and supply chain disruptions, are likely to pose significant challenges. These factors could constrain consumer spending and business investment, leading to subdued economic growth. The UK, however, might stand out as an exception. Its economy shows potential for optimism, supported by robust sector compositions that could attract investment and offer valuation support. This optimism in the UK could be driven by a combination of fiscal policies, a responsive monetary framework, and a potentially more stable political environment post-Brexit.
Global Supply Chain Dynamics: Supply chain disruptions have been a key factor affecting global economies since the pandemic. In 2024, the extent to which these supply chains recover or face further disruptions due to geopolitical tensions or other factors will impact production costs, inflation rates, and overall economic growth.
Geopolitical Tensions and Trade Policies: Ongoing conflicts, such as the situation in Ukraine and the Middle East, can affect global trade and economic stability. Additionally, trade policies and relations, particularly involving major economies like the U.S., China, and the EU, will influence global economic dynamics.
Technological Advancements and Digital Transformation: Rapid advancements in technology, especially in fields like AI, 5G, and green energy, could lead to increased productivity and open new markets. However, they also pose challenges related to workforce adaptation and potential job displacements.
Labor Market Trends: The nature of the labor market recovery post-COVID-19, including workforce participation rates, wage growth, and remote working trends, will be crucial. These factors affect consumer spending, business investment decisions, and overall economic health.
Environmental Concerns and Sustainability Initiatives: Climate change and sustainability are increasingly influencing economic policies. Initiatives for green energy and sustainable practices could drive investment in new sectors but also imply transitions for traditional industries.
Fiscal Policies of Governments: Government spending and debt levels, particularly in response to the COVID-19 pandemic, will continue to have significant implications. How governments manage fiscal policies to stimulate growth or combat inflation without exacerbating debt levels will be crucial.
Consumer Behavior and Confidence: Consumer spending is a major driver of economic growth. Changes in consumer behavior, influenced by factors like digitalization, health concerns, and economic confidence, will play a key role in shaping economic outcomes.
Healthcare Developments: While the acute phase of the COVID-19 pandemic might be over, the global health landscape continues to evolve. Any new health crises or significant developments in healthcare could have economic implications.
Central Bank Independence and Credibility: The ability of central banks to act independently and credibly manage monetary policy is essential for economic stability. Any perceived or actual loss of independence could impact financial markets and economic confidence.
Cybersecurity and Data Privacy: With the increasing digitalization of economies, cybersecurity threats and data privacy concerns could impact consumer confidence, corporate investment, and the integrity of financial systems.
US Presidential Election: Historically, U.S. stock markets have performed well in presidential election years. The outcome of the 2024 election could have significant implications for market sentiment and economic policy.
Inflation and Interest Rates
In 2024, a key focus will be on the monetary policy stance of major central banks, especially the Federal Reserve. With inflation expected to continue its downward trajectory, partly due to easing energy pressures and a stabilizing labor market, the anticipation is for a series of interest rate cuts. However, the path to these reductions is fraught with uncertainties.
The Federal Reserve and other central banks will likely tread cautiously, balancing the need to support economic growth with the imperative to ensure inflation is under control. The timing and extent of these rate cuts will depend on a range of factors, including inflation trends, labor market conditions, and overall economic health.
There’s a potential scenario where rate cuts could be implemented more swiftly if there’s clear evidence of recessionary pressures or a significant easing of inflation, however if inflation remains a concern, then rate cuts could be delayed.
Potential Recession: Hard or Soft Landing?
The Federal Reserve’s Balancing Act
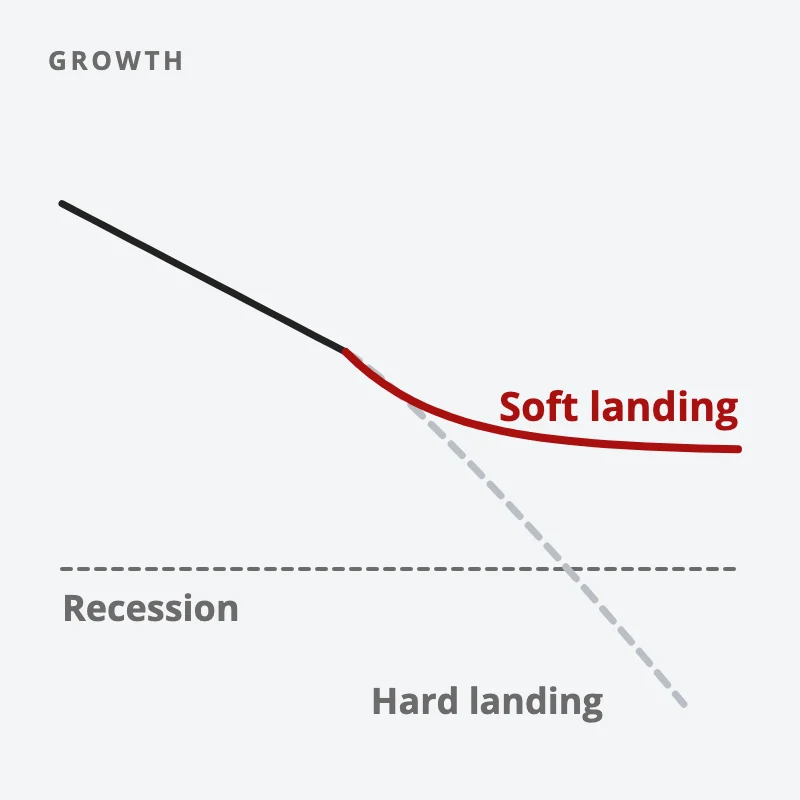
The Federal Reserve faces a critical challenge in 2024: achieving a “soft landing” for the U.S. economy. This involves slowing down economic growth sufficiently to control inflation without pushing the economy into a recession. The task is daunting, especially considering the rapid pace of interest rate hikes witnessed recently. These hikes were a response to inflation rates that soared to multi-decade highs, with the Consumer Price Index (CPI) peaking at 9.1% in June 2022 before gradually declining.
Economic Growth vs. Inflation
The U.S. economy’s growth rate in 2023 was robust, with a 5.2% annualized increase in GDP in Q3, as reported by the Bureau of Economic Analysis. This growth, however, was accompanied by inflationary pressures. The Fed’s aggressive interest rate hikes aimed to cool down these inflationary trends. The central question for 2024 is whether these policies will result in a controlled slowdown or tip the economy into a recession.
Historical Context and Predictive Indicators
Historically, rapid rate hikes have often preceded economic downturns. For example, before the 2008 financial crisis, the Fed raised rates 17 times from 2004 to 2006. The current situation, however, differs due to unique post-pandemic economic conditions, including supply chain disruptions and a sudden surge in consumer demand.
One predictive indicator of a recession is the yield curve inversion, which has preceded every U.S. recession since 1955 with only one false signal. As of late 2023, parts of the U.S. Treasury yield curve have inverted, which traditionally signals market expectations of a future economic slowdown.
Labor Market Considerations
The labor market remains a critical factor. As of late 2023, unemployment rates were low, but there were signs of cooling. The job market’s resilience will be a key determinant of whether the economy can achieve a soft landing. A significant rise in unemployment could signal a move towards recession, whereas stable employment could support a soft landing.
Sector-Specific Impacts
Different economic sectors may react differently to the Fed’s policies. For instance, the housing market, often sensitive to interest rate changes, has already shown signs of slowing down in 2023. Conversely, sectors like technology might continue to thrive or recover quickly, partly due to continued innovation and demand for digital services.
Global Economic Influences
The U.S. economy does not operate in isolation. Global economic conditions, including European economic stability, China’s economic policies, and international trade relations, will also influence the U.S.’s ability to achieve a soft landing.
The Path Forward
For 2024, much depends on the interplay between continued inflation control and maintaining economic growth. Analyst forecasts vary, with some expecting slow yet positive growth and others cautioning about the risk of a mild recession. The Federal Reserve’s actions in the first half of 2024 will be particularly pivotal.
If inflation rates continue to decline and economic indicators like consumer spending and manufacturing output remain healthy, the likelihood of a soft landing increases. Conversely, if inflation remains stubbornly high or if economic indicators weaken significantly, the Fed may face tough choices, potentially leading to a hard landing scenario.
While the Federal Reserve aims for a soft landing of the U.S. economy in 2024, the outcome is far from certain. It will depend on a range of factors, including inflation trends, labor market conditions, sectoral health, and global economic influences. As such, economists, policymakers, and investors will be closely monitoring these developments throughout the year.
Projected Market Performance of Various Asset Classes
Stocks and Specific Sectors
S&P 500 Projections: The S&P 500, after a strong showing in 2023, is expected to see more moderate gains in 2024. Analysts forecast an 8-9% increase, slightly below the historical average of about 10%. The key drivers are projected to be AI and technology stocks.
AI and Technology Stocks: Companies like Nvidia, which surged 234% in 2023, are poised to continue their growth trajectory, driven by the demand for AI applications in various sectors. Other notable AI-related stocks include C3.ai and Palantir Technologies. Big tech firms like Alphabet, Amazon, Apple, and Microsoft are also expected to remain pivotal.
Large-Cap Resilience vs. Small/Mid-Cap Challenges: Large-cap stocks, particularly in the technology sector, are expected to be more resilient. In contrast, small and mid-cap stocks may struggle due to higher financing costs and economic slowdown. The performance of the Invesco S&P 500 Equal Weight ETF and the Direxion Nasdaq 100 Equal Weighted ETF could be indicative of this trend.
Emerging Markets
Volatility and Attractiveness: Emerging markets are predicted to experience initial volatility but could become increasingly attractive, especially if the U.S. dollar weakens. This attractiveness could be enhanced if growth in emerging markets outpaces that in developed markets.
Regional Prospects: Asian emerging markets, in particular, may see growth acceleration, potentially outweighing steady growth in EMEA (Europe, the Middle East, and Africa) and a slowdown in Latin America. China’s economy, after a period of lag in 2023, is expected to perform better if growth momentum picks up and geopolitical risks remain contained.
Bonds
Lower Interest Rate Environment: With expectations of rate cuts in 2024, bonds, particularly government bonds, could regain their appeal. The performance of bonds will be closely tied to the trajectory of inflation and economic growth.
Yield Predictions: Analysts predict that 10-year yields could decrease to around 3.75% by the end of 2024, from the mid-year forecast of 4.25%.
Commodities
Oil and Gold in Focus: Oil prices are anticipated to stabilize, with Brent forecasted to average around $83 per barrel in 2024. Gold prices, on the other hand, are expected to see significant gains, potentially reaching an average of $2,175/oz by Q4 2024.
Supply-Demand Dynamics: The balance in the oil market will likely hinge on OPEC+ production decisions. Gold’s appeal as a hedge against economic uncertainty and inflation will underpin its price movements.
USD and Forex
Strength of the U.S. Dollar: The dollar’s performance will be influenced by the Fed’s rate decisions and the 2024 U.S. presidential election. It is expected to remain strong, potentially yielding more than many global currencies.
Currency Pair Forecasts: Key currency pairs like EUR/USD, GBP/USD, and USD/JPY will reflect the broader economic sentiment and geopolitical developments. The euro is expected to underperform against the dollar, with the euro/dollar pair hovering between parity and 1.05 in the first half of 2024.
Cryptocurrencies
Continued Recovery: Cryptocurrencies are likely to continue their recovery trajectory, influenced by regulatory developments and increasing mainstream adoption. However, their performance will be contingent on broader market sentiments and technological advancements in the blockchain sector.
Regulatory Impact: The regulatory landscape will be a critical factor, with potential new policies either bolstering or hindering the growth of cryptocurrencies.
Overall, the 2024 financial landscape presents a nuanced picture. While AI and technology stocks are expected to lead gains in equities, emerging markets may offer attractive opportunities later in the year. Bonds could benefit from a lower interest rate environment, and commodities like oil and gold will remain crucial in portfolios. The strength of the U.S. dollar will influence forex markets, and the trajectory of cryptocurrencies will depend on regulatory and market developments.
Concluding Thoughts
In 2023, global financial markets witnessed a robust recovery post-COVID-19, with the S&P 500 surging by 24%, a remarkable turnaround from the 19.4% drop in 2022. This upswing was largely fueled by the tech sector, particularly AI-driven companies like Nvidia, though gains beyond the top tech giants were more moderate. The Nasdaq Composite also saw a significant rebound.
Looking ahead to 2024, moderate global economic growth is expected, with the U.S. at the forefront of managing inflation and fostering growth. The European economy presents a varied picture, grappling with high energy costs and geopolitical challenges, though the UK shows promising signs.
Central banks, especially the Federal Reserve, are likely to commence rate cuts, adapting to the easing inflation and stable labor markets. The timing and scale of these cuts are, however, uncertain, given the recent rapid rate hikes.
AI is projected to remain a key growth driver in the tech sector, with real estate and financial sectors also anticipated to benefit from relaxed monetary policies. Cryptocurrencies could see increased adoption amid evolving regulations and growing acceptance.
A critical focus for 2024 is the U.S. economy’s ability to achieve a soft landing, balancing inflation control without triggering a recession.
Geopolitical tensions, notably in Ukraine and Gaza, along with the U.S. presidential election, are expected to significantly influence economic and market trends, while global supply chain shifts, technological advances, and changing consumer behaviors will also be key factors.
Here are some interesting questions to ponder for 2024:
1. How will the interplay between technological advancements and geopolitical tensions shape global investment strategies in 2024?
2. With the Federal Reserve poised to cut interest rates, what sectors or asset classes could potentially offer the best investment opportunities in a changing economic environment?
3. Considering the potential for both a soft and hard economic landing, how should investors adjust their portfolios to mitigate risks and capitalize on emerging opportunities in 2024?
Let me know your answers in the comments below.