As I was preparing for the year ahead, I came across this interesting read in the news. Goldman Sachs had just released their top trade recommendations for the year 2017 as a response to a Trump win in the recent U.S elections, amid economic and political uncertainty. These trade ideas were birthed by recent developments in the major economies of the world, and I couldn’t help but recall what Goldman said in 2015, about 2016 being a year of economic gloom. Already, the S&P 500 is hovering at 2,200, up 9.4% for the year 2016.
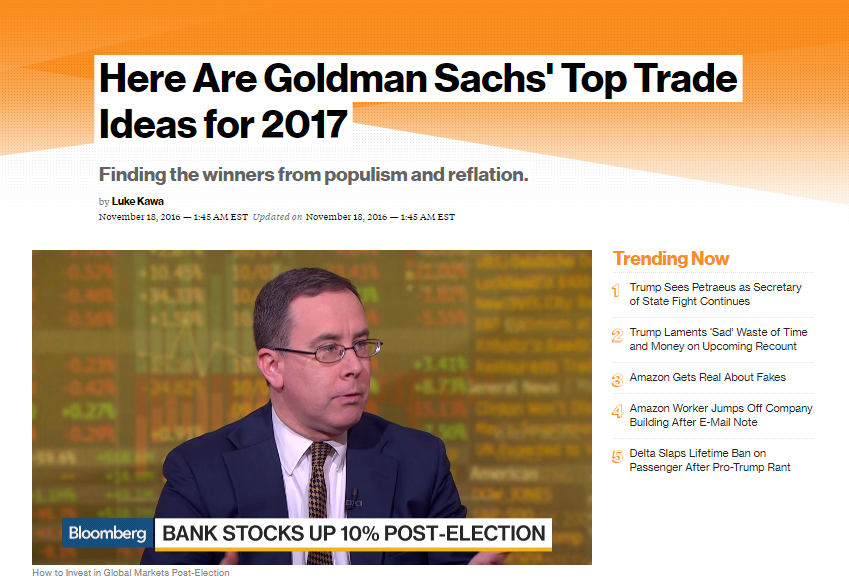 Image Source: Bloomberg
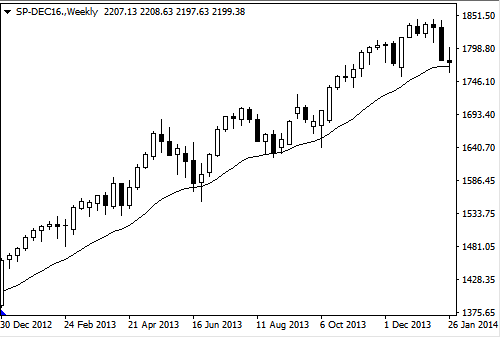
“Goldman Sachs’ top strategists predict that stocks will once again disappoint next year. Goldman predicts the S&P 500 will go nowhere in the coming year, ending 2016 at 2,100.” – Fortune.com (November 2015)
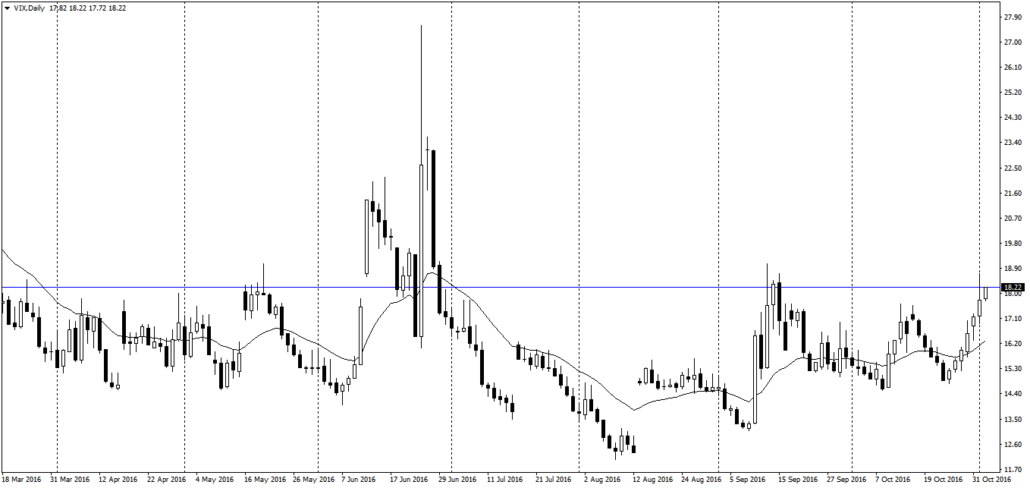
Analysts can be wrong, and to be fair, very few expected the S&P to hit all-time highs. As traders know, we don’t expect to be right all the time. There were a number of great opportunities for bears to take profits even in the uptrend market we’ve seen this year. With information from 29 Nov 2016, the S&P 500 was about 100 points above what Goldman predicted for the year, and the graphic (a weekly chart of the S&P 500 index) below gives a clearer picture of this.
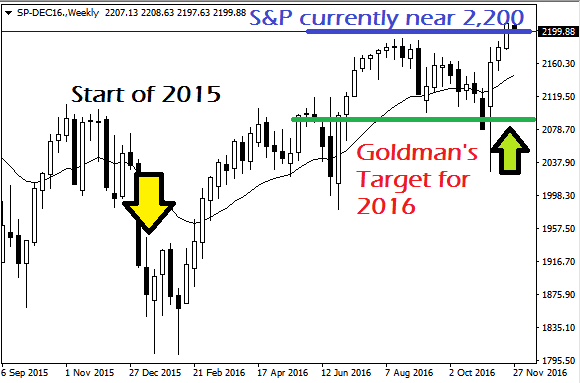 Image Source: MetaTrader 4
I often read opinions of the market not because I need them, but because as a trader it is essential that I keep up to date with what the institutions are thinking. In the latest recommendation, Goldman recommended the following: (quoting the titles directly from Bloomberg’s report)
- “U.S. Dollar the Winner From Developed Market Populism”
- “Bet on Trump Getting More Upset About China’s currency”
- “Keep Calm and Carry the Right Emerging Market Currencies”
- “Long Emerging Market Stocks with ‘Insulated Exposure to Growth’ “
- “The Reflation Trade Has Legs”
- “Long European Dividend Growth”
What in the world do these ideas mean? Just in case it sounds too confusing, I have translated them into simpler bite-sized titbits below.
 Image Source: freepik.com
HERE ARE THE SIX TRADE IDEAS:
Trade Idea #1: Short the EUR/USD pair and GBP/USD pair
 Image Source: CleanFinancial.com
Goldman expects the US Dollar to rise. As such, shorting currency pairs with ‘USD’ at the back would express this adequately. Trump’s economic policies are expected to be growth-inducing. Stuff like great quantities of fiscal stimulus, protectionism (both in terms of foreign products and foreign people, haha) to boost local growth and employment, and not to forget, rising interest rates; all these increase demand for the US Dollar.
Uncertainty in Britain (because of the details of the Brexit process) and “populism in Europe” (another Donald Trump situation in Europe?) should “weigh on the pound and the euro”. Essentially, they mean the currency of Britain and Europe should be less in demand as compared to the US Dollar.
Trade Idea #2: Go long on the USD/CNY pair
 Image Source: Globalriskinsights.com
China’s current currency regime is a fixed yuan with respect to a basket of other currencies, therefore a strong US Dollar should push the Yuan higher. Kind of the same logic as idea No.1.
Trade Idea #3: Go long on emerging market currencies, like MXN, NOK and others
Following the U.S. election, a number of the higher-yielding currencies experienced a mini-meltdown. Nothing new; they’re just recommending taking a reversal trade on oversold currencies.
 Huge run-ups in USDMXN and USDNOK show major selling in emerging market currencies.
Image Source: MetaTrader 4
Trade Idea #4: Buy emerging market equities that don’t benefit much from U.S and China’s growth
Quite a straight-forward idea; countries like Brazil and India will probably continue to grow despite America and China’s antics, and they should be seen as safer places to park money.
Trade Idea #5: Bet on rising inflation by buying 10-year U.S. TIPS
Growth in the U.S should lead to re-introduction of inflationary pressures. Along with bullish expectations for energy prices, Goldman expects 2017 to be a year of inflation.
Trade Idea #6: Bet on rising dividends by buying Euro Stoxx 50 2018 dividend futures
Yes, you can not only bet on inflation, but on dividends rising. The Eurex actually offers futures contracts for people who want to bet on dividends rising. I’ve heard of other strange futures contracts like cheese, freight, gold volatility index futures, crack spread futures, but this is interesting.
In 2011, Goldman Sachs expressed their prediction for 2012 as “Overall, though, a volatile market, with little overall change, what we describe as ‘fat and flat,’ would be our central view for the year as a whole, but with things getting worse before they get better…”
In 2012, Goldman Sachs predicted the end of the gold bull market and an improved economy (as well as a bullish stock market), and accurately so. Well done for them. (check out the bullish move in 2013 in the chart below)
 And so Goldman Sachs predicted the bull market of 2013.
Image Source: MetaTrader 4
From an outsider’s point of view, it seems that Goldman could just be very, very good at predicting things. However, a quick google search will reveal that they are also incorrect in their calls at times, and this should humble any aspiring trader.
In my opinion, the end of the gold market of 2013 was a result of simple price action analysis. Statistically speaking, or using probabilistic reasoning, a sideways market was a reasonable prediction.
In the image below of the gold weekly chart, we can clearly see the multiple trend line breaks that 2012 was characterized by, and the subsequent sideways-bearish move in 2013. We are still in a sideways market on a multi-year basis.
 Gold experienced a bearish move after multiple trendline breaks in 2012.
Chart Source: MetaTrader 4
With all this in mind, what then should we be looking out for in 2017? Although trading themes are being churned out by analysts year after year, using simple price action strategies, the average investor can identify a few potential trade strategies to take for the upcoming year.
THREE SIMPLE IDEAS OF MY OWN:
1. U.S. STOCKS – CONTINUE BUYING ON DIPS
As most traders know, when the market is trending strongly, ride the trend until it proves itself otherwise. This simple strategy is what I applied on the USDJPY right after the recent U.S election results. In the chart below, we see 12 distinct buying opportunities spread out over 14 days. By simply riding on a strong uptrend, it is actually not too hard to watch your profits snowball – provided you have the patience to hold your trades.
 12 buying opportunities spotted on the USDJPY 1-hour chart
Chart Source: MetaTrader 4
On the S&P500, a strong trending bull market means buying on any dips is a profitable strategy. It doesn’t take a lot of analysis to realize that this is a high probability trade. Of course, as with any other trade, stop losses will take me out of the market immediately if the trend quickly reverses.
“What about a Santa Claus Rally?”
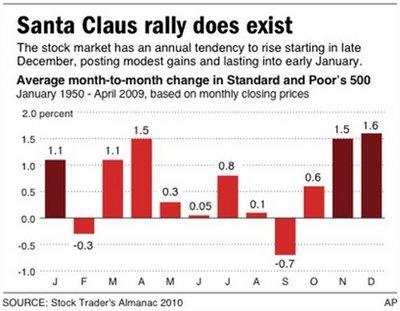 Chart Source: Stock Trader’s Almanac 2010
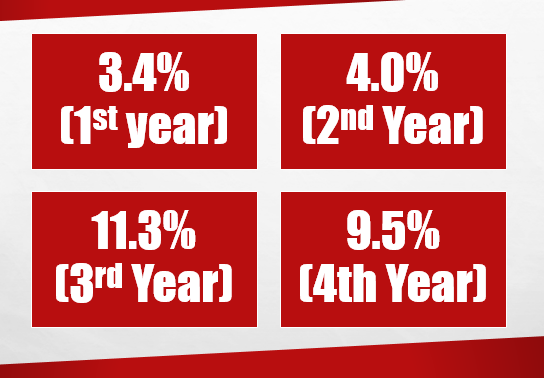
The statistics for Nov to Feb rallies in past years is pretty positive. Starting from 1950 to 2009, the average November-January rally brings in 4.2% returns. It seems buying on any dip from now till about February next year would be a statistically sound trade.
2. FADING OVERLY DEVALUED CURRENCIES
For those who aren’t aware, fading simply means taking the trade in the opposite direction of the trend. This seems like a contradiction to my previous trade idea, but it isn’t; in the context of clearly trending markets, going with the trend is the reasonable thing to do, and the trend sometimes lasts for much longer than one would expect. However, when the move is very, very quick, huge, and climactic, it has to end quickly as well.
In order to see the speed of the collapse, you can obtain intra-day charts of the USDCHF on that fateful day.
 The famous Swiss Franc crash and rebound of 2015.
Chart Source: MetaTrader 4
Returning to the devalued emerging market currencies, it is reasonable to assume that huge moves will come to an end, and a reversal trade (with a clear signal!) would make for a profitable bet.
3. PRUDENT ENTRIES IN OIL AND GOLD (WAIT!)
On the commodities front, the markets seem more sideways than trending. In such a case, it is prudent to look to trade near the extremes for a reasonable risk-reward ratio. Here’s the crude oil daily chart, and I’ve drawn two simple lines to aid in visual analysis:
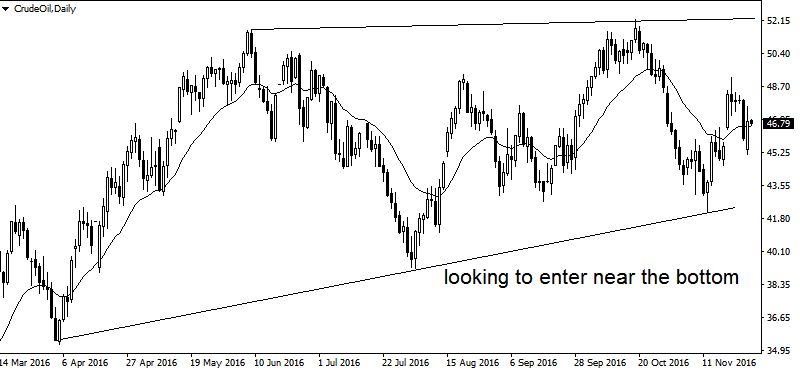 In the case of crude oil, buying near the channel line makes sense.
Chart Source: MetaTrader 4
It’s hard to say where the crude oil could go. Although Goldman predicts it would pick up modestly, I’d rather wait for a strong bullish setup before making an entry. It’s perfectly fine if you are not comfortable entering the market; wait for clarity. It always comes.
For Gold, I had to zoom out a lot more on the charts to make sense of what was happening. Sure, it’s seen a huge dip recently (as a result of the U.S election), but I’ll wait for more confirmation before deciding what to do.
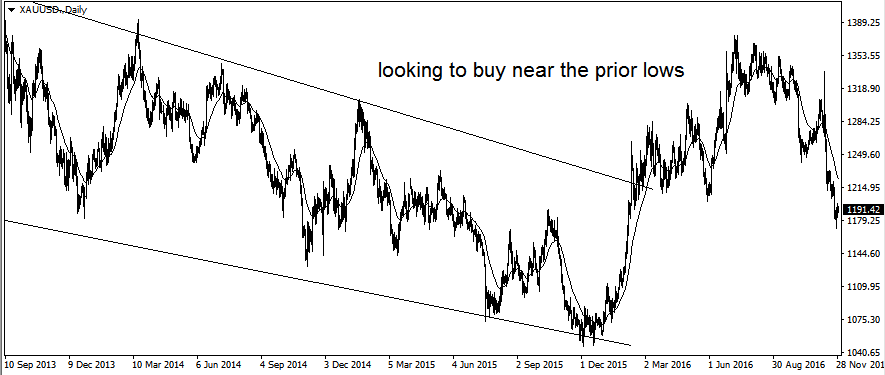 Gold price chart from Sep 2013 to Nov 2016
Chart Source: MetaTrader 4
By the time the news reports a huge move in commodities, it’s too late. It’s much more logical to look at the charts yourself, and decide on an entry before the move happens; that’s the only way you can profit from the market.
WHAT ABOUT THE SINGAPORE STOCK MARKET?
The STI has been sideways for a couple of months now. This makes for very difficult trading, as the market changes direction many times within the month. I recommend staying clear of trading it until a clear trend develops.
 Chart Source: Tradingeconomics.com
For dollar-cost-averaging investors, this year would have been a very frustrating one indeed.
Using a simple excel sheet, I calculated what returns the investor would obtain if he had bought in any of the first six months this year, and held it to the current price (in November): (all prices used are closing prices for each month)
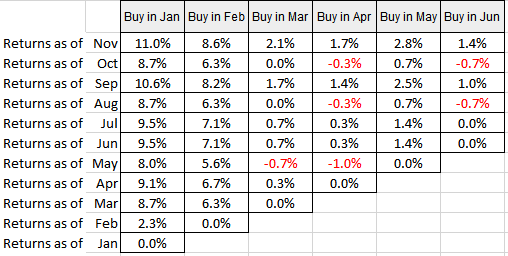 Buyers of the Straits Times Index from March 2016 onwards would have seen measly returns.
Source: Yahoo finance (calculations done by author)
If you had bought the STI at the end of January, good for you; you would be up 11% on your investment. If you had bought at end February, you would be up 8.6% on your investment. However, the market situation isn’t good news for those who bought in the subsequent months, as shown in the diagram above. For those of you who need candlestick charts, here you go:
 The STI has been in a tight sideways market since July 2016; others may say it started in April 2016.
Chart Source: ChartNexus
WHERE DO WE GO FROM HERE?
I’ve shown that the Singapore market has been a tough one to trade in recent months, while opportunities were plentiful in the forex markets. Also, commodities have not asserted themselves in either direction yet, and the effect of a Trump presidency is still weighing heavily investors’ minds.
With that said, as I’ve always asserted, trading decisions are made using simple price action principles and must make logical sense. Goldman Sachs could be correct or wrong, and I could be right or wrong; what matters in the end is that the winning trades make more than the losing trades.
As Soros famously quips:
“It’s not whether you’re right or wrong that’s important, but how much money you make when you’re right and how much you lose when you’re wrong.” – George Soros
RESEARCH SOURCES & REFERENCES
https://www.bloomberg.com/news/articles/2016-11-18/here-are-goldman-sachs-top-trade-ideas-for-2017
http://www.zerohedge.com/news/2016-11-17/goldman-reveals-its-top-trade-recommendations-2017
fortune.com/2015/11/25/goldman-sachs-stock-market-predictions-2016/
http://www.cleanfinancial.com/financial_images/trading/eur_usd_spread_betting_250x250.png
https://www.theguardian.com/business/2011/dec/22/goldman-sachs-forecast-for-2012
http://www.businessinsider.com/goldmans-2013-forecast-2012-12?IR=T&r=US&IR=T
http://www.investopedia.com/news/goldman-sachs-how-trade-first-year-trump-gs/
Spencer is an avid globetrotter who achieved financial freedom in his 20s, while trading & teaching across 70+ countries. As a former professional trader in private equity and proprietary funds, he has over 15 years of market experience, and has been featured on more than 20 occasions in the media.


 Source: Kappit.com