Thumbnail Morning Star Candlestick Pattern Trading Strategy Guide

Thumbnail Morning Star Candlestick Pattern Trading Strategy Guide


The morning star candlestick pattern is a bullish reversal pattern that appears after a downtrend in a financial security’s price.

It is characterized by a small real body, which suggests that there was little trading activity during the period, and a long lower shadow, which indicates that sellers tried to push the price lower but failed.

The pattern gets its name from the fact that it looks like a star rising in the morning sky.

The psychology behind the morning star pattern is that it shows a shift in sentiment from bearish to bullish.

During a downtrend, sellers are in control and are pushing the price lower.

However, when the morning star pattern appears, it indicates that the sellers are losing strength and that buyers are starting to take control.

This shift in sentiment can be caused by a variety of factors, such as a change in market conditions, the release of positive news, or the appearance of bullish technical indicators.

To use the morning star pattern for trading, it is important to confirm that it is indeed a valid pattern.

This means looking for the following characteristics:

  1. The morning star must appear after a downtrend.
  2. The lower shadow must be at least twice as long as the real body.
  3. The real body should be at the upper end of the trading range.

If these criteria are met, then the morning star pattern is considered valid and can be used as a signal to buy the security.

There are several trading strategies that can be used with the morning star pattern.

One strategy is to buy the security when the pattern appears and place a stop loss order just below the low of the morning star.

This will protect against any potential downside movement in the security’s price.

Another strategy is to wait for another bullish candlestick pattern to confirm the reversal, such as a bullish engulfing pattern or a piercing line.

When it comes to placing a take profit order, traders can use a variety of techniques.

One approach is to use a fixed take profit level, such as a specific price level or a percentage of the entry price.

Another approach is to use a trailing stop loss order, which allows the trader to lock in profits as the security’s price moves in the desired direction.

There are also some limitations to the morning star pattern that traders should be aware of.

One limitation is that the pattern is not always reliable, as there are times when the security’s price may continue to fall despite the appearance of a morning star.

Another limitation is that the pattern can be prone to false signals, especially in choppy or sideways markets.

To increase the reliability of the morning star pattern, traders can combine it with other technical analysis techniques and indicators.

For example, traders can look for the pattern to appear in conjunction with bullish divergence on a technical indicator such as the relative strength index (RSI).

They can also look for the pattern to appear at key support levels, such as a previous low or a trendline.

In conclusion, the morning star candlestick pattern is a bullish reversal pattern that can be used to trade the financial markets.

To use the pattern effectively, traders should confirm its validity and use appropriate stop loss and take profit orders.

However, traders should also be aware of the limitations of the pattern and consider combining it with other technical analysis techniques and indicators to increase its reliability.


ed seykota

If you would like to learn more about all the different candlestick patterns, also check out: “The Definitive Guide to Candlestick Patterns”

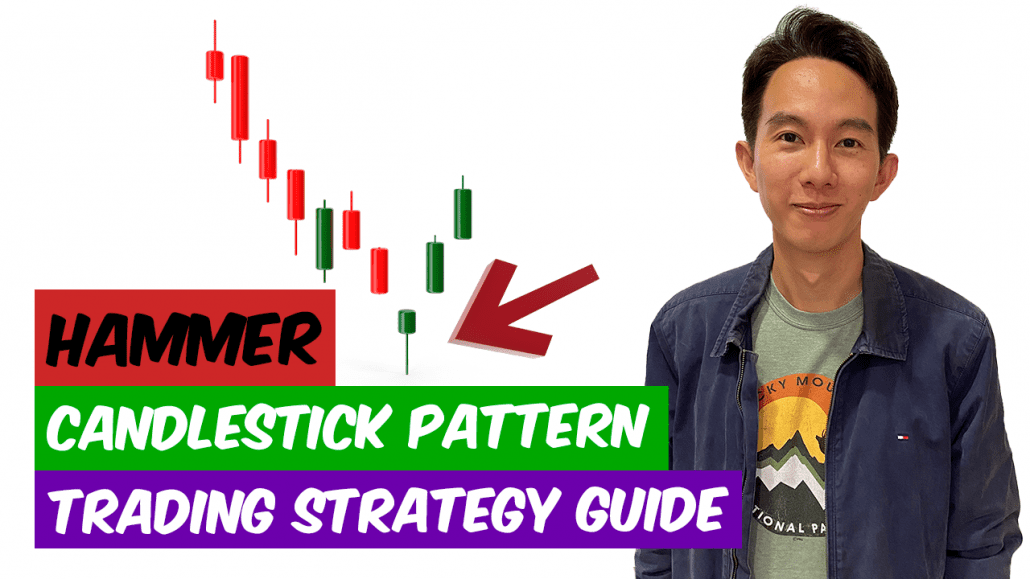
Thumbnail Hammer Candlestick Pattern Trading Strategy Guide

Thumbnail Hammer Candlestick Pattern Trading Strategy Guide


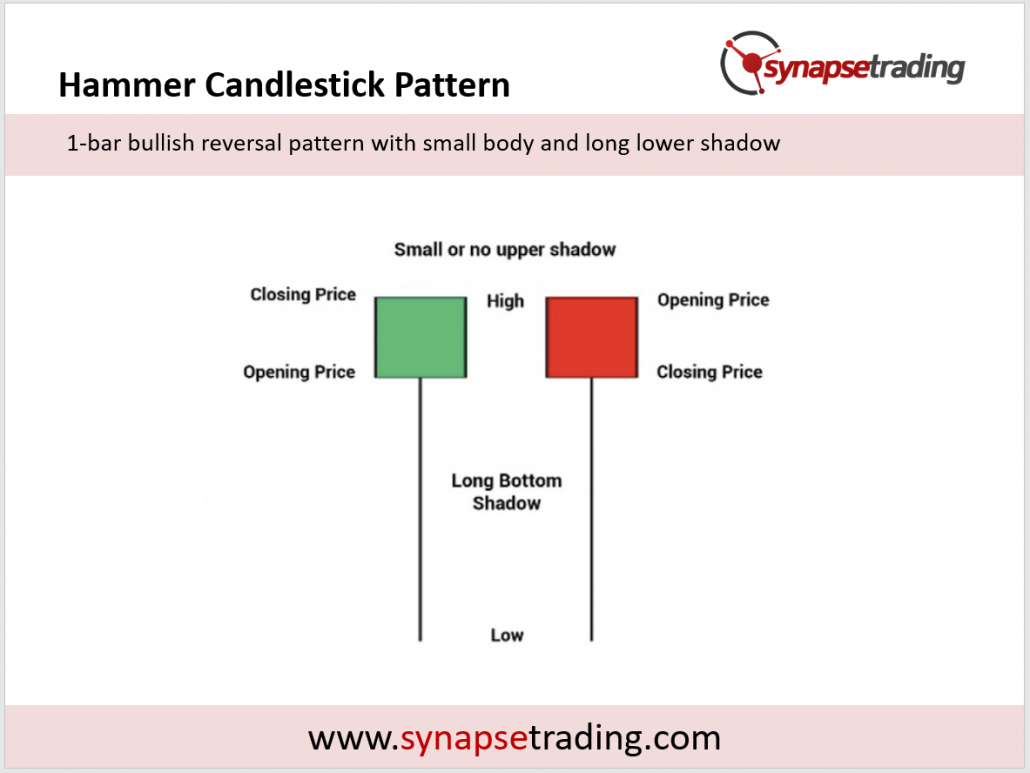
The hammer candlestick pattern is a bullish reversal pattern that consists of a single candlestick with a small body and a long lower shadow.

It is called a “hammer” because it looks like a hammer with the handle being the small body and the head being the long lower shadow.

The pattern is typically seen as a sign of bullish sentiment and indicates that the trend may be about to reverse from a downtrend to an uptrend.


hammer candlestick pattern summary


In order to understand the psychology behind the hammer pattern, it’s important to understand the context in which it typically occurs.

The pattern usually forms after a significant price decline and indicates that the bulls (buyers) are starting to regain control of the market.

As the price falls, the bears (sellers) become more and more confident that the downtrend will continue. However, at some point, the bulls start to step in and start buying, pushing the price back up towards the opening price.

This causes the long lower shadow to form, as the price is pushed back up towards the opening price but ultimately closes lower than where it opened.

The long lower shadow of the hammer pattern indicates that the bulls were able to push the price back up towards the opening price, and this can be seen as a sign of strength.

It suggests that the bears may be losing control and that the trend may be about to reverse.

The most common way to use the hammer pattern in trading is to wait for the pattern to form and then enter a long position (buy) when the price breaks above the high of the hammer candlestick.

This is known as a “breakout” strategy and involves placing a stop loss order just below the low of the hammer candlestick.

The idea is to let the trade run until the price reaches a level where it is no longer considered favorable, at which point the stop loss order will be triggered and the trade will be closed.

In terms of where to place the stop loss and take profit orders, it’s important to consider the overall trend and the specific market conditions.

In a strong uptrend, it may be appropriate to place the stop loss order closer to the entry point, as the likelihood of a trend reversal is relatively low.

On the other hand, in a weaker or more uncertain market, it may be appropriate to place the stop loss order farther away from the entry point to allow for more room for the trade to develop.

As for the take profit order, it’s important to consider the potential reward relative to the risk.

In general, it’s a good idea to aim for a reward that is at least twice the size of the risk, as this allows for a higher probability of success.

It’s important to note that the hammer candlestick pattern is just one of many tools that traders can use to make informed decisions about the market.

While it can be a useful indicator of potential trend reversals, it should not be used in isolation and should be considered in conjunction with other technical and fundamental analysis tools.

One way to combine the hammer pattern with other technical analysis techniques is to use it in conjunction with trendline analysis.

For example, if the hammer pattern forms after a significant price decline and the price subsequently breaks above a downward-sloping trendline, it may be a strong indication of a trend reversal.

Similarly, if the hammer pattern forms after a significant price decline and the price subsequently breaks above a key resistance level, it may also be a strong indication of a trend reversal.

Another way to combine the hammer pattern with other technical analysis techniques is to use it in conjunction with oscillators such as the relative strength index (RSI) or the moving average convergence divergence (MACD).

For example, if the hammer pattern forms after a significant price decline and the RSI or MACD is showing an oversold condition, it may be a strong indication of a trend reversal.

It’s also important to consider the overall market environment when using the hammer pattern.

For example, if the pattern forms during a period of high volatility, it may be a less reliable indicator of a trend reversal compared to if it forms during a period of low volatility.

One of the limitations of the hammer pattern is that it can be prone to false signals.

For example, if the pattern forms after a relatively small price decline, it may not be a strong enough indication of bullish sentiment to warrant a trade.

In addition, if the pattern forms in the midst of a strong downtrend, it may not be a reliable indicator of a trend reversal.

Another limitation of the hammer pattern is that it does not provide any information about the duration or strength of the potential trend reversal.

While it may indicate that the trend is about to reverse, it does not provide any insight into how long the reversal may last or how strong it may be.

In summary, the hammer candlestick pattern is a useful tool for traders looking to identify potential trend reversals.

It should be used in conjunction with other technical and fundamental analysis tools and with a clear understanding of the limitations of the pattern.

By carefully considering the overall trend, market conditions, and the potential reward relative to the risk, traders can use the hammer pattern to make informed decisions about their trades.


ed seykota

If you would like to learn more about all the different candlestick patterns, also check out: “The Definitive Guide to Candlestick Patterns”


Thumbnail Shooting Star Candlestick Pattern Trading Strategy Guide

Thumbnail Shooting Star Candlestick Pattern Trading Strategy Guide

The shooting star candlestick pattern is a bearish reversal pattern that appears after an uptrend in a financial security’s price.

It is characterized by a long upper shadow, which indicates that buyers tried to push the price higher but failed, and a small real body, which suggests that there was little trading activity during the period.

The pattern gets its name from the fact that it looks like a shooting star falling from the sky.

The psychology behind the shooting star pattern is that it shows a shift in sentiment from bullish to bearish.

During an uptrend, buyers are in control and are pushing the price higher.

However, when the shooting star pattern appears, it indicates that the buyers are losing strength and that sellers are starting to take control.

This shift in sentiment can be caused by a variety of factors, such as a change in market conditions, the release of negative news, or the appearance of bearish technical indicators.

To use the shooting star pattern for trading, it is important to confirm that it is indeed a valid pattern.

This means looking for the following characteristics:

  1. The shooting star must appear after an uptrend.
  2. The upper shadow must be at least twice as long as the real body.
  3. The real body should be at the lower end of the trading range.

If these criteria are met, then the shooting star pattern is considered valid and can be used as a signal to sell or short the security.

There are several trading strategies that can be used with the shooting star pattern.

One strategy is to sell or short the security when the pattern appears and place a stop loss order just above the high of the shooting star.

This will protect against any potential upside movement in the security’s price.

Another strategy is to wait for another bearish candlestick pattern to confirm the reversal, such as a bearish engulfing pattern or a dark cloud cover.

When it comes to placing a take profit order, traders can use a variety of techniques.

One approach is to use a fixed take profit level, such as a specific price level or a percentage of the entry price.

Another approach is to use a trailing stop loss order, which allows the trader to lock in profits as the security’s price moves in the desired direction.

One of the main advantages of the shooting star candlestick pattern is that it provides traders with a clear visual representation of market sentiment and the potential for a reversal.

By identifying the pattern and its characteristics, traders can make informed decisions about whether to enter or exit a trade.

There are also some limitations to the shooting star pattern that traders should be aware of.

One limitation is that the pattern is not always reliable, as there are times when the security’s price may continue to rise despite the appearance of a shooting star.

Another limitation is that the pattern can be prone to false signals, especially in choppy or sideways markets.

Another potential drawback is that the shooting star pattern can be subjective and open to interpretation.

For example, there is no set standard for how long the upper shadow should be compared to the real body, and different traders may have different criteria for what constitutes a valid shooting star pattern.

This subjectivity can make it difficult to consistently identify and trade the pattern effectively.

To increase the reliability of the shooting star pattern, traders can combine it with other technical analysis techniques and indicators.

For example, traders can look for the pattern to appear in conjunction with bearish divergence on a technical indicator such as the relative strength index (RSI).

They can also look for the pattern to appear at key resistance levels, such as a previous high or a trendline.

Additionally, traders can use risk management techniques such as stop loss orders to limit potential losses in the event that the pattern does not accurately reflect market sentiment.

In conclusion, the shooting star candlestick pattern is a bearish reversal pattern that can be used to trade the financial markets.

To use the pattern effectively, traders should confirm its validity and use appropriate stop loss and take profit orders.

However, traders should also be aware of the limitations of the pattern and consider combining it with other technical analysis techniques and indicators to increase its reliability.


ed seykota

If you would like to learn more about all the different candlestick patterns, also check out: “The Definitive Guide to Candlestick Patterns”

Thumbnail Full List of Japanese Candlestick Patterns Cheat Sheet

Thumbnail Full List of Japanese Candlestick Patterns Cheat Sheet

There are many different candlestick patterns that can be used in technical analysis to interpret price data and make trading decisions.


Bullish vs. Bearish Candlestick Patterns

Bullish and bearish candlestick patterns are used in technical analysis to interpret price data and make trading decisions.

Bullish patterns suggest a potential uptrend and are generally seen as positive signals, while bearish patterns suggest a potential downtrend and are generally seen as negative signals.

Here is a list of some common candlestick patterns:

Bullish Candlestick Patterns:

  • Hammer pattern: a small body and a long lower shadow, considered to be a bullish reversal pattern
  • Hanging man: similar to the hammer pattern, but typically found at the top of an uptrend and considered to be a bearish reversal pattern
  • Bullish engulfing pattern: a large white candlestick that completely engulfs the preceding small black candlestick, considered to be a strong bullish reversal pattern
  • Morning star: a small black candlestick followed by a large white candlestick and a small black candlestick, considered to be a bullish reversal pattern
  • Three white soldiers: three long white candlesticks in a row, considered to be a strong bullish reversal pattern
  • Bullish harami: a small white candlestick inside the range of a large black candlestick, considered to be a bullish reversal pattern
  • Morning doji star: a small black candlestick followed by a doji pattern and a large white candlestick, considered to be a bullish reversal pattern
  • Bullish abandoned baby: a doji pattern with a gap above the doji, considered to be a bullish reversal pattern
  • Bullish meeting lines: two white candlesticks with the same open and close, considered to be a bullish reversal pattern
  • Bullish tasuki gap: a white candlestick with a gap below it, followed by a black candlestick with a gap above it, considered to be a bullish reversal pattern
  • Bullish three line strike: three white candlesticks with consecutively higher closes, considered to be a strong bullish reversal pattern
  • Bullish three inside up: a large black candlestick followed by a small white candlestick that is contained within the range of the black candlestick, considered to be a bullish reversal pattern
  • Bullish three outside up: a small black candlestick followed by a large white candlestick with a higher close, considered to be a bullish reversal pattern
  • Bullish three stars in the south: three small black candlesticks with consecutively lower closes, considered to be a bullish reversal pattern
  • Tweezer bottom: two or more candlesticks with equal lows, typically seen as a bullish pattern

Bearish Candlestick Patterns:

  • Shooting star: a small body and a long upper shadow, considered to be a bearish reversal pattern
  • Inverted hammer: similar to the shooting star pattern, but typically found at the bottom of a downtrend and considered to be a bullish reversal pattern
  • Bearish engulfing pattern: a large black candlestick that completely engulfs the preceding small white candlestick, considered to be a strong bearish reversal pattern
  • Evening star: a large white candlestick followed by a small black candlestick and a large white candlestick, considered to be a bearish reversal pattern
  • Three black crows: three long black candlesticks in a row, considered to be a strong bearish reversal pattern
  • Bearish harami: a small black candlestick inside the range of a large white candlestick, considered to be a bearish reversal pattern
  • Evening doji star: a large white candlestick followed by a doji pattern and a small black candlestick, considered to be a bearish reversal pattern
  • Bearish abandoned baby: a doji pattern with a gap below the doji, considered to be a bearish reversal pattern
  • Bearish meeting lines: two black candlesticks with the same open and close, considered to be a bearish reversal pattern
  • Bearish tasuki gap: a black candlestick with a gap above it, followed by a white candlestick with a gap below it, considered to be a bearish reversal pattern
  • Bearish three line strike: three black candlesticks with consecutively lower closes, considered to be a strong bearish reversal pattern
  • Bearish three inside down: a large white candlestick followed by a small black candlestick that is contained within the range of the white candlestick, considered to be a bearish reversal pattern
  • Bearish three outside down: a small white candlestick followed by a large black candlestick with a lower close, considered to be a bearish reversal pattern
  • Bearish three stars in the north: three small white candlesticks with consecutively higher closes, considered to be a bearish reversal pattern
  • Tweezer top: consists of two or more candlesticks with equal highs, typically seen as a bearish pattern

Neutral Candlestick Patterns:

  • Doji: a small body with long upper and lower shadows, considered to be a neutral pattern indicating indecision or a lack of direction in the market
  • Spinning top: similar to the doji pattern, but with a slightly larger body, considered to be a neutral pattern
  • Gravestone doji: a doji pattern with a long upper shadow, considered to have more bearish bias
  • Dragonfly doji: a doji pattern with a long lower shadow, considered to have more bullish bias
  • Tri-star doji: composed of three doji patterns in a row, considered to have more bearish bias.
  • Four price doji: a doji pattern with open, high, low, and close all at the same price, considered to be a neutral pattern

It is important to remember that there are many different candlestick patterns that can be used in technical analysis, and the list of patterns could potentially go on indefinitely.

However, it is important to keep in mind that candlestick patterns should be used in conjunction with other technical indicators and chart patterns, and should not be relied upon as the sole basis for trading decisions.

It is also important to understand the limitations of candlestick patterns and to be aware of the potential for subjectivity and interpretation in the analysis of these patterns.


ed seykota

If you would like to learn more about all the different candlestick patterns, also check out: “The Definitive Guide to Candlestick Patterns”

Thumbnail What are Candlestick Patterns and How to Use them to Trade

Thumbnail What are Candlestick Patterns and How to Use them to Trade

Candlestick patterns are a type of chart pattern used in technical analysis to interpret price data and make trading decisions. These patterns are named after the shape of the candlestick chart that they form and can provide valuable insights into the sentiment and psychology of market participants.

The origin of candlestick patterns can be traced back to 18th century Japan, where they were developed by rice traders to analyze price movements in the rice market. The patterns were later introduced to the Western world by Steve Nison, who popularized them in his book “Japanese Candlestick Charting Techniques.”

There are several different types of candlestick patterns, including bullish patterns, bearish patterns, and neutral patterns. Bullish patterns indicate a potential uptrend and are generally considered to be positive signals, while bearish patterns indicate a potential downtrend and are generally considered to be negative signals. Neutral patterns, on the other hand, do not have a clear bullish or bearish bias and may indicate indecision or a lack of direction in the market.

Some common bullish candlestick patterns include the hammer, the hanging man, and the bullish engulfing pattern. The hammer pattern is characterized by a small body and a long lower shadow, and is considered to be a bullish reversal pattern. The hanging man pattern is similar to the hammer pattern, but is typically found at the top of an uptrend and is considered to be a bearish reversal pattern. The bullish engulfing pattern is characterized by a large white candlestick that completely engulfs the preceding small black candlestick, and is considered to be a strong bullish reversal pattern.

Some common bearish candlestick patterns include the shooting star, the inverted hammer, and the bearish engulfing pattern. The shooting star pattern is characterized by a small body and a long upper shadow, and is considered to be a bearish reversal pattern. The inverted hammer pattern is similar to the shooting star pattern, but is typically found at the bottom of a downtrend and is considered to be a bullish reversal pattern. The bearish engulfing pattern is similar to the bullish engulfing pattern, but is characterized by a large black candlestick that completely engulfs the preceding small white candlestick, and is considered to be a strong bearish reversal pattern.

There are also several neutral candlestick patterns, including the doji and the spinning top. The doji pattern is characterized by a small body and long upper and lower shadows, and is considered to be a neutral pattern that may indicate indecision or a lack of direction in the market. The spinning top pattern is similar to the doji pattern, but has a slightly larger body, and is also considered to be a neutral pattern.

There are both pros and cons to using candlestick patterns in trading. One of the main advantages of using candlestick patterns is that they can provide valuable insights into market sentiment and psychology, which can help traders to identify potential trend reversals or continuation patterns. Candlestick patterns are also relatively easy to interpret, even for traders who are new to technical analysis.

However, there are also some limitations to using candlestick patterns in trading. One of the main drawbacks is that candlestick patterns are based on past price data and do not necessarily provide a reliable prediction of future price movements. In addition, candlestick patterns can be subject to interpretation and may not always produce reliable signals.

To use candlestick patterns effectively in trading, it is important to consider them in the context of other technical indicators and chart patterns, such as trend lines, support and resistance levels, and moving averages. It is also important to understand the limitations of candlestick patterns and to be cautious when relying on them as the sole basis for trading decisions.

When using candlestick patterns to trade, it is important to consider the overall trend of the market and to look for patterns that confirm the trend or indicate a potential reversal. For example, if the market is in an uptrend, traders may look for bullish patterns such as the hammer or the bullish engulfing pattern as potential buy signals. If the market is in a downtrend, traders may look for bearish patterns such as the shooting star or the bearish engulfing pattern as potential sell signals.

It is also important to consider the context of the pattern and the overall strength of the signal. For example, a hammer pattern that appears after a long downtrend may be a stronger reversal signal than a hammer pattern that appears in the middle of an uptrend. Similarly, a bearish engulfing pattern that appears after a long uptrend may be a stronger reversal signal than a bearish engulfing pattern that appears in the middle of a downtrend.

In addition to considering the trend and the strength of the signal, traders may also want to consider the volume of trading activity and the overall liquidity of the market. Candlestick patterns may be more reliable in markets with high liquidity and strong trading volume, as they are more likely to reflect the sentiment and psychology of a large number of market participants.

Overall, candlestick patterns can be a valuable tool for traders looking to interpret price data and make informed trading decisions. By understanding the different types of patterns, the context in which they appear, and the limitations of the signals they provide, traders can use candlestick patterns to gain a deeper understanding of market sentiment and psychology and to make more informed trading decisions.


ed seykota

If you would like to learn more about all the different candlestick patterns, also check out: “The Definitive Guide to Candlestick Patterns”