Table of Contents
What is the Separating Lines Pattern?
Definition
The Separating Lines candlestick pattern is a continuation pattern that forms when a bullish candle pattern is followed by a bearish candle pattern that opens at the start of the previous bar in a downtrend, or when a bullish bar follows a bearish candle that opens below the open of the previous candle in an uptrend.
This is a two-candle continuation pattern that can either be bullish or bearish, depending on the previous trend direction.
Bullish Separating Lines
A bullish separating lines pattern is a two-candle bullish continuation candlestick pattern that appears in the middle of a bullish trend.
It indicates that the current bullish trend is about to continue after a temporary pullback.
The most common interpretation is that a bullish separating line shows that the current bullish trend will continue after a small pullback.
The pattern is made up of two candles, with the first being bearish and the second bullish.
Characteristics
– The first candle is bearish.
– The second candle gaps above the body of the previous candle or opens right at its open.
– The second candle closes higher than it opened.
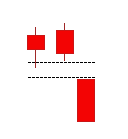
Bearish Separating Lines
The bearish separating line is a bearish continuation pattern.
The first line is a white candle that forms as a long line in a downtrend.
The second line is a black candle that forms as a long line.
Both bars will open at the same price, and then the prices start separating.
Characteristics
– The first candle is positive and forms in a negative trend.
– The second candle is negative and opens below the open of the previous candle.
How to Identify the Separating Lines Pattern?
Criteria
– A day occurs when there’s an uptrend, and it is the opposite color of the current trend.
– The second day begins at the open of the previous day.
– The second day should open on its low for the day and then go higher.
Pattern Psychology
During the uptrend, a black or red body forms.
This leads to some concern for the bulls, but the next day the prices gap back up to the open of the previous day.
When this happens, the bulls regain confidence, and the trend continues.
Candlestick signals detect where money is flowing in and out of stocks.
Understanding the trader psychology behind candlestick signals offers a great advantage, allowing traders to participate in investments with a high probability of success.
What Does the Separating Lines Tell Traders?
Bullish Separating Lines
After an established uptrend, where the bulls dominate the market, the bears take control temporarily.
The price goes down during the bears’ control, but their time in power is short.
On the second day, the price rises sharply, opening at the same level the previous day opened.
The uptrend is expected to continue as the bulls regain control.
The pattern shows the strength of the trend, indicating that even after a setback, the bulls will come back with full force.
Bearish Separating Lines
In a downtrend, the bears are in control until the bulls temporarily take over.
However, the bears quickly regain control on the second day, and the price drops again.
The downtrend is expected to continue, showing that the bears remain strong and the trend is unlikely to reverse.
How to Trade When You See the Separating Lines Pattern?
Considerations
While candlestick patterns are valuable, they are not enough on their own to make a trade.
It’s crucial to incorporate other types of technical analysis to support predictions.
Some key factors to consider in your trading plan include:
– Volatility: Some patterns work better with high or low volatility.
– Momentum: The momentum of a market impacts the performance of many strategies.
– Seasonality: Analyze the time of day, part of the month, or day of the week to identify bullish or bearish tendencies.
Concluding Thoughts
The Separating Lines pattern, whether bullish or bearish, provides valuable insights into the continuation of current market trends.
While it offers strong signals, it is important to confirm this pattern with other technical indicators and to ensure it fits within the broader market context.
A well-rounded trading strategy should consider factors such as volatility, momentum, and seasonality to improve the accuracy and success of trades based on the Separating Lines pattern.