Table of Contents
What Is Rickshaw Man?
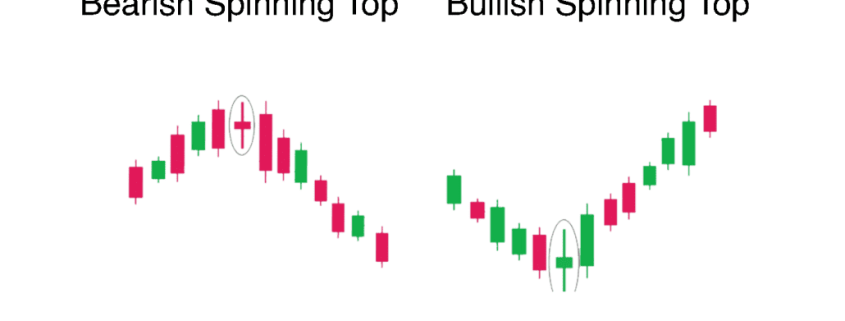
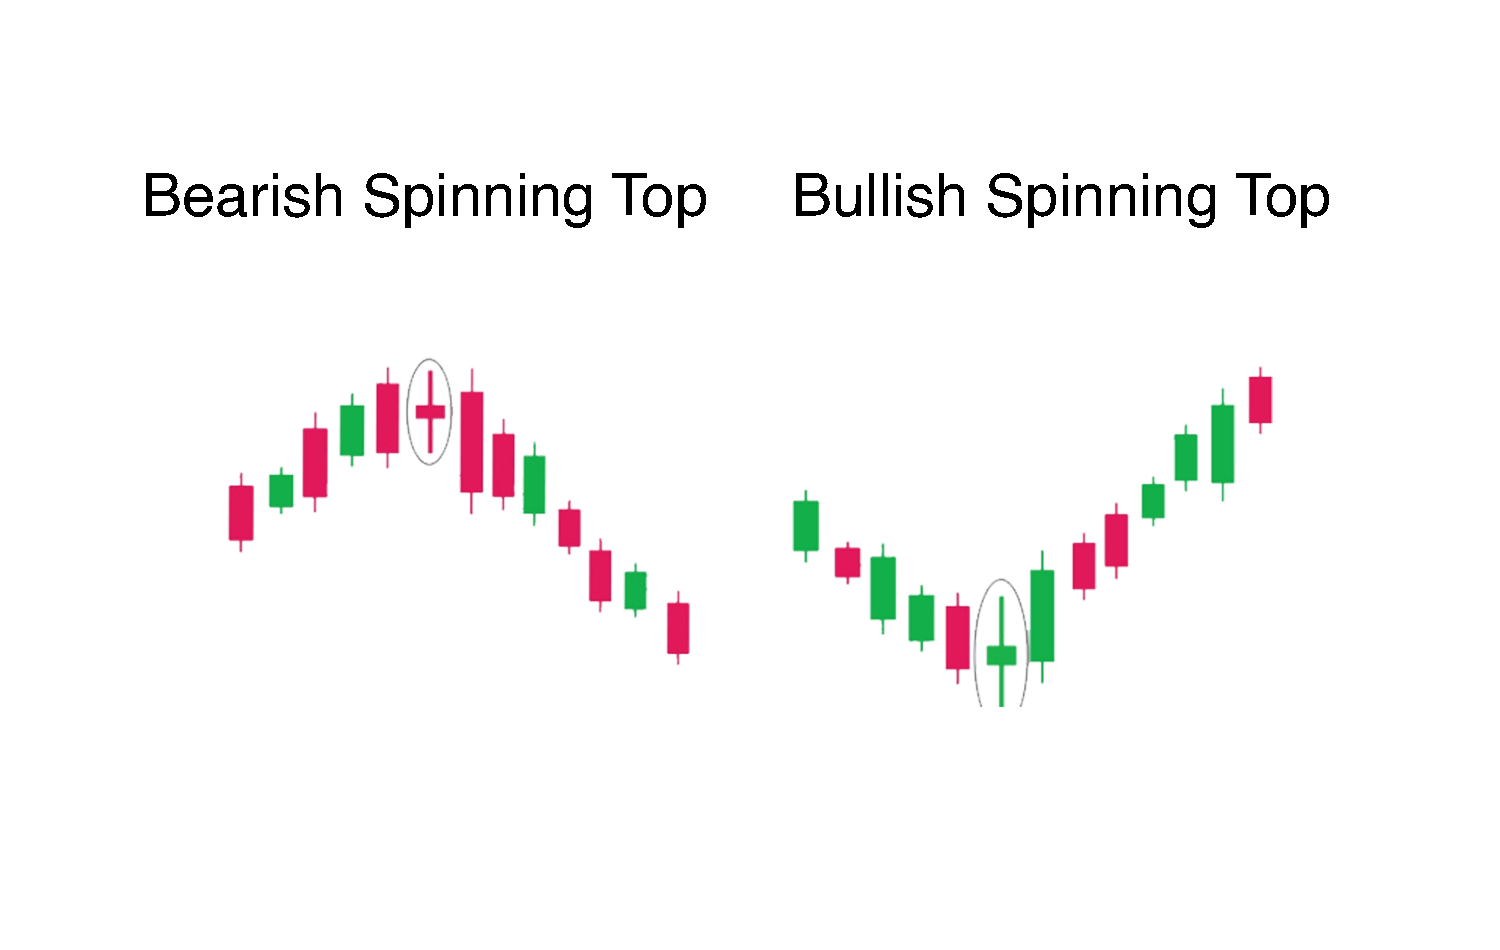
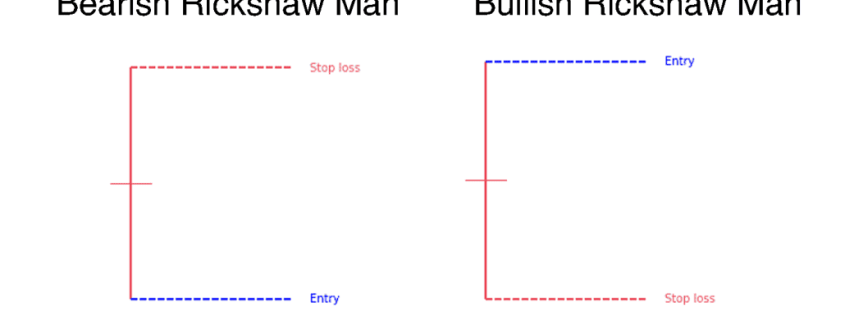
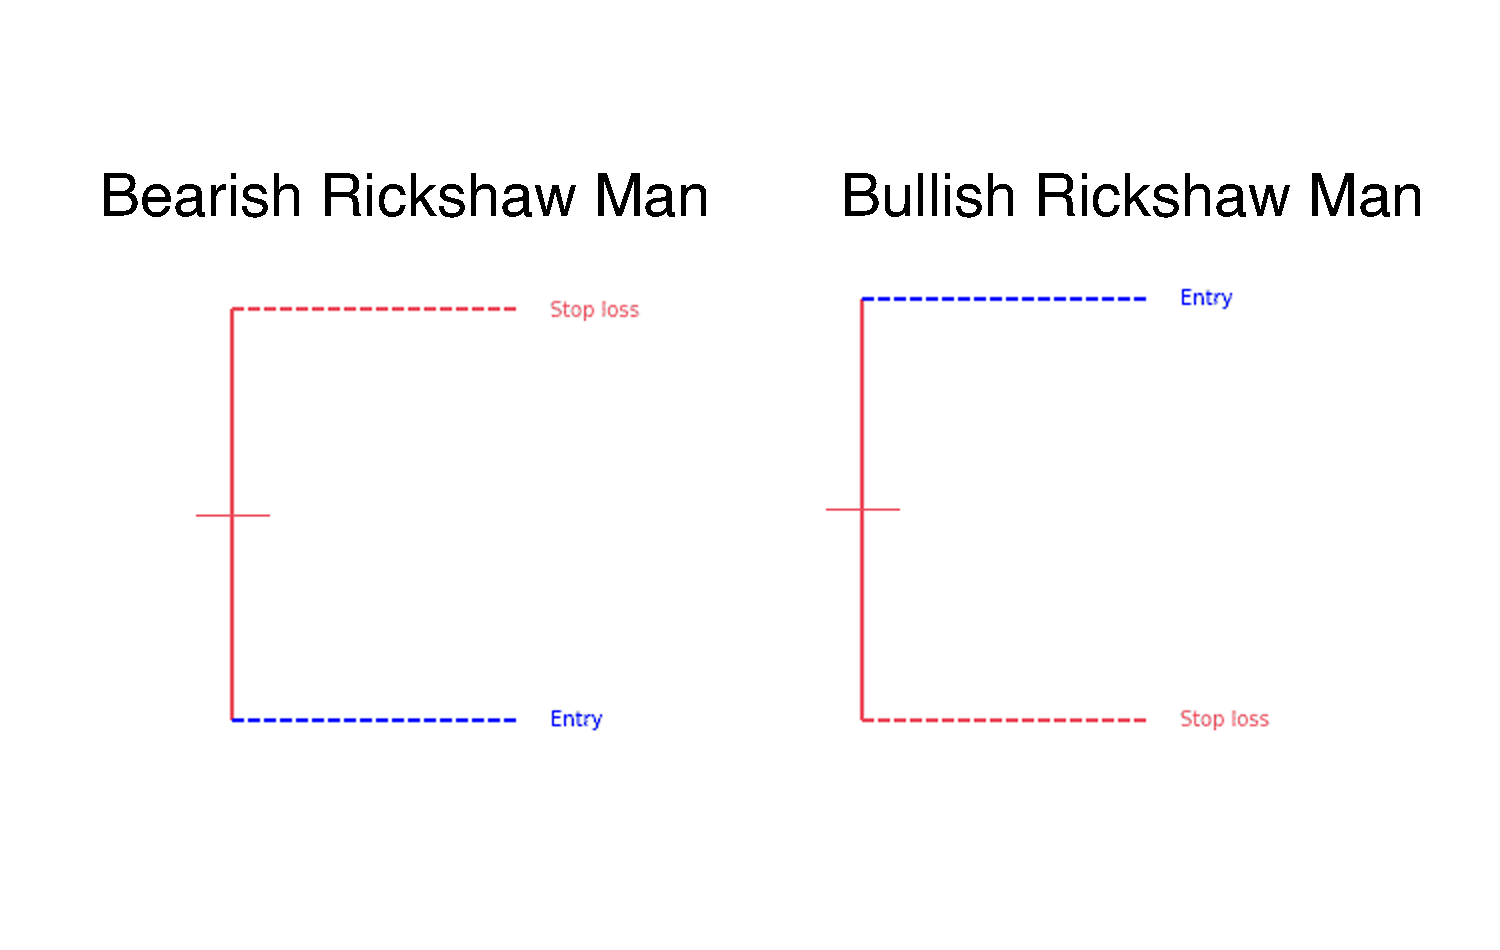
The rickshaw man is a type of long-legged doji candlestick where the body is found at or very near the middle of the candle.
This pattern signals indecision in the marketplace, as indicated by its long upper and lower shadows and a small real body near the center of the candle.
Understanding Rickshaw Man
A candlestick shows the high, low, open, and close prices.
In the case of the rickshaw man, the open and close prices are at or very close to the same level, creating a doji.
The high and low are far apart, leading to long shadows on the candlestick.
This formation indicates that both bulls and bears exerted control over a security’s price at different times during the same period, resulting in significant volatility but no clear directional movement by the close.
The dynamics of the rickshaw man suggest indecision in the market.
In some contexts, this pattern might represent a period of consolidation, suggesting the continuation of a previous trend.
In other cases, it might indicate indecision at the end of a bullish run-up, potentially signaling a market reversal.
Traders may choose to bet on a continuation or reversal based on the context, but in many instances, they may prefer to wait until a clearer chart pattern or price trend emerges.
The rickshaw man, like all long-legged doji patterns, indicates that the forces of supply and demand are nearing equilibrium.
While this pattern can represent a security’s movement over any timeframe, it is generally more significant on longer-term charts with more participants contributing to its formation.
When analysts use the rickshaw man in conjunction with other technical indicators, they are more likely to identify reliable trading signals.
For example, if the price is in an overall uptrend but has recently pulled back, a rickshaw man pattern coupled with an oversold stochastic making a bullish crossover could signal that a bottom to the pullback is near.
Once the price starts moving up, the pattern and indicator signals are confirmed.
Rickshaw Man Limitations
A rickshaw man candlestick signals indecision, but other forms of technical analysis are typically required to indicate whether this is good, bad, or insignificant.
If a trade is taken based on the rickshaw man candlestick, there is no inherent profit target, so it is up to the trader to determine where to take profit if the entry proves profitable.
The pattern occurs frequently, especially when price action is already choppy.
Therefore, traders must look for the pattern only in specific contexts that enhance the pattern’s reliability if they opt to use it.
Concluding Thoughts
The rickshaw man candlestick pattern serves as an indicator of market indecision and can be a useful tool for traders when combined with other technical analysis methods.
However, due to its frequent occurrence and lack of a clear directional signal, it should not be relied upon in isolation.
Traders are advised to use the rickshaw man in conjunction with other indicators and patterns to improve the accuracy of their trading decisions and to carefully assess the broader market context before acting on this pattern.