Awakening Bear

The selloff continues in the US markets, as the Dow and S&P 500 dropped for a fifth day, with the pullback coming on the cusp of earnings season. This slide marked the S&P 500’s worst day since December 8. The declines were the largest losses this year in terms of both points and percentage drops for each of the three major U.S. stock indexes.

All S&P 500 sectors ended solidly lower, with industrial and materials names suffering the biggest drops. About 80 percent of shares listed on the New York Stock Exchange and the Nasdaq Stock Market ended lower.

Concerns about European debt have resurfaced and could be a catalyst for further declines as the yields on riskier Italian and Spanish debt climbed. Alcoa climbed 5.4 percent to $9.82 in extended trading after the aluminum maker reported its quarterly results.

The CBOE Volatility Index (.VIX) jumped 8.4 percent to 20.39, and was up for the eighth straight day, its longest streak of consecutive gains in nearly nine years. At its session high, the VIX touched 21.06 – up almost 12 percent for the day.

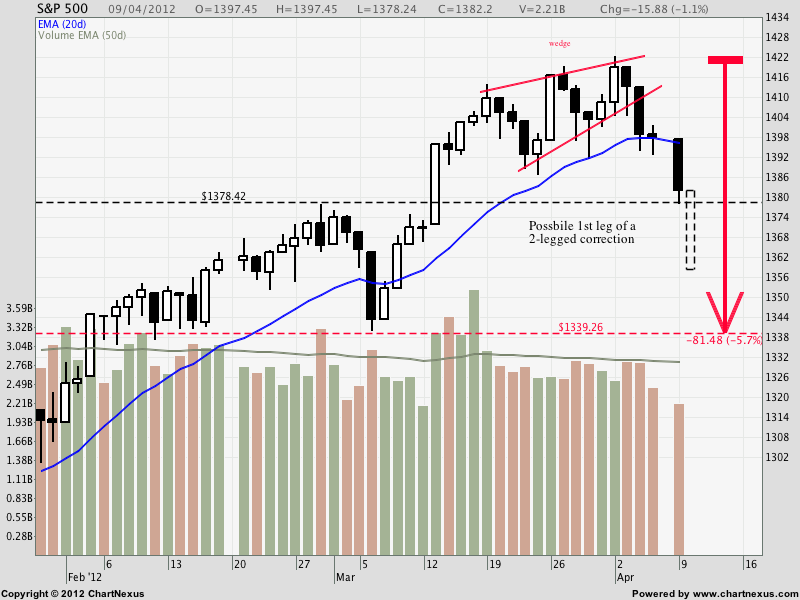
From the chart of the S&P 500, the next level of support is around 1,340, which would represent a correction of about 5.7% from the high. Today’s selldown could be the first leg of a 2-legged pullback which usually follows such a wedge pattern. This bearish spike has changed the nature of the market, confirming the one-sided bearish sentiment.

Avoid going long for now, but get ready to do so when the selling wave ends. Be aware of the major news events, and stick with the trends. “May the odds be ever in your favour”.  xD

S&P 500

Although there was weakness in the STI today at closing, the European and US markets have rallied strongly after comments from Bernanke.

“U.S. stocks advanced, sending the Standard & Poor’s 500 Index to the highest level since May 2008, after Federal Reserve Chairman Ben S. Bernanke said accommodative monetary policy is still needed to spur jobs.” – Bloomberg

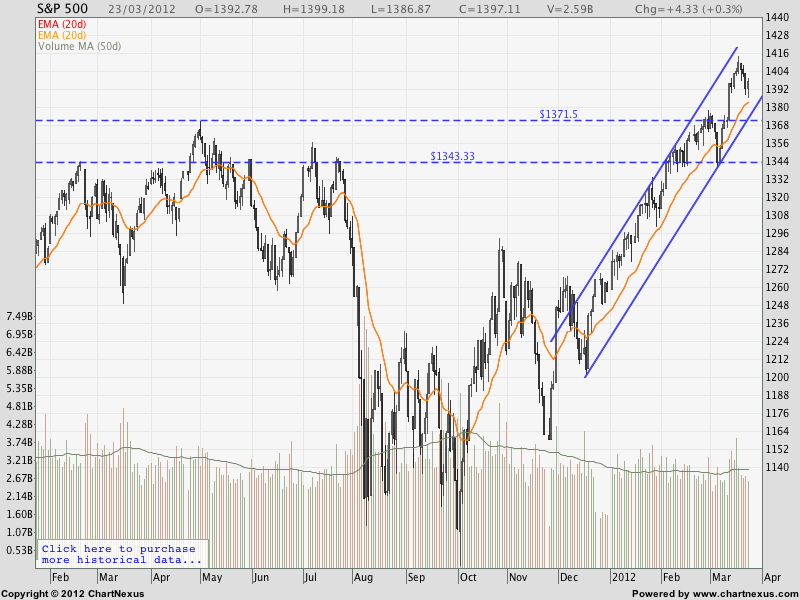
Looking at the chart, the S&P 500 has rallied strongly since the beginning of the year, and during the time employment has marginally improved, while the Fed has continued to keep interest rates low. Clearly, it seems the liquidity that is fueling the stock market is not translating into improvements in the real economy. This could prove problematic if the divergence continues to unhealthy levels.

For traders, it means that we should join the party and ride the trend however high it goes, but be ready to pull out when the music stops. For the STI, the last 2 weeks of ranging action makes the market hard to trade, and I am seeing more signs of weakness. Let’s see if today’s boost from the US markets can translate into gains for the STI.

Historically, April is one of the most bullish months of the year, but we will have to keep an eye on earnings, which may be lackluster since there has been no clear signs of economic bullishness.

People who exhibit endowment bias value an asset more when they own it, as compared to when they don’t. This is inconsistent with standard economic theory, which asserts that a person’s willingness to pay for a good should always equal the person’s willingness to accept disposition of the good.


Endowment Bias


In essence, this bias is a mental process in which a differential weight is placed on the value of an object. That value depends on whether one possesses the object and is faced with its loss or whether one does not possess the object and has the potential to gain it.

If one loses an object that is part of one’s endowment (ownership), then the magnitude of this loss is perceived to be greater than the magnitude of the corresponding gain if the object is newly added to one’s endowment.

For example, this bias influences traders to hold onto losing positions because they feel that they “own” the position, and are reluctant to close it and enter a better position instead, although the potential gains are higher. This is often the result of decision paralysis, which places an irrational premium on the compensation price demanded in exchange for the disposal of the endowed asset.

What is the best solution for this?

One way to break free from flawed thinking is to ask yourself, “if you did not have any positions at the moment, would you still choose to take the same position which you are currently holding?” If you answered no, then you might want to reflect on why you are still holding onto it.

“A wise man should have money in his head, but not his heart.”

– Jonathan Swift


complete guide to investing and trading psychology cover

If you would like to learn more about trading psychology, also check out: “The Complete Guide to Investing & Trading Psychology”


Long-term refinancing operations (LTROs) involve the central bank lending money at a very low interest rates to eurozone banks, which has led to the term “free money.”

The injection of this cheap money means that banks can use it to buy higher-yielding assets and make profits, or to lend more money to businesses and consumers – which could help the real economy return to growth as well as potentially yielding returns.

Banks can use assets such as sovereign bonds as collateral for the loans – although they can no longer use Greece’s bonds as collateral after the country was downgraded to a default rating by Standard & Poor’s. This has helped to boost some of the more troubled sovereign bonds, in peripheral countries such as Spain and Italy, as their yields have fallen because they are being used as collateral for the operations.

This can help out the entire country. Spanish and Italian banks, the biggest buyers in the last operation, used their holdings of their own sovereign bonds as collateral for the LTROs. This helped reduce sovereign bond yields, which were threatening to stay at unsustainable levels that would make debt repayments impossible.

In previous auctions, the money usually had to be paid back within three months, six months or 1 year. The ECB’s launch of three-year LTROs in December meant that this time scale was extended, which helped cause a much greater takeup than usual.

– references: CNBC


The question is, what happens after 3 years?

Unless the Euro zone countries can miraculously turn their economies around in 3 years, the problem has just been delayed by 3 years. If the banks choose not to loan out the cash, they can simply use the money to increase their returns via investments, which does not benefit the economy at all. Also, where does the ECB get this cash from? It will need to pay back the cash one day, or risk the devaluation of the Euro, similar to what the US is facing now. The collateral used are the sovereign bonds (which no one wants to buy in the first place), and should the countries decide to default, the ECB will be left with a lot of useless junk on their hands.

Global Market Highlights

China Cuts Bank Reserve Ratios
Greece Identifies $427M in Budget Cuts
Higher Prices Pinch Shoppers, Constrain Fed’s Options
Obama Urges Congress to Reward Technology Companies That Keep Jobs in U.S.
Germany drawing up plans for Greece to leave the euro
Dow nears psychological milestone: 13,000
S&P 500 nears 3-year high amid Greece bailout optimism

Global Stock Indices (Dow Jones Index) Weekly Chart

^dji-021912

On the weekly chart, the Dow is nearing major resistance, which coincides with the psychological level of 13,000. Get ready to short on signs of weakness, or wait for a breakout pullback setup.

Forex Markets (EUR/USD) Daily Chart

eurusd-021912

Currently, for the Euro, the major trend is down, although the minor trend for the past month or so has been up. After breaking above the support-turned-resistance, the breakout has failed and prices have pulled back below that level. It is now preferable to go short, unless the failed breakout fails and becomes a breakout pullback, in which case be prepared to go long.

Singapore Stocks (Straits Times Index)

^sti-021912

After clearing the key support-turned-resistance level, the STI has surged up to test the psychological round number of 3,000. Since there has been no significant pullback, this could be a chance for the STI to pullback before it resumes climbing up. On the other hand, prices have closed above 3,000 on Friday, and if it holds above that level, we could see higher prices.