How to Use the Trading Signals? (Detailed Instructions)
There are 3 main segments in this guide:
- Weekly Outlook Video: a 15-20 minute video highlighting the best trading opportunities and my detailed chart analysis
- Entering & Exiting Positions: how and where to determine your entry price, stoploss, target price, and other risk management tools
- Price Alerts on Telegram Channel: how to interpret and use the real-time price alerts
In this detailed guide, I will go through how to use each tool individually, and also how you can combine all three to maximise your edge in the market.
Table of Contents
1. Weekly Outlook Video
- Every week on Monday or during the weekends, both the weekly market report and the weekly Market Outlook are posted in a Telegram chat.
- The weekly Market Outlook video starts with a run-through of the weekly market report, highlighting important points. This is beneficial for those who don’t have time to read the report or prefer a video format.
- The video also covers various charts, starting with Forex counters and moving on to other currencies, including cross currency pairs.
- It then covers cryptocurrencies, typically Bitcoin and Ethereum.
- It moves on to discuss stocks, specifically focusing on indices like the Dow Jones, S&P 500, and Nasdaq.
- It also covers the China market, represented by ETFs like 2801 (general ETF for China stocks) and 3067 (ETF for China tech stocks).
- Further, it examines bonds, specifically the 20-year treasury bond (TLT).
- It looks at commodities like gold and silver, the Commodities ETF (DBC), and oil (WTI).
- It discusses Real Estate Investment Trusts (REITs) through the global REITs ETF (REET).
- Occasionally, it delves into individual stock counters if something noteworthy appears.
- The analysis includes charting elements like support/resistance lines, trend lines, trend channels, and the RSI indicator.
- It also includes price alerts placed on the chart.
2. Entering & Exiting Positions
- The video elaborates on details such as entering and exiting positions, and using a stoploss and trailing stoploss.
- Demonstrates how to use a grid software on the trading view toolbar to indicate entry and exit points.
- The grid software shows in one glance the entry price, stoploss price, and the target price, which makes tracking trades easier.
- Green grid indicates the target price level, while the red grid shows the stoploss level.
- Entry, stop loss, and target levels can be determined through the grid, aiding in managing the trade.
- To track trades after entering, one can use a trailing stoploss. One method suggested for this is using the ATR stops indicator.
- When the price hits or closes below the ATR stops indicator, it can be used as a signal to close the position.
- Using the ATR stops or similar tools helps in trailing the stop loss on a day-to-day basis.
2a. Execution: Trade Entries
Before entering a trade, you will need to factor in important considerations such as capital management (how to manage total trading capital), position-sizing (the quantity and dollar value of each trade), risk management (how much to risk on each trade), reward to risk ratio, etc.
These essential parameters are part of the 7 step checklist we use during the “Trading Mastery Program”, as missing out on either factor could drastically affect your trading returns.
Here are some examples:

Before placing a trade, it is also important to double-check the charts to before entering the trade, because prices might have moved significantly after the chart is posted.
If you get a new signal for a position that you already have, you can either choose to take on the new signal as a new trade, but it will be more risky as you will have more exposure to the same product.
However, if you are very confident of the product, this can also be a good way to accumulate more positions.
2b. Execution: Trade Exits
There are 2 ways you can exit a position:
- Winning trade: hit your target profit (TP), hit your trailing stoploss (TSL) or discretionary exit
- Losing trade: hit your stoploss (SL) or discretionary exit
For the target profit (TP), you can use the methods taught in the training, or you can use simple techniques like support & resistance or price projections from price patterns.
For the stoploss (SL) or trailing stoploss (TSL), besides the price action techniques used in the TMP, one of the easiest ways is to use the “ATR Stops” indicator in TradingView.
Additional reading: What is the Average True Range (ATR) indicator?

Just add it as an indicator and it will appear on your chart. I use (20, 2) as my default parameters.
Note: You can use this same method to add any new indicators on your chart. Sometimes, I might test out new indicators on my chart as well.

For example, if you short at the current price (short EP), then the stoploss (SL price) will be $335.80
This line (TSL) will adjust daily, so you can adjust your stoploss as the line moves.

2c. Trading Examples
In the chart below, let’s say you decide to buy this counter, and you enter at the entry price (EP). You would place your stoploss (SL) below using the “ATR Stops” indicator (green line) below.

Let’s fast forward about 2 weeks, and the price moved in your favour. Now, the current price is much higher than your entry price (EP).
Your new stoploss (SL) will be current value of the green line. In fact, at the end of each new bar, you can adjust your SL to the new value of the green line.

Eventually, when the trend changes, prices will come down to hit the green line, which is your stoploss (SL), and you will get closed out of the position.

This works if you are shorting the market as well.
In the chart below, let’s say you decide to short this counter, and you sell at the entry price (EP). You would place your stoploss (SL) above using the “ATR Stops” indicator (red line) above.

As price moves, you continue to adjust your stoploss daily using the red line, until one day the price hits your stoploss (SL) and your position is closed out.

3. Price Alerts on Telegram Channel
- The weekly Market Outlook videos provide insights into various financial products and how to identify trading opportunities, including entry points, stoplosses, targets, and methods for using trailing stop losses like ATR stops.
- The Telegram channel features trading signals which can be interpreted to inform trading decisions.
- The Telegram channel features different types of posts, some are news updates while others are charts from the weekly Market Outlook videos. These charts allow users to follow specific financial products or charts over time.
- The search function on the Telegram channel allows users to easily track a specific product.
- Some posts on the channel are simple signals with short commentary, indicating key movements in a product’s price.
- These alerts are triggered directly from TradingView, a charting platform used for analysis and setting trade alerts.
- Alerts are not direct buy or sell signals but more of a prompt to closely inspect a particular chart because something significant is happening.
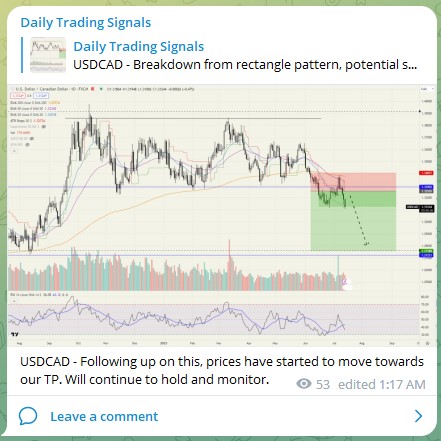
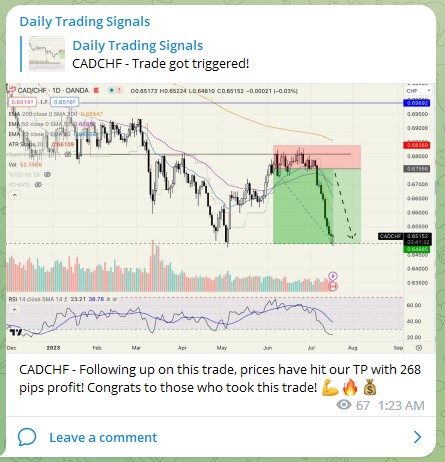
- Alerts are usually followed up with a detailed analysis or chart.
- The alerts include two parts: the first part usually refers to the name of the product and the second part is the price at which the alert was triggered.
- Alerts are set throughout the day and monitored by a system that notifies followers of significant events simultaneously.
- The trading signals help prevent missing potential trading opportunities.
3a. Real-Time Alerts
The first type of alerts are the real-time alerts, which looks something like this:

It involves a ticker symbol at the start, followed by some short notes.
These alerts are triggered whenever something something interesting happens in the price movement, such as prices reaching a crucial level, or making a new high or new low, etc.
If you are familiar with the 4 trading strategies taught in the “Trading Mastery Program”, you can use your knowledge to tackle these real-time signals and trade on them.
In short, you can think of these as alerts for potential trade ideas.
3b. Detailed Chart Analysis
The second type of alerts are detailed chart analysis, and it is usually a follow-up and more detailed evaluation of the earlier potential trade ideas from the real-time alerts.
It could look something like this, where it provides a trade idea and some entry and exit points:
Or it could be a macro-economic cross-sectional analysis of various markets and sectors:


Or it could be sharing my portfolio allocation strategy for the current market climate:

3c. Search Function
If you want to look for a particular counter, simply use the search function.
Make sure you are searching WITHIN the channel, and not doing a general search across all of Telegram.
Type in the ticker symbol of the product you are looking for, and you will be able to see all past signals and analysis of it.

 Our flagship mentoring program is suitable for both beginners and advanced traders, covering the 4 strategies which I used over the past 15 years to build up my 7-figure personal trading portfolio.
 If you're looking for the best trading opportunities every day across various markets, and don't want to spend hours doing the research yourself, check out our private Telegram channel!


Leave a Reply
Want to join the discussion?Feel free to contribute!