Oil Products and Oil Prices: What Moves the Oil Market (and How to Trade It)
Last updated: 3 July 2026 · By Spencer Li, CFTe
Oil prices move because oil is priced by global supply and demand, and a short list of forces keeps shifting both sides of that balance: OPEC production decisions, geopolitical events, economic growth, government policies, inventory levels, natural disasters, and the U.S. dollar. When supply falls or demand rises, prices go up. When supply floods or demand collapses, prices fall. “Oil” is not one thing either. It trades as several regional benchmarks (Brent, WTI, Dubai, Urals, Oman, Tapis), and you can get exposure through futures, options, ETFs, OTC derivatives, and oil-linked bonds and notes. OPEC matters because its members together pump roughly 40% of the world’s oil, so when they cut or raise output, the whole market feels it.
Here is the full picture: the oil products you can trade, the financial products that give you exposure, what OPEC actually does, and the seven factors that move price, each with a real historical example.
What are the different oil products?
There are several types of crude that trade as benchmarks in global markets. Each is priced a little differently because of its density (light or heavy), its sulfur content (sweet means low-sulfur, sour means high-sulfur), and where it is produced. Lighter, sweeter crude is cheaper to refine, so it usually commands a higher price.
| Benchmark | Type | Source | Used to price |
|---|---|---|---|
| Brent Crude | Light, sweet | North Sea | About two-thirds of the world’s internationally traded crude |
| WTI (West Texas Intermediate) | Light, sweet | United States | Crude oil in North America |
| Dubai Crude | Light, sour | United Arab Emirates | Crude oil in the Asian market |
| Urals Crude | Heavy, sour | Russia | Crude oil in Europe |
| Oman Crude | Medium, sour | Oman | Crude oil in the Middle East |
| Tapis Crude | Light, sweet | Malaysia | Crude oil in the Asia-Pacific region |
These are some of the most widely traded grades, and their prices are often used as a benchmark to price other types of crude. Brent and WTI are the two you will see quoted most. The specific characteristics of each grade (density, sulfur content, refining cost) drive its price and demand.
What are the financial products for trading oil?
You do not need a tanker to get exposure to oil. Several financial products track or hedge the oil price:
- Futures contracts. Agreements to buy or sell a set quantity of oil at a fixed price on a future date. These trade on exchanges such as the New York Mercantile Exchange (NYMEX) and the Intercontinental Exchange (ICE).
- Options contracts. Similar to futures, but the buyer gets the right, not the obligation, to buy or sell oil at a set price on a future date.
- Exchange-Traded Funds (ETFs). Investment products that track the oil price by holding a basket of related securities, giving you exposure without owning the physical commodity.
- Over-the-Counter (OTC) derivatives. Customized contracts negotiated privately between two parties, not traded on an exchange. Big oil companies and financial institutions use these to hedge against price moves.
- Commodity-linked bonds. Bonds issued by oil companies or governments, linked to the oil price, giving exposure through a debt instrument.
- Oil-linked exchange-traded notes (ETNs). Debt securities that track the oil price.
These let individuals and institutions get exposure to oil, or hedge against price swings. Do note that, each product carries its own terms, conditions, and risks. Understand them before you put money in. A futures contract and an ETF can both be “long oil” and behave very differently over the same month.
What is OPEC and what role does it play?
OPEC stands for the Organization of the Petroleum Exporting Countries. It is a group of oil-producing nations, including Saudi Arabia, Venezuela, Iran, and Iraq, founded in 1960 and headquartered in Vienna, Austria. (Membership has shifted over the years, so check the current count when you read this.)
OPEC’s job is to coordinate and unify its members’ oil production and sales policies. The aim is to regulate supply, keep prices stable, and ensure a fair return for oil-producing countries.
Here is why it matters to price. OPEC members together produce about 40% of the world’s oil, so by coordinating their output they can move global supply, and therefore price. If OPEC agrees to cut production, supply drops and prices tend to rise. If it agrees to raise production, supply grows and prices tend to fall. Those decisions ripple through the global economy and the budgets of every country that imports oil, which is exactly why OPEC’s meetings draw so much attention, and so much criticism.
Which factors affect oil prices?
Several forces move the oil price. Most of them work by changing one side of the supply-and-demand balance. Here they are, each paired with a real historical example of it in action.
| Factor | How it moves price | Real example |
|---|---|---|
| Supply and demand | High demand plus low supply lifts price; the reverse drops it | The 2008 global financial crisis crushed demand while supply stayed high, and the oil price fell sharply |
| Geopolitical events | Conflict in producing regions disrupts supply and spikes price | The 1990 Gulf War disrupted Middle East production and transport, pushing prices sharply higher |
| Economic growth | Growing economies burn more oil, lifting demand and price | China’s rapid growth in the early 2000s drove up oil demand and price |
| Government policies | Taxes, subsidies, and sanctions shift supply or demand | The 2018 sanctions on Iran cut its oil supply and pushed prices up |
| Inventory levels | High storage means lower prices; low storage means higher | The 2020 COVID-19 demand collapse filled storage, and the oil price dropped |
| Natural disasters | Storms and quakes disrupt production and transport, spiking price | Hurricane Harvey in 2017 hit Gulf of Mexico production, spiking prices |
| Currency exchange rates | Oil is priced in U.S. dollars, so a weaker dollar tends to lift the price | The early-2000s dollar depreciation raised the oil price for non-dollar buyers |
A pattern worth noticing in those examples: every price move also moved the traders. A supply disruption did not just raise price, it pulled in speculators buying futures in anticipation of more upside. A demand collapse did not just lower price, it triggered selling as traders cut their oil exposure. Price moves the fundamentals, and the fundamentals move the crowd, and the crowd moves price again. That feedback loop is most of what you are actually trading.
Keep in mind this is not the complete list. The oil market is complex, and plenty of other forces, internal and external, feed into the price.
How do you actually trade oil with all this going on?
Honestly, you do not need to forecast OPEC’s next meeting or model the dollar to trade oil well. That is the trap most beginners fall into. They try to out-analyze the entire energy complex, freeze, and never take a trade.
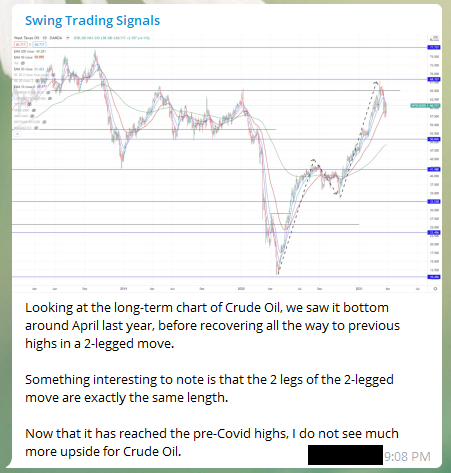
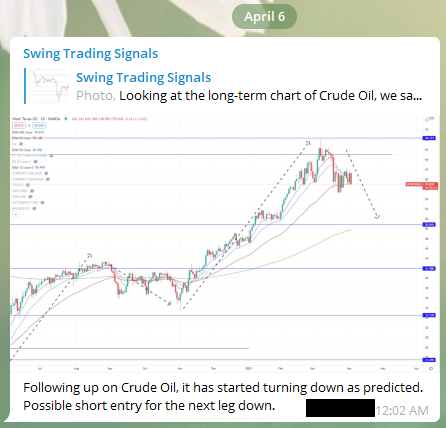
Personally, I trade oil the same way I trade everything else: as a chart. All of these factors, supply, demand, OPEC, the dollar, the next hurricane, are already being priced in by the market in real time, and they show up as the structure on the chart. My job is not to predict the news. My job is to read what price is doing, find a low-risk entry, size it properly, and manage the risk if I am wrong.
Here is where the human edge comes in. An AI or a news feed can summarize every oil factor above for you in a second. That part is now free. What it will not do is tell you that the fundamentals are screaming “buy” while the chart is quietly rolling over, or stop you from over-sizing a volatile commodity because the story felt so convincing. The information is the easy part. The judgment to act on it, or to stand aside, is the part worth learning, and it is the first of the Five Edges an algorithm cannot trade for you.
FAQ
What is the difference between Brent and WTI crude oil?
Both are light, sweet crude oils used as benchmarks, but Brent is extracted from the North Sea and prices about two-thirds of the world’s internationally traded crude, while WTI (West Texas Intermediate) is produced in the United States and is the benchmark for North American crude.
Why do oil prices change every day?
Because oil is priced by global supply and demand, and a handful of forces keep shifting both sides: OPEC production decisions, geopolitical events, economic growth, government policies, inventory levels, natural disasters, and the strength of the U.S. dollar.
How does OPEC affect oil prices?
OPEC members together produce about 40% of the world’s oil, so when they coordinate to cut production, supply drops and prices tend to rise, and when they raise production, supply grows and prices tend to fall.
How can I invest in or trade oil?
You can get exposure through futures contracts, options, oil ETFs, OTC derivatives, commodity-linked bonds, and oil-linked ETNs. Each tracks the oil price differently and carries its own risks, so understand the product before you commit.
Does a weaker U.S. dollar raise oil prices?
Generally yes. Oil is priced in U.S. dollars, so when the dollar weakens, oil becomes cheaper for buyers using other currencies, which tends to lift demand and the price.
So, will you consider adding an oil product to your portfolio, and how do you think the rise of renewable energy will reshape the oil market in the years ahead? Let me know in the comments.
And if you want the broader picture of how commodities fit alongside stocks, forex, and bonds, read the pillar: The Beginner’s Guide to Commodity Trading.
Want a simple way to trade any market, including oil? Grab the free 15-Minute Swing Trading Starter Kit. It’s the exact routine I use to scan once a day and trade any market in 15 minutes.
About the author. Spencer Li is the founder of Synapse Trading and a Certified Financial Technician (CFTe) with 15 years of trading across stocks, forex, crypto, commodities, and bonds. His trade log is public, 404 trades, losses left in. He teaches low-risk swing trading in 15 minutes a day, one system for any market.
Education, not financial advice. Synapse Trading is not licensed by MAS to advise on investment products. Trading carries risk of loss; past performance is not indicative of future results.
Related
Beginner’s Guide to Commodity Trading (pillar) · How to trade gold · What is forex trading · Futures vs options