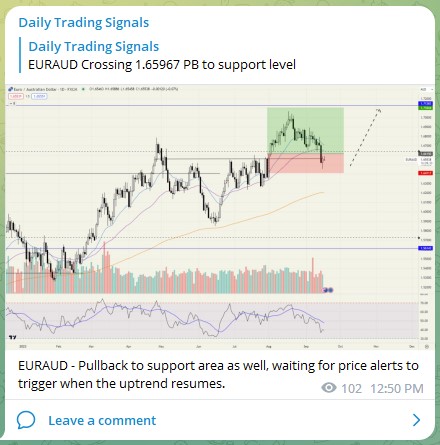
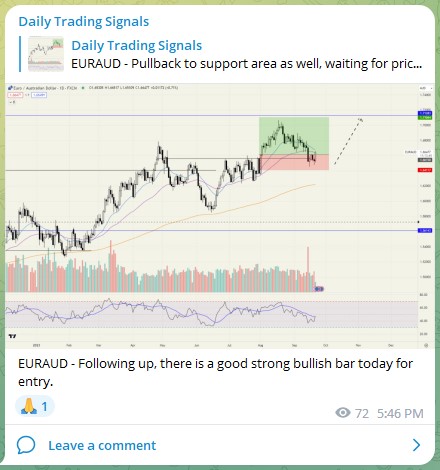
Market analysis, insights and trading ideas on various markets and products!

In forex trading, traders encounter different types of analysis.

Some prefer fundamental analysis, while others prefer technical analysis and even combine various indicators.

Trading with indicator combinations might seem complicated at first, but understanding how they work can make it easier.

There are three main principles to combining technical indicators effectively:

  • Ensure indicators are not redundant (avoid type overlapping).
  • Categorize the type of indicators.
  • Follow the right steps.

Let’s explore each principle in detail.

Beware the Risk of Redundancy

Many traders mistakenly think that combining multiple indicators will automatically yield better trading results. However, more does not always mean better. Indicators have specific functions, and mixing two indicators with the same function can lead to redundant signals.

For example, combining the Bollinger Bands and ADX indicators, both of which gauge trend strength, might seem useful. However, this combination only confirms the same trend strength, providing no additional insights. Similarly, using the RSI, CCI, and Stochastic indicators together would lead to redundancy because they all measure momentum in a similar way.

The key issue is that traders may believe the signal is stronger because multiple indicators agree, but in reality, it’s just a confirmation of the same information. Relying too heavily on this can lead to overlooking other important factors in trading.

Categorizing Forex Indicators

Before selecting indicators, it’s crucial to understand their categories. By choosing indicators from different categories, you ensure they complement each other rather than provide duplicate signals. Here are the main categories:

  • Momentum Indicators: Stochastic, RSI, CCI, MACD, Williams %, etc.
  • Trend Indicators: Bollinger Bands, ATR, MACD, ADX, Moving Averages, Donchian Channel, etc.
  • Volatility Indicators: Bollinger Bands, ATR, Standard Deviation, Keltner Channel, Pivot Points, etc.

Steps to Combine Forex Indicators the Right Way

Here are the steps you should follow to combine forex indicators effectively:

  1. Choose an indicator to identify market conditions: For example, a Moving Average can show whether a market is trending or ranging. If the MA is rising and above the price, it’s an uptrend.
  2. Pick an indicator that triggers trade entries: The RSI can be used to signal entries. For example, when the RSI crosses above 30 after being oversold, it signals a buying opportunity.
  3. Find indicators for trade management: Use indicators like the Pivot Point or ATR to set stop loss or profit target levels.

To combine indicators effectively, use one from each category (momentum, trend, and volatility) and limit the combination to no more than three indicators.

Indicator Combinations You Can Try

Here are some examples of effective indicator combinations:

1. MA, RSI, and Pivot Point:
This combination works well for swing trading. The Moving Average analyzes the trend, the RSI measures momentum, and the Pivot Point identifies support and resistance levels for profit targets.

2. ATR and Donchian Channel:
Best for breakout trading in low volatility markets. The ATR identifies volatility, and the Donchian Channel provides entry signals.

3. RSI and Bollinger Bands:
RSI shows momentum, and Bollinger Bands indicate volatility and trend direction.

4. RSI, ADX, and Bollinger Bands:
The ADX confirms the trend, the RSI measures momentum, and Bollinger Bands assess volatility.

5. Bollinger Bands and Stochastic:
Bollinger Bands show trend direction, while the Stochastic predicts trend strength. When combined, they provide accurate entry signals.

6. RSI and MACD:
The MACD shows trend direction, and RSI helps identify overbought or oversold conditions. This combination helps confirm trends and potential entry points.

RSI or Stochastic: Which One Should Be Used?

Both RSI and Stochastic are momentum indicators, but they perform best under different market conditions. The RSI is more suitable for trending markets, while the Stochastic is better for sideways markets. RSI is often applied to shorter time frames, while the Stochastic is used for mid to long-term momentum.

Concluding Thoughts

The best forex indicator combinations consist of indicators that complement one another.

Avoid using indicators with the same function, as this creates redundancy.

Instead, choose indicators from different categories to provide a broader view of market conditions.

Always test indicator combinations in a demo account before applying them to real trades to avoid risking real money.

One of the oldest adages in all of trading is that “the trend is your friend.”

The trend defines the prevailing direction of price action for a given tradable security.

As long as the trend persists, more money can be made by going with the current trend than by fighting against it.

However, many traders instinctively want to buy at the lowest price and sell at the highest price within a given time period.

This approach requires using countertrend signals to “buy the bottom” and “sell the top.”

Each trading day, a struggle plays out between those attempting to trade with the trend and those trying to time the market by buying near the low and selling near the high.

Both types of traders have strong arguments for their approach.

Interestingly, one of the best methods may involve combining these two seemingly different strategies.

Often, the simplest solution is the best one.

A Combined Approach

To successfully combine trend-following and countertrend techniques, two key actions are needed:

  • Identify a method that does a good job of spotting the longer-term trend.
  • Identify a countertrend method that highlights pullbacks within the longer-term trend.

Finding the perfect approach may take time and effort, but the concept can be highlighted using simple techniques.

Step 1: Identify the Longer-Term Trend

One way to identify the longer-term trend is by plotting the 200-day moving average of closing prices.

A stock’s price above the 200-day moving average indicates an uptrend, while a price below it indicates a downtrend.

However, adding a second trend-following filter can give more precision.

By adding the 10-day and 30-day moving averages, traders can refine their understanding of the current trend.

If the 10-day moving average is above the 30-day moving average, and the price is above the 200-day moving average, the trend is designated as “up.”

If the 10-day moving average is below the 30-day moving average, and the price is below the 200-day moving average, the trend is designated as “down.”

Step 2: Adding a Countertrend Indicator

There are many countertrend indicators to choose from, but for simplicity, we’ll use an oscillator based on short-term price action.

The oscillator is calculated as follows:

  • A = 3-day moving average of closing prices
  • B = 10-day moving average of closing prices
  • Oscillator = (A – B)

When the oscillator is below zero, it indicates a pullback in price, and vice versa.

Step 3: Combine the Two Methods

By combining the trend-following and countertrend techniques, traders can look for instances when:

  • The 10-day moving average is above the 30-day moving average.
  • The latest close is above the 200-day moving average.
  • Today’s oscillator is above yesterday’s oscillator.
  • Yesterday’s oscillator was negative and below the oscillator value two days ago.

This scenario suggests that a pullback within a longer-term uptrend may have been completed, signaling that prices could move higher.

The Drawbacks

There are several caveats to this method.

First, this is not a guaranteed trading system but rather an example of combining two techniques to generate potential trading signals.

A responsible trader would need to thoroughly test any method before using it with real money.

In addition, traders need to consider other factors beyond just entry signals, including:

  • How positions will be sized.
  • What percentage of capital to risk.
  • Where to place stop-loss orders.
  • When to take profits.

Concluding Thoughts

While the method described here offers potential merit by combining trend-following and countertrend approaches, it is essential for traders to test and evaluate it before risking capital.

No strategy is foolproof, and many other factors must be considered to create a successful trading plan.

Nevertheless, combining these two techniques could help traders buy at more favorable times while still adhering to the dominant trend in the market.

Indicators, such as moving averages and Bollinger Bands®, are technical analysis tools used by traders and investors to analyze past price trends and anticipate future price patterns.

Fundamentalists focus on economic data or corporate profitability, while technical traders rely on charts and indicators to interpret price moves.

The primary goal of using indicators is to identify trading opportunities.

For example, a moving average crossover can signal an upcoming trend change.

Applying an indicator to a price chart allows traders to spot where the trend may weaken or reverse, creating potential trading setups.

Technical strategies typically use indicators to define specific rules for entry, exit, and trade management.

These strategies often combine multiple indicators to pinpoint the best times to trade and establish objective decision-making rules.

Indicators

There are various technical indicators available for traders, including widely used tools like moving averages or stochastic oscillators.

Some indicators are publicly available, while others are proprietary, developed by traders or programmers.

Most indicators have user-defined variables, such as the “look-back period,” which allows customization based on the trader’s needs.

For instance, a moving average might calculate a stock’s price over a specific period, such as 50 or 200 days.

The length and price points used in the calculation can be adjusted by the user to fit their trading style.

Strategies

A strategy is a set of objective, predefined rules for when a trader will take action.

It includes trade filters and triggers, often based on technical indicators.

A trade filter identifies when a potential setup occurs, while the trade trigger defines the exact moment to enter or exit a trade.

For example, if a stock closes above its 200-day moving average, this could set the stage for a trade trigger if the stock rises one tick above the high of the bar that broke the moving average.

A well-defined strategy addresses critical questions, such as:

  • What type of moving average will be used?
  • How far above the moving average should the price move to trigger a trade?
  • What kind of order will be placed?
  • How will position size be determined?
  • What are the money management and exit rules?

Without answering these questions, strategies may be too simplistic and not actionable.

Using Technical Indicators

Indicators themselves are not strategies.

While they help traders identify market conditions, a strategy outlines specific actions to take.

Combining multiple indicators from different categories—such as momentum, trend, or volume indicators—can improve a strategy’s reliability.

For example, using a moving average in conjunction with a momentum indicator like the Relative Strength Index (RSI) might confirm the validity of a signal.

By employing indicators from different categories, traders avoid multicollinearity, where multiple indicators provide the same information, leading to redundant or misleading signals.

Choosing Indicators to Develop a Strategy

The choice of indicators depends on the type of strategy a trader wants to develop.

A trend-following trader may prefer using trend indicators like moving averages, while a trader looking for frequent small gains might opt for volatility-based indicators.

Traders can also purchase black-box systems that have already been researched and backtested, but these proprietary systems typically don’t disclose the underlying methodology, limiting the trader’s ability to customize the strategy.

Concluding Thoughts

While indicators are essential tools in technical analysis, they do not create trading signals on their own.

Traders need to define clear rules for how indicators will be used in a strategy, ensuring objective decision-making for when to enter and exit trades.

There is no “holy grail” strategy that guarantees success.

Each trader must develop their approach based on their unique style, risk tolerance, and understanding of the markets.

By learning about different technical analysis tools, traders can refine their strategies to improve their trading performance.

The Advance/Decline (A/D) line is a technical indicator that tracks the difference between the number of advancing and declining stocks on a daily basis.

This indicator is cumulative, meaning a positive difference is added to the previous total, and a negative difference is subtracted from it.

The A/D line reflects market sentiment, as it indicates whether more stocks are rising or falling.

Traders use the A/D line to confirm trends in major indexes and to spot potential reversals when divergence occurs.

How to Calculate the A/D Line

To calculate the A/D line, follow these steps:

  • Subtract the number of declining stocks from the number of advancing stocks to get the Net Advances.
  • If it’s your first time calculating, use this value as the initial value for the indicator.
  • For the next day, calculate the Net Advances again, and either add or subtract it from the previous total depending on whether it’s positive or negative.
  • Continue this process daily to maintain the A/D line.

What the A/D Line Tells You

The A/D line helps confirm the strength of a trend and can indicate potential reversals.

When major indexes are rising, and the A/D line is also rising, it suggests strong participation in the rally, confirming the trend.

However, if the A/D line is declining while indexes are rising, known as bearish divergence, it signals weakening breadth, potentially foreshadowing a market reversal.

On the flip side, if indexes are falling but the A/D line is rising (bullish divergence), it suggests fewer stocks are declining, indicating the downtrend may be losing strength.

Difference Between the A/D Line and the Arms Index (TRIN)

The A/D line is a longer-term indicator, tracking the rise and fall of stocks over time.

In contrast, the Arms Index (TRIN) is a shorter-term indicator that compares advancing stocks and their volume.

Both provide different insights due to their distinct calculations and time frames.

Limitations of Using the A/D Line

The A/D line may not always be accurate when analyzing NASDAQ stocks.

This is because NASDAQ lists many small, speculative companies that can get delisted.

Even when delisted, these stocks remain in the cumulative values, which can skew future calculations.

Moreover, many indexes are market capitalization-weighted, giving more influence to larger companies.

The A/D line, however, treats all stocks equally, making it a better indicator for small and mid-cap stocks rather than larger companies.

Concluding Thoughts

The Advance/Decline line is a useful tool for tracking market breadth and confirming price trends.

While it can offer valuable insights, especially with small to mid-cap stocks, traders should be mindful of its limitations and use it alongside other technical indicators to get a clearer picture of market behavior.

The Arms Index, also known as the short-term trading index (TRIN), is a technical analysis indicator that compares the number of advancing and declining stocks (AD Ratio) to advancing and declining volume (AD Volume).

It gauges overall market sentiment by measuring market supply and demand.

Understanding the Arms Index (TRIN)

Richard W. Arms, Jr. invented the TRIN in 1967.

It serves as a predictor of future price movements in the market, primarily on an intraday basis, by generating overbought and oversold levels that indicate when an index and its majority of stocks will likely change direction.

When AD Volume has a higher ratio than the AD Ratio, TRIN will be below one, signaling bullish market sentiment.

When AD Volume is lower than AD Ratio, TRIN will be above one, signaling bearish sentiment.

A TRIN reading below one typically accompanies a strong price advance, while a reading above one often indicates a strong price decline.

The Arms Index moves in the opposite direction of the index: a strong price rally will lower TRIN, while a falling index will push TRIN higher.

Formula for Arms Index (TRIN)

The formula for calculating TRIN is:

TRIN=Advancing Stocks/Declining StocksAdvancing Volume/Declining VolumeTRIN = \frac{\text{Advancing Stocks} / \text{Declining Stocks}}{\text{Advancing Volume} / \text{Declining Volume}}

Where:

  • Advancing Stocks refers to the number of stocks rising in price.
  • Declining Stocks refers to the number of stocks falling in price.
  • Advancing Volume represents the total volume of all rising stocks.
  • Declining Volume represents the total volume of all falling stocks.

How to Calculate the Arms Index (TRIN)

To calculate the Arms Index:

  1. At regular intervals (e.g., every five minutes or daily), calculate the AD Ratio by dividing the number of advancing stocks by declining stocks.
  2. Divide total advancing volume by total declining volume to get AD Volume.
  3. Divide the AD Ratio by the AD Volume.
  4. Record the result and plot it on a graph.
  5. Repeat at each interval to create a graph showing TRIN movement over time.

What Does the Arms Index (TRIN) Tell You?

TRIN helps explain overall movements in stock exchanges like the NYSE or Nasdaq by analyzing the strength and breadth of these movements.

A TRIN value of 1.0 indicates that the AD Volume equals the AD Ratio, suggesting the market is in a neutral state.

Values below 1.0 are generally bullish, while values above 1.0 are considered bearish.

When TRIN exceeds 3.0, it indicates an oversold market, suggesting a potential price reversal upward.

Conversely, a TRIN value below 0.50 may signal an overbought market, suggesting a possible price drop.

The Difference Between the Arms Index (TRIN) and the Tick Index (TICK)

TRIN compares advancing and declining stocks with their respective volumes.

The Tick Index, on the other hand, compares the number of stocks on an uptick versus a downtick without factoring in volume.

Both are used to gauge market sentiment, but the Tick Index focuses on intraday movements.

Limitations of Using the Arms Index (TRIN)

TRIN can sometimes provide misleading signals.

For example, on a very bullish day with twice as many advancing stocks as declining ones and twice as much advancing volume, TRIN would still yield a neutral reading of 1.0.

In some cases, a bullish scenario with three times more advancing stocks but only twice the advancing volume would result in a bearish reading of 1.5.

To avoid misinterpretations, traders may separate advancing/declining stocks and volume into their own ratios (called the advance/decline ratio and upside/downside ratio) to gain clearer insights.

Concluding Thoughts

The Arms Index (TRIN) is a valuable tool for measuring market sentiment and predicting market movements.

While it can provide important insights into whether the market is overbought or oversold, it should be used in conjunction with other technical indicators and analysis methods to improve accuracy.

Its value lies in its ability to reflect the broader market’s behavior, but traders should remain cautious of its limitations in certain market conditions.