Market analysis, insights and trading ideas on various markets and products!

roadmap accuracy 150320

Recently I have been receiving a lot of emails and messages asking about the market, and also an unprecedented number of people joining my private trading network, and the obvious reason for this is that the markets now are offering excellent trading opportunities.

Heading into Bear Market Territory

Last Thursday, we officially saw the stock market enter the bear territory, with a 20% correction from all-time highs.

Many people tell me that it is impossible to time the markets. But is that really true, or are they just parroting something they read online or from a book?

Take a look at the 2 charts below. The one on the left is the chart I posted for my students on 27 February 2002.

Now take a look at how accurately it played out on the right, which is the what actually happened.

Now imagine if you had that roadmap on the left, how much money would you have made, or how much money would you have saved by liquidating your portfolio before the full crash?

Is the Bear Market Over, or is it Just Starting

How Much Did You Make from This Crash?

While most “value investors” or “long-term investors” are complaining about how badly hit their portfolios are, the truth is that the only thing they can do now is quote Warren Buffett and hope that the market rebounds in the long-run.

Eventually, it probably will, and I will also be buying in once the crash is over, but why would I want to sit through a crash that can be avoided?

And more importantly, why would I want to miss such a great money-making opportunity?

These past few weeks of steep declines have probably been some of the best trading days I’ve seen in my career, allowing me to more than double my trading account (ROI of +169.54%) in this short span of time.

This is probably more than most people’s one year salary. Yikes!

How Much Did You Make from This Crash


And I am glad to be able to guide my students (including complete newbies) during this period of time to generate awesome returns as well on their trading accounts.

How Much Did You Make from This Crash 2How Much Did You Make from This Crash 3

Swing Trading Opportunities

With the market in such turmoil (and high volatility), there are going to be a lot trading opportunities on the intraday and swing timeframe, but you will need to have the right skills and techniques to trade these markets.

I would also recommend using smaller lot sizes to trade if you are not used to fast markets.

For example, in my trade below, I used a very small 0.01 lot size to take quick trades on the S&P 500, which allowed me to make US$671 on just one trade in a few minutes.


How Much Did You Make from This Crash 4

If you take a couple of such trades a day, and use good money management to pyramid or stack positions on strong setups, it is not hard to generate 5 figures a day in such markets.

Of course, these are not normal market conditions, and I do not know how long they will last, which is why we need to make the most of it for the next few weeks.

Roadmap for the Bear Market

Some of the common questions I have been getting:

  • How long and how deep is this correction going to be?
  • When is the virus going to peak?
  • When should I start buying?
  • What should I be buying?
  • Should I sell off my portfolio in case it falls more?

In my opinion, a lot of factors are hard to predict, and this crash is unique because it happened so quickly.

The 2008 crash took 18 months to correct about 50-60%, while this time we took about 3 weeks to correct 25-30%.

That’s insanely fast. some people have not even had the chance to panic sell yet. ?

Although China has mostly managed to control the spread, and is on the route to recovery, many countries in Europe, Middle East and the US are still seeing and exponential increase in cases, so what we want to see is a deceleration of cases, so that from there we can estimate where the peak is.

If you look at the graph of all the past corrections in the S&P 500, there are only about 5 times in the past 55 years where it has gotten worse then this. (Also don’t forget to join our free Telegram channel for daily market updates if you click on that link.)

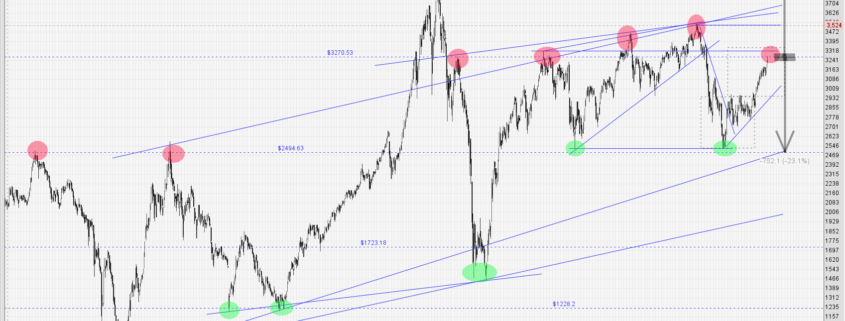
Personally, I do not think the bottom is here yet, and after consulting my charts over the weekend, I have come up with another roadmap for the next few months.

To be fair, I will only be sharing this new roadmap with my students, and I will continue to monitor the markets daily so that I can update them when I feel that it is time to start buying.

The Once-A-Decade Opportunity

Anyway, if you have missed the move down, do not despair, because the next big opportunity is the move up, once the decline ends.

Opportunities like this to multiply your wealth only comes once in a decade, so if you don’t want to miss this chance, I would like to invite you to join our private network with an awesome community of traders.

If you would like to avoid missing out on any of such awesome trades (which we deliver on a daily basis), then you should definitely check out our training program & trading signals bundle:
https://synapsetrading.com/the-synapse-program/

The Once-A-Decade Opportunity

The Once-A-Decade Opportunity 2

See you on the inside! ???

monthly profits 090320

Last week, we had an epic week, with stock indices swinging up and down on alternate days, giving swing traders one of the best opportunities to trade.

Yields plunged (which meant bonds spiked), Gold was up, and oil was also bearish.

In this post, I will be giving an update on 2 of my largest positions:

  • Short position on Crude Oil
  • Short position on S&P 500


Short position on Crude Oil

For those of you following my last blog post or my Telegram channel, you will know that I have been stacking my short positions in oil for quite a while, and recently with the price war OPEC, Russia and the US are having, prices are on a downward spiral.

Just today, prices plunged 25-30% in one day!

I have taken the chance to cover my positions, and recently initiated a long position at $30, as I feel that it is a bit oversold, and prices are very near the lows back in 2003 and 2016, so maybe negotiations might start again to push prices back up.

Crude Oil

Crude Oil 2Crude Oil 3


Short position on S&P 500

For those who have been following closely, you will also know that I have been short on the stock market, using the S&P 500 as a benchmark.

At the first sign of decline, I posted this predictive roadmap, which has turned out be be uncannily accurate.

Crude Oil 4


Simply by following this, my students and I have managed to stay one step ahead in the market, and we have been profiting handsomely both from long and short positions.

As I mentioned in my last trading video, you need a solid trading plan if you want to be able to make money from the markets, instead of chasing price movements blindly.


Crude Oil 5


This is where we are the moment in the roadmap, and I am still holding my short positions.

Crude Oil 6

Is this a good time to start buying?

In the long run, I am still bullish on stocks, so I will keep looking for good buying opportunities.

The challenge, however, is avoiding large drawdowns.

So I will want to wait for the dust to settle before buying, and not attempt to catch a falling knife.

If you look at the chart below, since the 1970s, there have only been 3 times when the market corrected to 50% or more, so such super crashes are actually pretty rare.

So maybe a 20-25% correction this time might be more likely, I will see when we get there, since I am still short at the moment.


Crude Oil 7


Overall, the last 2 months have been pretty fantastic, with 39.81% portfolio gains in February, and 25.8% returns so far in March.

These gains large larger than normal, due to market conditions, but it would allow me to chill for the rest of the year. ?

Remember, it’s not how many shots you make, but how many shot actually hit the target. One good shot is all is needed to make the kill.

Crude Oil 8


Going forward, this week the market is looking bearish now, and the level of fear is increasing. This will present us with excellent trading opportunities.

If you would like to avoid missing out on any of such awesome trades (which we deliver on a daily basis), then you should definitely check out our training program & trading signals bundle:
https://synapsetrading.com/the-synapse-program/

See you on the inside!

exhaustion gap 010320

Last week, we saw the stock market decline for every day of the week, crashing about 15% from all-time highs, making it the sharpest decline in history.

This huge spike in volatility was excellent for short-term traders, and might also be an opportunity for bargain hunters looking to buy stocks cheaper.

I also made a short video talking about the different approaches to tackle the market crash:

The Start of the Decline

The first 2-3 days of decline was sparked after fears of a worldwide contagion of the Covid-19 virus, which saw a gap down on the S&P 500.

I started to post warnings about not trying to pick the bottom or to start buying, because I knew that a larger move was likely to come.

The Start of the Decline


How Far Can this Crash Continue?

As the crash continued, I consulted my charts to plot a possible long-term roadmap, which would see a continued decline to about 15-20%, followed by a rebound and period of consolidation.

How Far Can this Crash Continue


If there is a strong second wave of selling, we could see a larger sell-off to the bottom of the trendline, or the 200-moving average of the weekly chart.

How Far Can this Crash Continue 2


At the same time, we also started initiating short positions on Crude Oil and AUD/JPY.

How Far Can this Crash Continue 3

How Far Can this Crash Continue 4

How to Catch a Falling Knife (Successfully)

On Friday, I predicted that there would be a rebound towards the closing, since there was no meaningful pullback after 6 consecutive days of selling, and also traders would likely close their short positions going into the weekend.

So I started accumulating long positions as the market tested new lows, and true enough, there wasn’t much further decline and even had a bullish surge into the closing minutes.

I took the chance to liquidate some of my positions to lock in my profits for the weekend.

How to Catch a Falling Knife

How to Catch a Falling Knife 2

How to Catch a Falling Knife 3


Overview of Trading Results for Friday

Overall, it was a once-in-a-lifetime exciting chance to trade such volatility, and also a great learning experience for my students as we got to observe and discuss it together in real-time.

My trading portfolio booked a net 39.52% gain, with most of the profits coming from just 3 positions:

  • Short on AUD/JPY
  • Short on Crude Oil
  • Catching the bottom of S&P 500

Overview of Trading Results for Friday

Overview of Trading Results for Friday 2


Going forward, next week is going to be an excellent week for bargain hunting, and I have already posted my target portfolio allocation for my students so that we can be on the lookout for buying opportunnities.

If you would like to avoid missing out on any of such awesome trades (which we deliver on a daily basis), then you should definitely check out our training program & trading signals bundle:
https://synapsetrading.com/the-synapse-program/

See you on the inside!

forex market strength meter 240220

For the past 2 months, the Covid-19 virus (Wuhan virus, Coronavirus) which originated in China was highly contagious, but it managed to remain mostly in China, hence the global community as a whole did not seem that worred about it, as seem by how the Us markets continued to run up.

However, it now seems that the virus is speaking to other countries quickly, with outbreaks in South Korea, Italy, and the Middle East (Iran), sparking fears that this might go out of hand and create a global pandemic.

Spread of the Covid-19 Virus

As we can see from the map, the virus has spread to most of the developed economies, thankfully sparing Africa and South America.

It would be disastrous if the virus did get there, as they are battling many other problems and other diseases (eg. Ebola).

Spread of the Covid-19 Virus

The cases are still growing daily at an alarming rate, but at least it is no longer exponential.

The risk, however, is that clusters of outbreaks in various parts of the world might cause another exponential spike in cases.


Spread of the Covid-19 Virus 2

Bearishness in Aussie Dollar (AUD)

Safe haven assets like Gold, Bitcoin and USD have been strong, while currencies like NZD, EUR and AUD have weakened the most.

Bearishness in Aussie Dollar (AUD)


Here are some of the recent analysis and trades of AUD/USD and AUD/CAD:daily trading signalsdaily-trading-signals-2


Gold as a Hedge Against Stock Declines

Gold is a good hedge against a crash in the stock market, because it is viewed as a safe haven asset, especially when the crash is happening.

Since the stock market is at all time highs, we have advised our students to add Gold to their investment portfolio.

Gold has since rallied strongly, and will likely continue to outperform.

Gold as a Hedge Against Stock Declines

Gold as a Hedge Against Stock Declines 3


If you would like to avoid missing out on any of such awesome trades (which we deliver on a daily basis), then you should definitely check out our training program & trading signals bundle:
https://synapsetrading.com/the-synapse-program/

See you on the inside!

daily trading signals 1400220 2

With the Wuhan Coronavirus scare in the past 1-2 months, the stock markets have been cautiously bullish, but it somehow feels that the market is still in risk-off mode.

Currencies like the EUR have been weakening, whereas “safe haven” assets like USD, Gold and Bitcoin have been very bullish.

Here are some of the trade signals taken from our private “Synapse Network”, which we post daily for our members:


Weakness in the Euro (EUR)

Based on the currency strength meter, we can see that Gold and Bitcoin are the strongest, whereas EUR is the weakest.

Hence shorting EUR against the USD and against the CHF were very profitable trades for us.

daily-trading-signals daily-trading-signals1daily-trading-signals2


Strength in the US Dollar (USD)

We managed to identify early the breakout of USD against the Singapore dollar (SGD), giving us a very good early entry and the ability to hold (or even add!) onto the trade and ride profits confidently.

This lead to a windfall trade of 400+ profits just from this one trade!

daily-trading-signals4daily-trading-signals5


The Rise of Bitcoin (BTC/USD)

At the start of the year we identified the emerging strength of Bitcoin, and advised everyone to get in early before the real price movement starts.

At that time, price was only $8,000+, and since then, price has surged up to $10,000+, giving a minimal 20% ROI for this trade, and it’s just the start of the year!

daily-trading-signals6daily-trading-signals7daily-trading-signals8

If you would like to avoid missing out on any of such awesome trades (which we deliver on a daily basis), then you should definitely check out our training program & trading signals bundle:
https://synapsetrading.com/the-synapse-program/

See you on the inside!