For many who are new to trading or want to get started, it can be overwhelming to start your trading journey, due to the large amount of information out there on this topic.
As such, I have compiled this short guide to cover the key concepts and principles about trading and technical analysis, so that you will have a clear roadmap on how to get started on trading, and how to learn and progress in trading to become a better trader.
1. INTRODUCTION TO TRADING
1.1 What is Trading?
On a day to day basis, the price of every financial product moves up and down, for example you hear about stock prices moving up, or oil prices crashing, for different currencies appreciating or deprecating against one another.
At its core, trading is simply being able to make a profit from capturing these price moves.
If you buy a stock and it moves up, and you sell it at a higher price, you would have captured that price move and made a profit. Do this multiple times successfully, and you would be able to make a full-time living off it.
Of course, not every trade is going to be profitable, because sometimes you might get it wrong. But after making say 50-100 trades, if you are able to consistently make money, then it means you might have a winning trading system.
If you have ever been to a casino, you will know that over the long run you will lose money because the odds are against you. Although the casino’s edge is very small, over the long run and over a large number of transactions, it adds up to huge profits.
Trading is somewhat similar. If you can find an edge (through your analysis), exploit it over a large number of trades (money management), and can do it consistently without letting your emotions get in the way (mindset), then you will have a chance to become very successful in trading.
1.2 Trading vs. Investing
The first problem many people face is not knowing whether to use their money for investing or trading. Since they usually start off with a fixed sum of money, they have to decide on one or the other to start off.

Many people will small sums of money then make the common mistake of “playing it safe”, perhaps after hearing stories of Warren Buffett or about how “risky” trading is, and then decide to just put their money in things like bonds or ETFs, with a low return of 1-5% a year.
The problem with this approach is that unless you have a large amount of money to start with, you will take a whole lifetime just to build a decent-sized portfolio. For example, if you consistently grow your portfolio at a compounded rate of 3% every year with no losses, it would take you 24 years just to double your portfolio. And what happens if you get caught in a market crash?
[Video: Should I Start off with Trading or Investing?]
So if you are starting with a small sum of money, it definitely makes more sense to focus on trading at the start, which can give you 3-5% monthly cashflow, which you can then use to grow your long-term investment portfolio faster.
As a simple rule, I would suggest for you to focus on trading until you have at least $100,000 capital before you start looking to do investing.
And once you have hit that milestone, you can continue to do both trading and investing, because trading can provide monthly cashflow, while investing can provide long-term passive income, so they both complement each other.

If you are new to trading & investing, you can also check out this full list of common trading & investing terms, and consider bookmarking it so that you can use it for reference if you come across a new term or jargon which you are unfamiliar with.
1.3 What Products Should I Trade?
The next major decision you have to make as a trade is to decide what markets and what financial products to trade, since there are many options available.
The major financial markets are stocks, bonds, real estate, foreign exchange (forex), and more recently, cryptocurrencies.
Stocks, or shares, are basically ownership in a business/company, so when you buy a stock, you essentially own a small percentage of the company.
Bonds are loans that are made to businesses (corporate bonds) or to the government (government bonds), on which the lender is obliged to pay back the capital plus interest. As interest rates fluctuate, the prices of the bonds will also change.
Real estate, or property, can refer to the land or building, and it can generate revenue by collecting rent or by appreciating in value over time.
Forex, or currencies, refers to the exchange rate between 2 different currencies. If you think that one currency (eg. EUR) is going to appreciate against another currency (eg. USD), you can buy a contract of EUR/USD, which is essentially the same as selling USD to buy EUR. This is no different from what you do when you go to the money changer before you embark on your vacation overseas, albeit in much larger quantities.
Cryptocurrencies, or crypto for short, is a relatively new asset class which is meant to be a sort of global currency, but adoption is still not widespread, although it is growing steadily. From a market perspective, it is pretty much the same as foreign exchange, meaning you can trade it against normal currencies.
Financial products allow you to invest in the financial markets (those that we mentioned above), so you can directly take a position in those markets.
In addition to taking a direct position, there are also financial products that allow you to take an indirect position in the market. These products are pegged to prices of particular markets, and their prices are derived indirectly from these markets. Hence, they are known as derivatives, and some examples include forward contracts, futures contracts, CFDs, options.
Forwards (or forward contracts) are agreements between a buyer and seller to trade an asset at a future date. The price of the asset is set when the contract is drawn up. Forward contracts have one settlement date—they all settle at the end of the contract.
Futures (or futures contracts) are similar to forward contracts, except that they are traded on an exchange and are settled on a daily basis until the end of the contract. Forward contracts are used primarily by hedgers who want to cut down the volatility of an asset’s price, while futures are preferred by speculators who bet on where the price will move.
CFDs (or contract for difference) are a way to profit from price movements without owning the underlying asset.
Options grant you the right, but not the obligation to buy or sell an underlying asset at a set price on or before a certain date.
While it might seem confusing because there are too many choices, most new traders will start off with the easiest products like forex, stocks, or CFDs.
2. UNDERSTANDING THE MARKETS
2.1 The Only Two Things that Move Prices
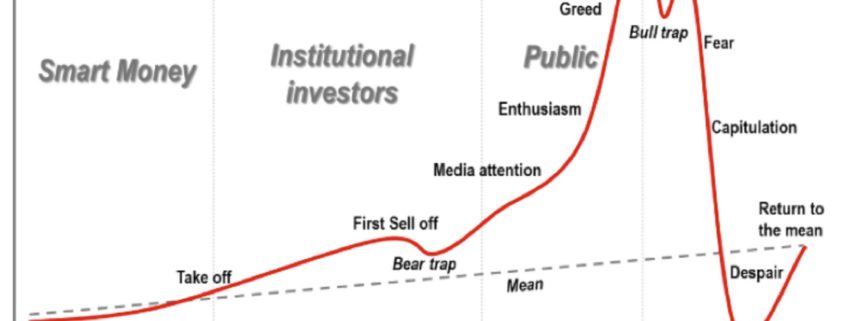
Despite all you read in the news, there are really only 2 things that move prices – supply & demand.
Supply refers to the sellers (bears) who are looking to sell (which pushes prices down), whereas demand refers to the buyers (bulls) who are looking to buy (which pushes prices up).
The constant battle between the buyers and sellers creates fluctuations in prices, which can be as short as a few seconds, or create trends which can last for years.

As a trader, finding the sweet spot where there is an imbalance in the forces (such a a huge build-up of buyers or sellers on either side) can give you an edge in the market, so that you can enter the market just as a big move is about to occur.
2.2 Basics of Technical Analysis
Technical analysis is the studying of charts (price, volume, etc) to understand the current supply and demand, which allows you to predict the future probabilities of whether prices will head up or down, thus giving you an edge to take calculated risks.

There are 2 main schools of thought – the classical approach vs. the statistical approach.
The classical approach came about before there were computers, when people manually plotted charts on graph paper, and drew lines (support, resistance, trendlines, channels) to identify behavioral patterns and price chart patterns. Even now, it is still widely popular.
The statistical approach uses data and mathematical formulas (indicators, algorithms) to find mathematical patterns and predict probabilities.
Personally, I find the current best approach is to use a combination of both. Just like in driving, you can rely on the autopilot to help you do calculations and provide useful input, but in certain scenarios it is better to manually take over.
2.3 Technical Analysis vs Fundamental Analysis
[Video: Technical Analysis vs. Fundamental Analysis]For many new traders, one of the most common question I get is regarding the method of analysis to use, and it usually boils down to technical analysis vs fundamental analysis.
Technical Analysis (TA) gives you a fast and simple way to scan through data, find good opportunities, and make a trading decision.
Fundamental Analysis (FA) helps you understand the big picture and why prices are moving in certain ways.

Personally, I find that the best approach is to combine them to get the best of both worlds.

3. THE 3 Ms OF TRADING

3.1 Methodology
The 3Ms of Trading are Methodology, Money Management, and Mindset, and they each play a crucial role in your success in trading.
Methodology refers to your method of analysis, your strategy, your setups, basically the basis on which you make your buying and selling decisions.
As we mentioned in the previous section, the most common tools used to make such decisions are technical analysis, fundamental analysis, or some combination of both.
3.2 Money Management
Money management, or risk management, refers to how well you use your trading capital, to maximize your returns, while at the same time minimizing your risk.
This includes your capital allocation per trade, such as the 2% money management rule, and also things like risk paramaters for each trade, such as maximum drawdown limits.
This means that for each trade, you will need to decide on the entry price (EP), stoploss price (SL), and target profit (TP) before you make each trade, so that you will be able to calculate the reward-to-risk (RR) ratio to decide whether it is worth taking the trade.

To be profitable in trading, all you need is a good balance between the win ratio (aka. hitrate) and the reward to risk ratio, to ensure that you have a net positive expectation on every trade.
For example, if you have a 40% win ratio, and your reward/risk ratio is 2, you will still end up net profitable in the long run.

3.3 Mindset
The mindset, or trading psychology, is definitely the most important aspect of trading, and it is also the hardest to master.
This will determine how well you can make good decisions under stress, and consistently execute your trading plan without getting swayed by emotions.
Thinking accurately requires a certain level of self-awareness, so that we can avoid any behavioral biases that skew our rational thinking and decision-making process.
4. HOW TO CREATE A TRADING PLAN
4.1 How Much Capital Do I Need to Start Trading?
[Video: How Much Capital Do I Need to Start Trading?]For new traders looking to start out their journey, what is the minimum amount of capital you will need to start trading?
What is the optimal amount of capital you should use to ensure that you take your trading seriously?

The answer to this question is quite simple – you should find an amount which is not so large that you cannot afford to lose, yet is not so small that you do not have any “skin in the game”.
And lastly, does it make sense to start out with demo trading?
4.2 Key Ingredients of a Winning Trading Plan
If you have ever tried starting a business, you will know that the first thing you will need is a business plan, which states out from A to Z your business idea, how you will go about executing the plan, and the ways to measure the performance, etc.
The same goes for a trading plan.
Before you start trading, you will need a comprehensive plan that covers:
- Your general strategy and approach
- Markets and products to trade
- Starting capital and allocation strategy
- Specific rules for entering and exiting a trade
- Trade parameters (entry price, stoploss, target profit)
- Risk parameters (risk per trade, open risk, monthly risk)
- Evaluation metrics (how to measure and improve performance)
- Trading psychology rules to keep your emotions in check
5. GENERAL RULES & MISTAKES TO AVOID
5.1 Do Not Rely Too Much on Indicators
One of the most common mistakes for new traders is to rely too much on indicators, and to end up using too many indicators.
Traders need to keep in mind that indicators are just mathematical formulas which help to calculate the probability of which way prices are heading, and they do provide a useful INDICATION, hence the name INDICATOR, but I find them less useful in providing absolute buying/selling rules.
Personally, I prefer to focus on price action analysis and classical analysis, while using indicators as an additional indication to aid in the core analysis.
In addition, while using indicators, it is important to know the formula and calculation of the indicator which you are using, so that you know the raw data inputs which go into the calculation.
This will help you avoid using multiple similar indicators which use the same data input (and thus end up providing false confirmation), and will allow you to know which situations your chosen indicators will work well or will not work well.
For example, lagging indicators are more useful for defining long-term trends, but are hopeless for tracking short-term momentum and reversals.
5.2 The Quest for the Holy Grail
Another big danger to new traders is the idea of the holy grail of trading.
The holy grail can appear in many forms – a “sure-win” indicators, a “100% win rate” trading system, a “legendary” guru, or a “unique proprietary” software guaranteed to make you rich overnight.
They all hold the same promise – to make you rich quickly with little effort.
Unfortunately, there is no shortcut to success, no magic bullet that will make you a super trader overnight.
It takes hard work and dedication if you want to enjoy the bountiful financial rewards. For me, it took about 7 years before I managed to make my first million from trading, and it took a lot of hard work.
So, my advice to new traders is to stop jumping from system to system, hoping to find the holy grail (which does not exist).
Instead, start learning as much as you can, then find a good system and work with it until you find success.
5.3 Dangerous Myths About Trading
If you listen frequently to the mainstream media, or take advice from friends and family who are not traders themselves, they might give some good-intentioned but ill-informed advice, which could harm your trading results.
Such dangerous myths about trading might seem to be “common knowledge” because they keep getting repeated frequently, but have you stopped to consider whether they are really true?
Here are some common myths:
- Trading is very risky because you can lose all your capital
- Forex is more risky than stocks
- Leverage increases your risk
- You need a lot of capital to start trading
- You need to trade very often if you want to make more money
- You need to monitor prices and charts 24/7
- Brokers are out to hunt your stoploss
Do these sound familiar?
5.4 Essential Trading Rules
To help you avoid the common pitfalls of trading, one of the best ways is to learn from the experience of professional traders, and set up some rules for yourself so that you do not make any blunders in the heat of the moment.
Based on my prior fund trading experience, I have compiled some of the best trading rules of professional traders which you can adapt for your own use.
These rules will help you control your emotions, manage your risk, manage your losing trades as well as your winning trades, avoid blowing up your account, etc.
In summary, trading might seem like a complex skill to learn, but if you break it down into its components, it is not a hard skill to master with some dedication and hard work, and the financial rewards are definitely worth it!
Good luck on your journey!
After trading for 18 years, reading 1500+ books, and mentoring 1000+ traders, I specialise in helping people improve their trading results, by using tested trading strategies, and making better decisions via decision science.


 Chart: S&P 500 index (weekly chart)
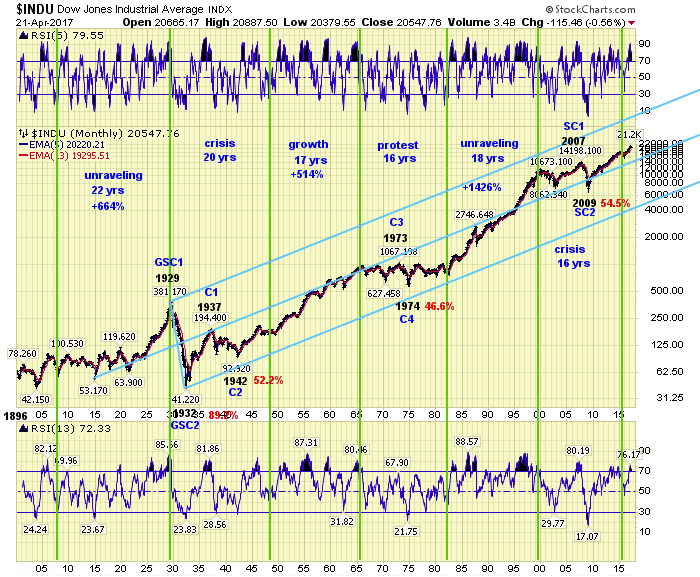 Source: The Market Oracle