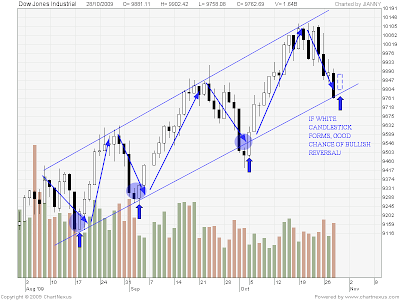
Remember, trading is not about calling every small turn, but rather having the patience to wait for the best setups, and positioning yourself such that the odds are in your favour. Good luck!

Today, I came across this call by CIMB:
Fraser & Neave Target Cut To S$6.84 From S$6.91
Currently, the price is now 5.28, and 6.84 represents quite a significant upside. Most likely, this value was derived from a valuation model, and not from the charts, because it doesn’t look too rosy on the charts, with a clear head and shoulders (H&S) reversal pattern. This is one of the most bearish reversals, and could last quite a while. Last week, a pullback to resistance offered an excellent shorting opportunity. I would avoid buying this stock, at least until this pattern is negated or has run its full course of decline.
Anchoring and adjustment is a psychological heuristic that influences the way people intuit probabilities. Traders exhibiting this bias are often influenced by their initial opinions, the initial trend, or arbitrary price levels such as their entry or target prices – and tend to cling to these numbers when making their buy/sell decisions.

This is especially true when the introduction of new information regarding the security further complicates the situation. Rational traders treat these new pieces of information objectively and do not reflect on purchase prices or target prices in deciding how to act.
Anchoring and adjustment bias, however, implies that investors perceive new information though an essentially warped lens. They place undue emphasis on statistically arbitrary, psychologically determined anchor points. Decision making therefore deviates from neoclassically prescribed “rational” norms.
For example, traders who are anchored to the initial trend are slow to catch on when the trend has reversed, especially if they are caught on the wrong side of it. This will lead to a reluctance to change their view and reverse their positions.
How will this affect your trading?
Traders who are anchored to price levels, such as their entry price, will refuse to cut their losses until prices go back to the entry price which they have anchored to. Traders may also refuse to take profit at a less desirable price because they missed the chance to take profit at a more favourable price, and they have now anchored to that price and refuse to settle for less.
The key to overcoming this bias is to be flexible and objective, being able to evaluate prices and make decisions objectively, whether you are in, out, up or down.
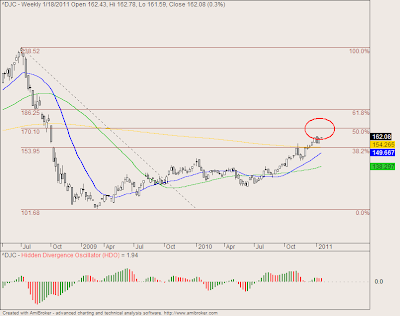
Both the CRB and the DJC commodity indices are near the crucial 50% retracement level, which will act as strong resistance. Prices will definitely not sail right past this level, hence there will have to be some sort of reaction, for example like a pullback or consolidation, or even a correction. This could act as a drag on commodity stocks in the coming weeks. This once again highlights the importance of tracking the various global markets, even when your main market is the Singapore market. Stay tuned!
Every trader knows that using multiple timeframes can provide different perspectives on the market, and provide key information on the lead-lag relationship.
Small timeframes lead larger ones, and larger ones drive the smaller ones. Understanding the inter-play is crucial.
Since trends exist on different timeframes, it makes sense to analyse at least two timeframes.
For example, if one’s main timeframe is the daily chart, one can consult the weekly chart to see the big picture.
This allows investors to analyze a particular trend against the perspective of the next higher timeframe.
If one is using swing counts, a lower/higher high/low in the weekly and monthly charts can provide perspectives not seen in daily charts.
Long-term trendlines may be clearer, and more obvious/easily visible.
Certain price patterns are more visible on long-term charts (key reversals, triangles on weekly), as well as long -term support and resistance levels.
A trend change signal on the short-term (daily) may only be a retracement in the long-term (weekly) chart.
On the other hand, a trend change signal in the long-term chart may be a substantial move in the short-term even though a short-term move may seem overdone.
Hence, an overdone breakout on the short-term trend may actually be the start of a major breakout if the long-term chart is still on an uptrend.
Divergence signals are also more obvious when timeframe is compressed, for example a price-volume divergence is more obvious on the weekly compared to the daily.
Divergences on the larger timeframes also point to larger moves, and could herald major reversals.

The Dual Timeframe Technique
This involves using 2 different timeframes to trade, one to provide the roadmap and the other to time the precise entries and exits.
Strategic Timeframe: This timeframe acts as a roadmap for the execution timeframe, giving you an idea of longer-term trends, hence providing you strategic direction on how to select your setups and manage your trades.
Execution Timeframe: This is your main timeframe for trading, and will be what you are looking at as you decide on your stoploss, entries, and exits. The focus is on precision and timing, so this timeframe is like zooming in from your strategic timeframe.
For example, for my strategies, I use:
- Strategic Timeframe: Weekly chart
- Execution Timeframe: Daily chart
- Expected holding period: Can last for a few days to a few weeks (if the trend is strong)
If you are doing intraday trading, then your strategic timeframe might be the daily chart, while your execution timeframe might be the 5-minute or 15-minute chart.
In conclusion, using multiple timeframes allows one to better identify trends, and more precisely pinpoint entries and exits by zooming in and zooming out from the initial point of reference.
This also allows one to better manage risk in line with one’s time horizon and investment timeframe.

If you would like to learn how to get started in trading, also check out: “The Beginner’s Guide to Trading & Technical Analysis”
Latest Blog Posts
 A Deeper Look at the US-China Trade War & Possible SolutionsApril 18, 2025 - 10:49 pm
 Best Assets to Invest in Under President Donald TrumpNovember 10, 2024 - 10:55 pm
 The 2024 U.S. Presidential Election: What to Buy if Donald Trump or Kamala Harris Wins?November 2, 2024 - 12:38 am
Contact Us
Synapse Trading Pte Ltd
Registration No. 201316168H
FB Messenger: synapsetrading
Telegram: @iamrecneps
Email: info@synapsetrading.com
Disclaimer
Privacy policy
Terms & Conditions
Contact us (main)
Partnerships


