Most people think that trading is like gambling and staring at the screen the whole day hoping for a quick punt or a sudden windfall from penny stocks. This cannot be further from the truth.
After speaking to many successful traders, we secretly confide to one another how boring trading really is, and we have to find ways to kill time, such as taking up hobbies or by teaching others.
The truth is that once you learn to read the charts and use simple setups, it is not hard to profit consistently from the markets, and once you make an entry, all you need to do is switch off your screen and wait for the trade to play out, and you can carry on working, travelling, or go to sleep.
Here are some ways you can trade while working, travelling, or sleeping:
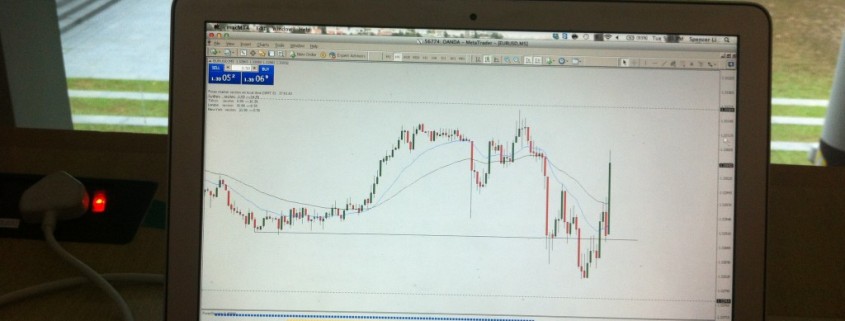
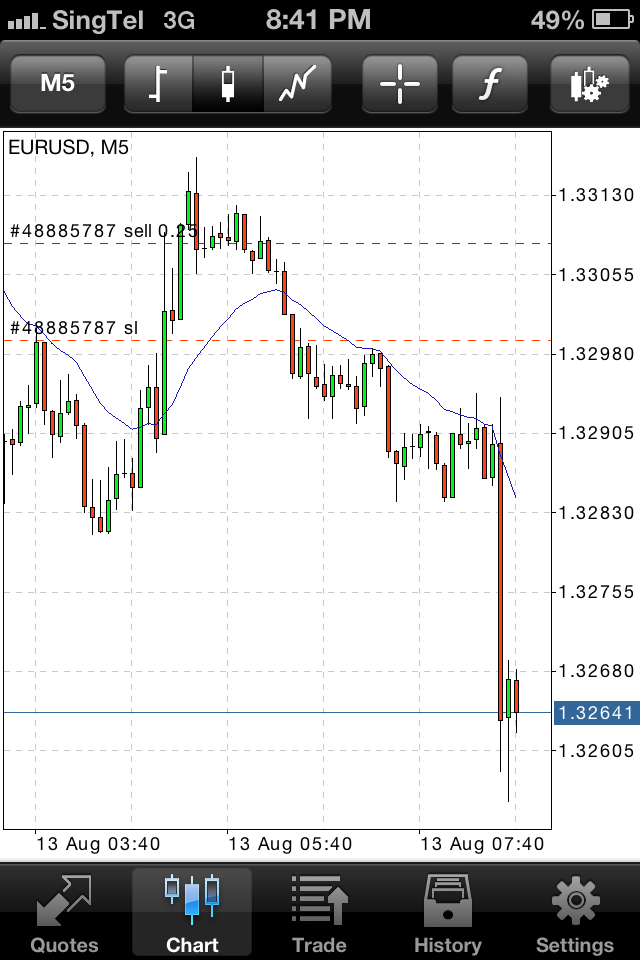
- Using technology like your mobile phones, iPads, laptops, etc
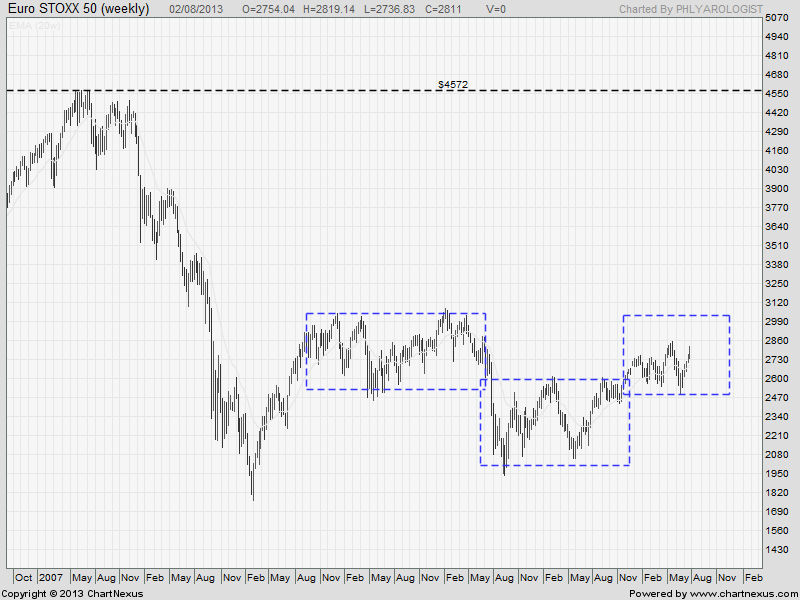
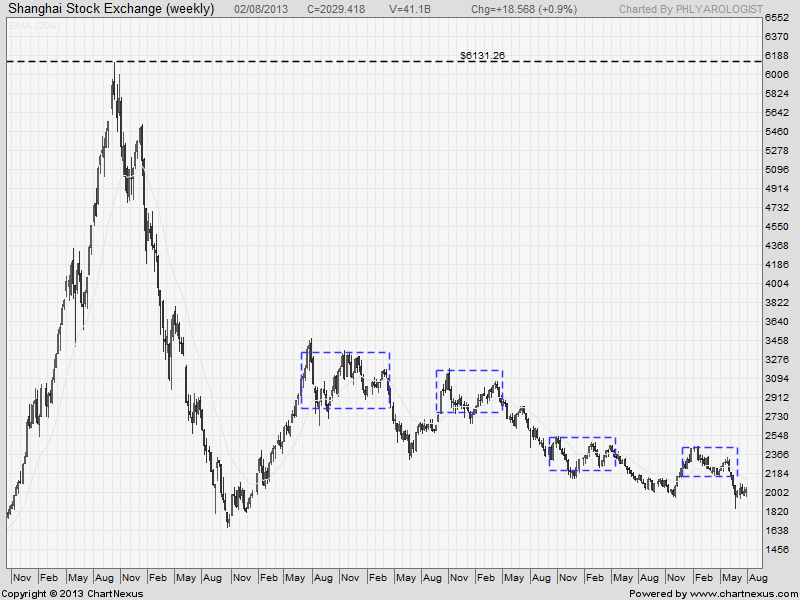
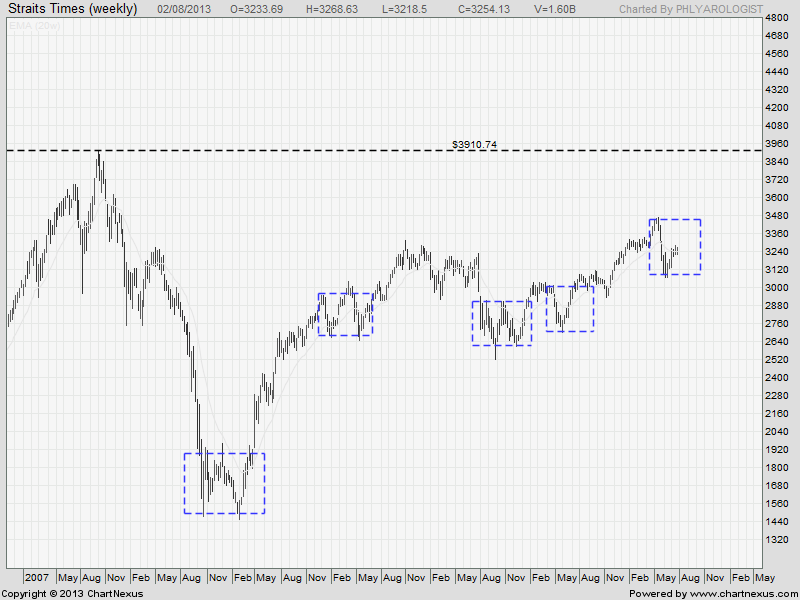
https://synapsetrading.com/audusd-82-pips-profit-from-poolside-trading/ - A simple and fast technique for analysis (perfect for busy people)
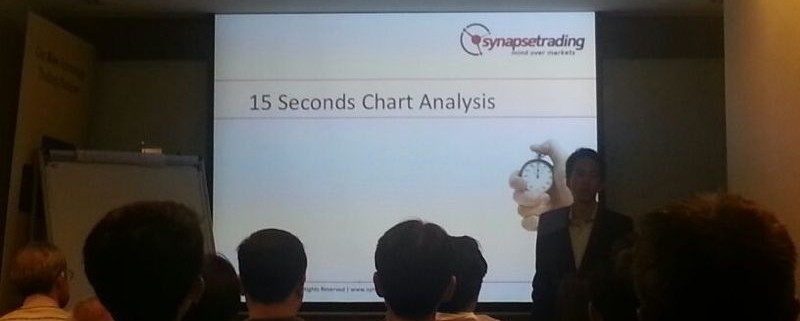
https://synapsetrading.com/15-seconds-chart-analysis-1268-in-2-simple-trades/ - Versatile strategies – Choice of forex trading or stocks investing
https://synapsetrading.com/vard-holdings-historical-lows/
There is still a lot more to share, which I will be doing in my next free trading workshop next Thursday, including what trading strategies to use, and our recent blockbuster trades, such as Vard Holdings, and the new 35 Pips Daily Forex Challenge. If you are interested to trade part time or full time, this might just be what you have been looking for!