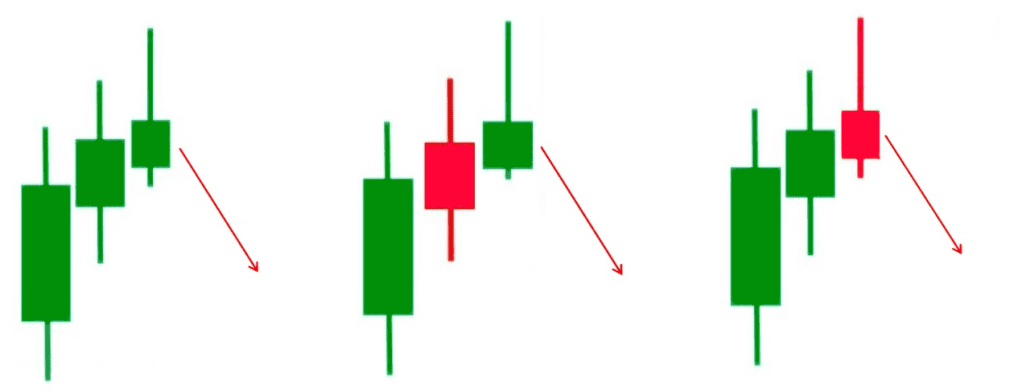
Definition

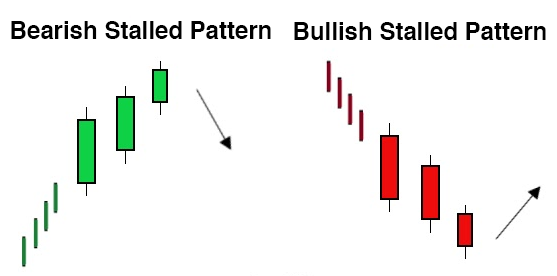
A dumpling top is a candlestick pattern comprised of several Japanese candlesticks.

The first candlesticks in this pattern are bullish or bearish with small bodies, forming a rounded top.

The pattern is completed when a final candlestick forms with a bearish gap opening.

This pattern is the opposite of the frying pan bottom.


Dumpling top

Characteristic

A dumpling top often forms after a significant upward movement characterized by several large green Japanese candlesticks.

Significance

The dumpling top is a reversal pattern that signals a potential reversal of a bullish trend into a bearish trend.

This pattern reflects a gradual exhaustion of buyers before the sellers regain control forcefully.

Note

The dumpling top is considered a major pattern in Japanese candlestick analysis and is a powerful structure.

However, it is crucial not to anticipate its formation and to wait for the bearish gap to confirm the pattern.

Invalidation

If the bearish gap is filled on the last candlestick, the dumpling top structure is invalidated.

Concluding Thoughts

The dumpling top is a significant reversal pattern in Japanese candlestick analysis, indicating a potential shift from bullish to bearish sentiment.

Traders should be cautious and avoid anticipating its formation, instead waiting for the bearish gap to confirm the pattern.

If the gap is filled, the pattern is invalidated, underscoring the importance of confirmation in trading decisions.

A bearish belt hold is a candlestick pattern that forms during an upward trend.

This pattern occurs when, following a series of bullish trades, a bearish or black candlestick appears.

The opening price, which becomes the high for the day, is higher than the close of the previous day.

The stock price then declines throughout the day, resulting in a long black candlestick with a short lower shadow and no upper shadow.

Bearish Belt Hold Explained

The bearish belt hold often signals a reversal in investor sentiment from bullish to bearish.

However, this pattern is not considered highly reliable because it occurs frequently and is often incorrect in predicting future share prices.

When using this pattern, it is essential to consider more than just two days of trading to make accurate predictions about trends.

Understanding a Bearish Belt Hold

Bearish belt holds are relatively easy to spot but must be confirmed by looking at periods that extend beyond the day period.

Candlesticks from previous days should be in a clear uptrend to confirm that sentiment has changed.

To enhance the validity of the signal, the bearish belt hold candlestick should be long, and the next session’s candlestick should also be bearish.

Concluding Thoughts

The bearish belt hold pattern can be a useful indicator of a potential reversal in an upward trend, signaling a shift from bullish to bearish sentiment.

However, due to its frequent occurrence and potential for false signals, it is important to confirm this pattern with additional analysis and not rely on it in isolation.

Considering the broader market context and using other technical indicators can help improve the reliability of trading decisions based on this pattern.

A bullish belt hold is a single-day Japanese candlestick pattern that suggests a possible reversal of the prevailing downtrend.

The pattern forms when, following a stretch of bearish trades, a bullish or white candlestick occurs.

The opening price, which becomes the low for the day, is lower than the close of the previous day.

The stock price then rises throughout the day, resulting in a long white candlestick with a short upper shadow and no lower shadow.

It can be contrasted with a bearish belt hold.

Understanding a Bullish Belt Hold

The bullish belt hold pattern is similar in appearance to a white Marubozu, opening at the low of the period and subsequently rallying to close near its high, leaving a small shadow at the top of the candle.

The pattern surfaces after a stretch of bearish candlesticks in a downtrend.

The candle’s opening price is significantly lower than the previous day’s low.

The pattern closes well into the body of the previous candle, holding the price from falling further, hence the name “belt hold.”

The bullish belt hold often signals a shift in investor sentiment from bearish to bullish.

This candlestick pattern occurs frequently and shows mixed results in predicting a security’s future price.

The potency of the candlestick is enhanced if it forms near a support level, such as a trend line, a moving average, or at market pivot points.

Trading the Bullish Belt Hold

Like most Japanese candlestick patterns, traders should not trade the bullish belt hold in isolation.

Using other technical indicators and price patterns greatly increases the probability of a valid signal.

The bullish belt hold is not considered very reliable as it is often incorrect in predicting future share prices.

On occasions, the bullish belt hold can be a mere pause in the overall downtrend, so traders should wait for the price to confirm the pattern.

An entry should only be taken when the price trades above the high of the belt hold candlestick.

Conservative traders may want to wait for a close above the high of the pattern.

If the bullish belt hold candlestick is long, traders could place a stop-loss order at its midpoint.

Alternatively, traders could set a stop below the pattern.

Although this requires a wider stop, there is less chance of market noise interfering with the trade.

Bullish Belt Hold vs. Bearish Belt Hold

The bullish belt hold and the bearish belt hold are both single candlestick patterns found in technical analysis.

The key difference between them lies in their implications for future price movement.

The bullish belt hold pattern occurs during a downtrend when there is a significant gap down at the open followed by a long bullish candlestick that opens near the low of the day and closes near the high.

On the other hand, the bearish belt hold pattern occurs during an uptrend when there is a significant gap up at the open followed by a long bearish candlestick that opens near the high of the day and closes near the low.

The bullish belt hold reflects a shift from bearish sentiment to bullish market sentiment as buyers aggressively enter the market to drive prices higher.

The bearish belt hold reflects a shift from bullish sentiment to bearish sentiment.

Strengths of the Bullish Belt Hold Pattern

Trading the bullish belt hold pattern offers several advantages.

This list is not exhaustive, but some of the strengths of the pattern include:

  • Clear Signal of Reversal: The bullish belt hold pattern provides a clear and visually recognizable signal of a potential reversal in a downtrend.
  • Strong Bullish Momentum: The long bullish candlestick in the bullish belt hold pattern signifies strong buying pressure and bullish momentum.
  • Validation from Support Levels: Bullish belt hold patterns often form near key support levels, reinforcing the likelihood of a trend reversal.
  • Defined Risk-Reward Ratio: Trading the bullish belt hold pattern allows traders to establish clear stop-loss levels based on the low of the bullish candlestick.
  • Versatility across Timeframes: The bullish belt hold pattern can be identified on various timeframes, from intraday charts to daily and weekly charts.

Alternatives to Bullish Belt Holds

Traders have various alternatives to using the bullish belt hold pattern.

Some of the more common alternatives include:

  • Other Candlestick Patterns: Explore other candlestick patterns such as the hammer, engulfing patterns, morning star, and evening star patterns.
  • Technical Indicators: Use technical indicators like moving averages, RSI, stochastic oscillator, MACD, and Bollinger Bands to identify potential trend reversals.
  • Support and Resistance Levels: Analyze support and resistance levels on price charts to identify potential areas where buying or selling pressure may emerge.
  • Price Patterns: Look for chart patterns beyond candlestick patterns, such as triangles, flags, pennants, and head and shoulders patterns.

Bullish Belt Holds and Volatility

Market volatility can significantly impact the effectiveness of bullish belt holds.

Higher levels of volatility can increase the frequency of price fluctuations and erratic movements, making it more challenging to accurately interpret the pattern.

In highly volatile markets, price gaps are more common.

In such conditions, it becomes even more important to get confirmation from other technical indicators.

Concluding Thoughts

The bullish belt hold is a useful candlestick pattern for identifying potential reversals in downtrends.

However, it should not be used in isolation.

The counterattack lines pattern is a two-candle reversal pattern observed on candlestick charts.

This pattern can emerge during either an uptrend or a downtrend.

In the case of a bullish reversal during a downtrend, the first candle is a long black (down) candle, followed by a second candle that gaps down but then closes higher, near the close of the first candle.

This pattern indicates that while sellers were initially in control, they might be losing that control as buyers manage to close the gap down.

For a bearish reversal during an uptrend, the first candle is a long white (up) candle.

The second candle gaps higher but then closes lower, near the close of the first candle.

Understanding Counterattack Lines

The counterattack lines pattern shows that buyers might be losing control during an uptrend or that sellers might be losing control in a downtrend.

Bullish Counterattack Lines:

  • The market is in a downtrend.
  • The first candle is black (down) with a long real body.
  • The second candle gaps down on the open, is white with a real body similar in size to the first candle, and closes near the first candle’s close.

Bearish Counterattack Lines:

  • The market is in an uptrend.
  • The first candle is white (up) with a long real body.
  • The second candle gaps higher on the open, is black with a real body similar in size to the first candle, and closes near the first candle’s close.

The pattern typically signals that the initial trend may be unsustainable, leading to a potential reversal in the opposite direction of the initial trend.

Example of How to Use Counterattack Lines

Counterattack lines are most effective when used alongside other forms of technical analysis, as they do not always result in a trend reversal.

In the case of Apple Inc. (AAPL), a bullish counterattack line appeared during a downtrend.

While the strong buying on the second candle suggested a potential reversal, the price moved only slightly higher before continuing its downward trend.

However, in subsequent examples, the price did move higher following the pattern, confirming the bullish reversal.

Counterattack Lines vs. Engulfing Pattern

Both counterattack lines and engulfing patterns involve candles of opposite colors or directions.

However, in the engulfing pattern, the second candle’s real body fully envelops the real body of the first candle, whereas in counterattack lines, the candles are not required to overlap fully.

Limitations of Using Counterattack Lines

Counterattack lines may not be reliable on their own and typically require confirmation candles.

They are best used in conjunction with other technical analysis methods.

Additionally, candlestick patterns like counterattack lines do not provide profit targets, leaving the potential size of the reversal unknown.

The pattern may signal a long-term reversal or a short-lived one, and its infrequency means that opportunities to use it are limited.

Concluding Thoughts

Counterattack lines are useful for identifying potential reversals in market trends but should not be relied upon in isolation.

Their effectiveness increases when combined with other technical indicators and confirmation candles.

Traders should be mindful of the pattern’s limitations, including the lack of profit targets and its relatively rare occurrence.

The upside gap two crows pattern is a three-day candlestick chart formation that signals an upward price move may be losing momentum and could reverse lower.

Due to the specific sequence of candles required, this pattern is relatively uncommon.

Understanding the Upside Gap Two Crows Pattern

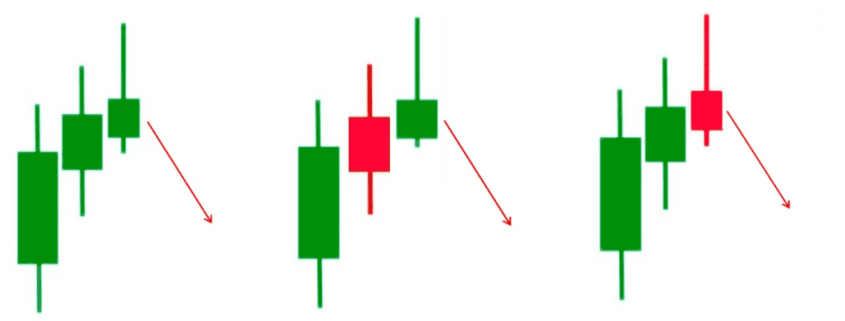
The upside gap two crows is a bearish reversal pattern observed in technical analysis. It is formed during an uptrend and involves the following sequence:

  1. Candle 1: A bullish candle that continues the uptrend, represented by a long white (or green) candlestick indicating a closing price well above the open price.
  2. Candle 2: A bearish candle that opens higher (gaps up) but closes lower, marking the beginning of a potential shift in market sentiment. The second candle should gap above the first candle and be smaller in size, indicating a struggle to maintain the bullish momentum.
  3. Candle 3: Another bearish candle that opens higher than the second candle but closes lower, engulfing the second candle’s body. However, this candle must still close above the first day’s close.

The pattern suggests that the security may be nearing the end of its upward move and that a downtrend could be on the horizon.

The inability of the bulls to maintain upward momentum despite two strong opens indicates a potential shift from bullish to bearish sentiment.

Trading the Upside Gap Two Crows Pattern

Traders often look for confirmation before acting on the upside gap two crows pattern.

This involves waiting for the price to drop below the low of the third candle before taking action, such as exiting a long position or initiating a short position.

For those who wish to act without confirmation, they might short or sell near the close of the third candle, placing a stop loss above the high of the third candle to manage risk.

Example of the Upside Gap Two Crows Pattern

Consider the daily chart of Apple Inc. (AAPL), which shows an upside gap two crows pattern.

The price had been rising for three weeks, followed by a strong green candle, a gap higher with a down candle, and then a third down candle that engulfs the previous one.

Traders could have used this pattern as a signal to exit long positions or to initiate short positions, either near the close of the third candle or after waiting for further confirmation.

Differences Between the Upside Gap Two Crows and Three Black Crows Patterns

While both patterns signal a possible reversal of an uptrend, they differ in their formation.

The three black crows pattern consists of three long bearish candles following an uptrend, indicating that the bears have taken over and are pushing the price lower.

The upside gap two crows, on the other hand, involves a gap higher followed by two bearish candles, with the second candle engulfing the first.

Limitations of the Upside Gap Two Crows Pattern

The upside gap two crows pattern does not provide information on how far the price may fall after the pattern forms.

Additionally, the pattern does not always result in a reversal; the price could move sideways or even continue higher.

Therefore, traders should use this pattern in conjunction with other technical analysis tools to identify potential exit points and assess the strength of the trend reversal.

Concluding Thoughts

The upside gap two crows pattern is a bearish reversal indicator that can signal a potential end to an uptrend.

While it provides valuable insight into a possible shift in market sentiment, it should not be relied upon in isolation.

Traders are advised to look for confirmation and use additional technical analysis tools to enhance the reliability of the pattern and make informed trading decisions.