

For subscribers of our “Daily Trading Signals”, we now also include a “Weekly Market Report”, where we provide a weekly deep-dive on the market, including fundamentals, technicals, economics, and portfolio management:
Click here for last week’s market report (28 August 2023)
Click here to subscribe for the latest market report (04 September 2023)
Click here to see the archives of all our past market reports
Market Recap & Upcoming Week
Last week was filled with pivotal financial events, with key remarks and strategic decisions driving markets across the globe. At the heart of the discussions was the Federal Reserve’s cautious stance on rates. Chair Jerome Powell, during his speech at both Jackson Hole and the Kansas City Fed’s annual symposium, highlighted concerns over persistent inflation, suggesting that high interest rates might continue.
On the jobs front, the US Bureau of Labor Statistics (BLS) announced on Friday that the US Nonfarm Payrolls (NFP) saw an increase of 187,000 in August, surpassing the anticipated market forecast of 170,000.
While the stock markets showed resilience by recording gains in major indices like the S&P 500, Dow Jones, and Nasdaq, the financial community remains divided on the Fed’s future actions. Speculations have pushed short-term Treasury yields slightly higher, and all eyes are set on upcoming inflation and job data.
UBS made headlines with its record $29 billion net profit following the acquisition of Credit Suisse, solidifying its stature in global wealth management. The successful integration and optimistic future projections indicate a prosperous path ahead for UBS.
In international updates, China took decisive steps to boost its capital markets. The government’s announcement of a tax cut on trading was met with positivity, as evidenced by the notable jump in the CSI 300 Index and Hong Kong’s Hang Seng Index. This move comes at a crucial time, given China’s faltering economy and recent challenges in the stock market.
As we approach the upcoming week, investors should keep a vigilant eye on the housing and energy sectors. Do take note that it will be a slightly shorter trading week, as U.S. equity markets remain closed for Labor Day.
PMI surveys from S&P Global and the ISM, coupled with the Fed’s Beige Book and China’s inflation data, will provide crucial insights into global economic health. Furthermore, earnings reports from Gamestop, American Eagle Outfitters, and Kroger are set to roll out, potentially setting the tone for retail sector dynamics in the latter part of the year.
Daily Trading Signals (Highlights)
We cover 3 main markets with a total of 200+ counters, so we will never run out of trading opportunities:
- Forex, CFDs, commodities, bonds
- US stocks, ETFs, global stock indices
- Cryptocurrencies, crypto indices
By covering a broad range of markets, we can focus our attention (and capital) on whichever market currently gives the best returns.
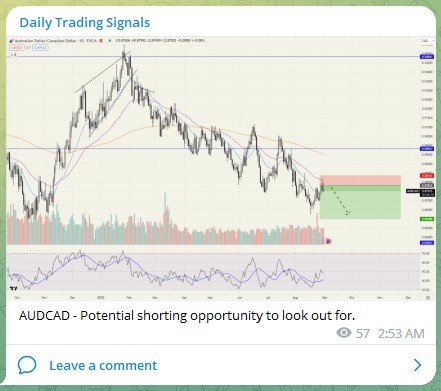
AUDCAD – Potential shorting opportunity to look out for.
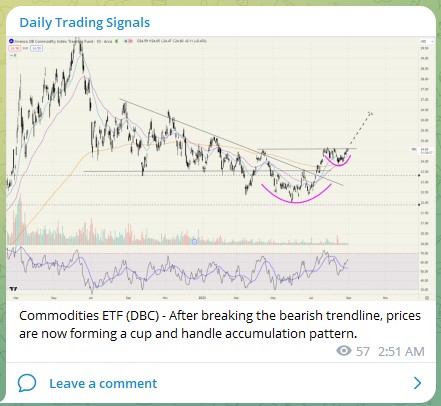
Commodities ETF (DBC) – After breaking the bearish trendline, prices are now forming a cup and handle accumulation pattern.
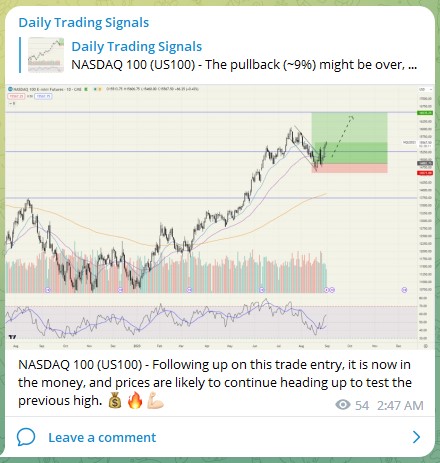
NASDAQ 100 (US100) – Following up on this trade entry, it is now in the money, and prices are likely to continue heading up to test the previous high. 💰🔥💪🏻
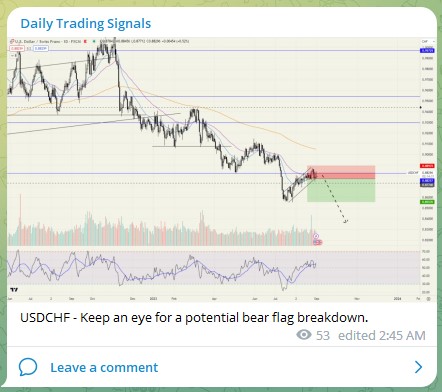
USDCHF – Keep an eye for a potential bear flag breakdown.
Subscribe for real-time alerts and weekly reports:
👉🏻 https://synapsetrading.com/daily-trading-signals
