• Link to Facebook
  • Link to X
  • Link to Instagram
  • Link to Youtube
  • Link to LinkedIn
  • Link to Mail
Free PDF: The 15-Minute Swing Trader's Checklist, the daily routine on the record since 2014
Synapse Trading
  • Mentoring
    • Trading Mastery Program
    • All mentoring options
  • Signals
    • Daily trading signals
    • Signals trade log
  • Results
    • Student results and testimonials
    • Public trade log, losses left in
  • Free guides
    • Start here
    • Trading foundations
    • Technical analysis
    • Strategies and systems
    • Risk and money
    • Trading psychology
    • Markets and products
    • Free trading guides
    • Tools and resources
    • Blog
  • About
    • My background
    • My trading journey
    • Media and interviews
    • Travel log
  • Contact
    • Contact me
    • Partnerships
  • Start free
  • Click to open the search input field Click to open the search input field Search
  • Menu Menu
Spencer Li

The Little Book That Beats the Market Summary: Joel Greenblatt’s Magic Formula

Trading Foundations
Greenblatt's magic formula - book summary

Two numbers, one ranking, and a holding rule that most readers break

Published: 17 October 2026 · Last updated: 17 October 2026 · By Spencer Li, CFTe


What is The Little Book That Beats the Market about? Joel Greenblatt’s book teaches one idea: buy good companies at bargain prices, and keep doing it for years. He turns that idea into a simple ranking he calls the magic formula. It scores companies on 2 numbers, how much profit the business earns on the capital it uses, and how cheap the company is next to those profits.

In his test from 1988 to 2004, a portfolio of about 30 top-ranked stocks returned about 30.8% a year, against about 12.3% for the market average. But the book’s most useful chapter is about the bad years. The formula trailed the market in about 1 year out of every 4, and the book warns how hard it is to keep going through those stretches.

This summary covers the first edition, published in 2006. A revised edition, The Little Book That Still Beats the Market, came out later.
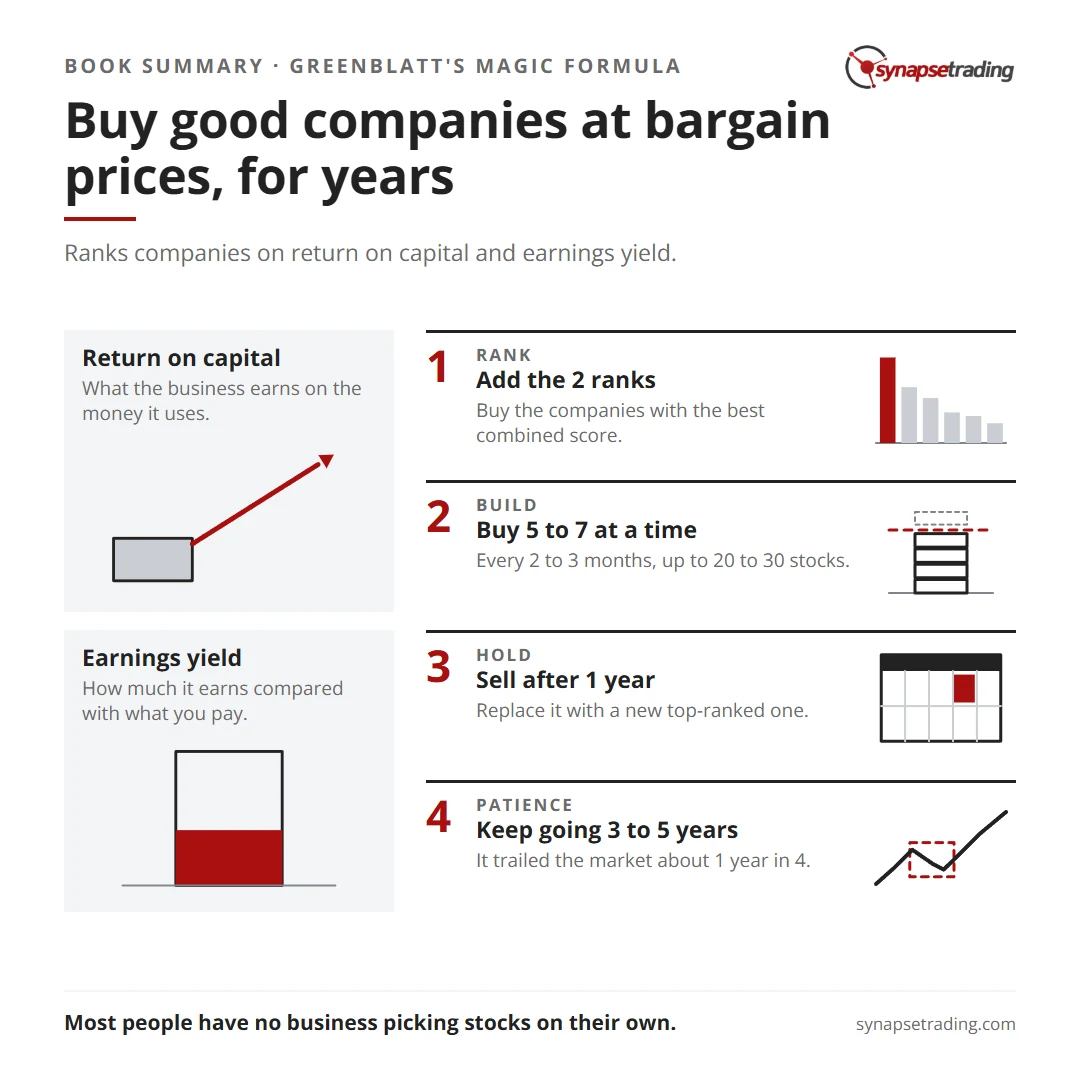
Buy good companies at bargain prices, for years. Summary card for the post: The Little Book That Beats the Market Summary: Joel Greenblatt's Magic Formula.

Who is Joel Greenblatt?

Greenblatt is a professional investor and a teacher. The book’s introduction describes “more than 25 years of investing professionally” and “9 years of teaching at an Ivy League business school.”

The book began, in his words, as a gift to “each of my five children.” It opens with a sixth grader who sells chewing gum at school, and asks how much half of that little business would be worth to a buyer who wants a fair return. The rest of the book builds from there, in plain language, for a reader who has never valued a business before.

What are the 2 numbers in the magic formula?

The formula has 2 numbers, plus a holding rule that makes them work.

Return on capital. This asks how much the business earns on the money tied up in running it. Greenblatt measures it as operating profit (EBIT) divided by net working capital plus net fixed assets. A business that earns a lot on a little capital tends to be a good business. It often has something competitors cannot easily copy.

Earnings yield. This asks how much the business earns compared with what you pay for all of it. Greenblatt uses operating profit divided by enterprise value, which counts the company’s debt as well as its shares. A high earnings yield means you are paying a low price for those profits.

The method is a ranking. He takes a list of the largest 3,500 companies, ranks each one on both numbers, adds the 2 ranks together, and buys the companies with the best combined score. So a company that is very good but expensive, or very cheap but poor, falls down the list.

Do note why he bothers with both numbers. A cheap company with a poor business can stay cheap for a reason. A great company at a high price can still be a poor investment. The formula looks for the overlap.
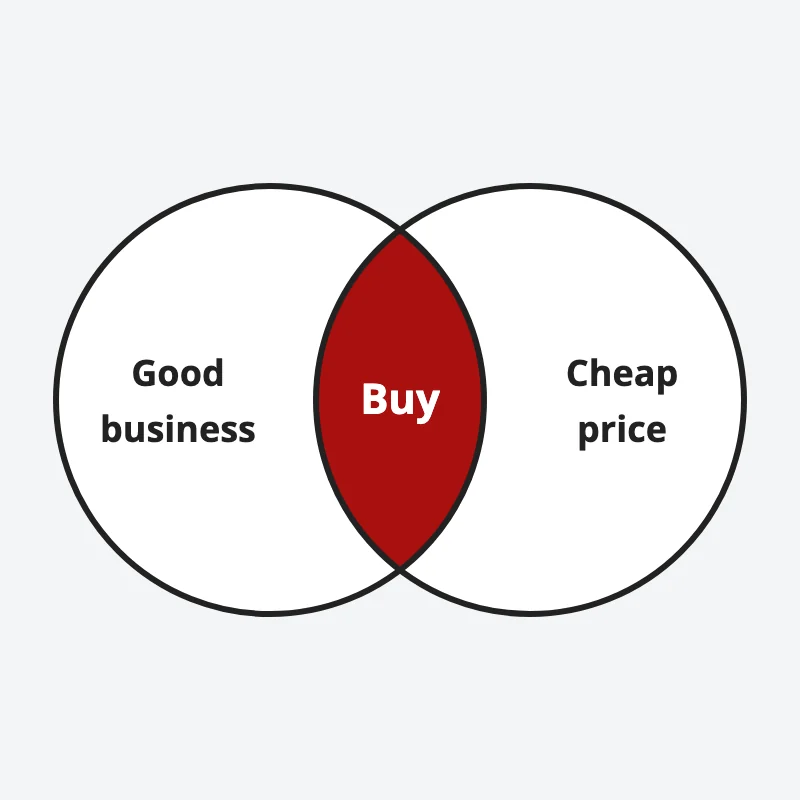
Two overlapping circles, good business and cheap price; the magic formula buys only where they overlap
The magic formula buys only good businesses that also trade at cheap prices.

What did the backtest show?

Here are the headline results the book reports, for 1988 to 2004.

MeasureMagic formulaMarket averageS&P 500
Average yearly return, 1988 to 200430.8%12.3%12.4%
2002, the worst year for the formula−4.0%−24.2%−22.1%
20007.9%−16.8%−9.1%
19901.7%−16.1%−3.1%

The book’s “market average” is an equally weighted index of the same 3,500 stocks, so each stock counts the same. The S&P 500 counts large companies more heavily.

He also split all the stocks into 10 groups by their magic formula rank. The top group returned 17.9% a year and the bottom group 2.5%, with the returns falling almost step by step in between. For a ranking method, that order matters more than the headline number. It suggests the 2 measures carry real information, beyond a lucky top 30.

Do note this is a backtest. The author ran it on past data before the book came out, so returns after publication are a separate question, and the book itself spends a full chapter warning how uneven the ride can be.

If you want a short daily routine that keeps your own investing decisions planned and repeatable, our free 15-Minute Swing Trader’s Checklist covers it. Get the free checklist →

Why do most people fail with the magic formula?

This chapter is the reason to read the book. Greenblatt is blunt about how often the formula looked broken, even in his own winning test period.

In his words, the formula “fared poorly relative to the market averages in 5 out of every 12 months tested.” On a full-year basis, it “failed to beat the market averages once every four years.” For “one out of every six periods tested,” it lagged for more than 2 years in a row. And over any 3-year stretch, it “beat the market averages 95 percent of the time (160 out of 169 three-year periods tested).”

So the formula worked over 3 years. Over 1, it often failed. That is exactly the pattern that makes people give up. A year of trailing the market feels like proof that the method has stopped working.

A trader asked on an investing forum in 2019: “Has Greenblatt’s magic formula stopped working?” The book’s own figures suggest why that question keeps coming up, because by its own count the formula trailed the market in about 1 full year out of every 4, even within the test period the book reports.

That is why the holding rule matters as much as the 2 numbers. His step-by-step plan asks you to “be committed to continuing this process for a minimum of three to five years, regardless of results.”

The same idea applies to any method with an edge. A short run of results tells you very little. Our post on the law of large numbers in trading explains why.

How does Greenblatt say to use the formula?

His plan, in short:

  1. Buy 5 to 7 top-ranked companies, using only 20% to 33% of the money for the first year.
  2. Repeat every 2 to 3 months, until you hold 20 to 30 stocks after about 9 or 10 months.
  3. Sell each stock after holding it for 1 year, and replace it with a new top-ranked one.
  4. Keep going for at least 3 to 5 years.

For readers using their own stock screener, he offers a stand-in: a minimum return on assets of 25%, then the lowest price-to-earnings ratios from that group. He also says to exclude utilities and financial stocks.

Should you pick stocks with the formula at all?

Here the book takes a turn many readers do not expect. Chapter 10’s summary opens: “Most people have no business investing in individual stocks on their own!” Point 2 reads, “Reread summary point number 1.”

His reason is that valuing a business well is hard. If you cannot estimate a company’s normal earnings several years ahead, a mechanical formula or a broad index is the safer path. Readers who want the index route can start with our guide on how to choose an index ETF from Singapore.

For the value-investing ideas that sit underneath the formula, our summary of The Intelligent Investor covers Mr. Market and the margin of safety. And for the case for owning the whole market at low cost, see our summary of The Little Book of Common Sense Investing.

Concluding thoughts

The Little Book That Beats the Market is short, and the method fits on a page. The hard part is the patience. The book is honest that the formula spent long stretches looking wrong, even in its best test.

More books worth your time are in our list of the best investing and trading books.

So here is the book’s real test. Could you stick with a method that trailed the market for 2 years in a row?

FAQ

What is the magic formula in The Little Book That Beats the Market?

It ranks the largest companies on 2 measures, return on capital and earnings yield, then buys the ones with the best combined rank. The aim is good businesses at bargain prices.

Does the magic formula still work?

The book’s test covered 1988 to 2004 and was run before publication. The book itself warns the formula can trail the market for 1 to 3 years at a time, so short periods tell you little either way.

How many stocks does the magic formula hold?

The book suggests building up to 20 to 30 stocks, buying 5 to 7 at a time every 2 to 3 months, and holding each for about 1 year.

What is the difference between the 2 editions of the book?

The original came out in 2006. A revised edition, The Little Book That Still Beats the Market, followed. This summary is based on the original text.

Is The Little Book That Beats the Market good for beginners?

Yes. It was written for readers with no background in finance, and it explains return on capital and earnings yield with simple examples.

Go deeper

Any method with an edge needs a routine you can follow through the bad stretches. The free 15-Minute Swing Trader’s Checklist has the daily routine, the questions to ask before every trade, and the five rules that protect your account.


About the author. Spencer Li is The 15-Minute Trader and the founder of Synapse Trading. He is a Certified Financial Technician (CFTe) with 15+ years of trading, run from 70+ countries. He holds a B.Acc and B.BM from SMU. Every trade he takes is public, dated, losses left in. He teaches low-risk swing trading in 15 minutes a day, one system for any market.

Educational content only, not personalised financial advice. Trading carries risk, including loss of capital. Past performance is not indicative of future results. Synapse Trading is not licensed or regulated by MAS.
by Spencer Li
https://synapsetrading.com/wp-content/uploads/2026/10/little-book-beats-market-greenblatt-card.webp 630 1200 Spencer Li https://synapsetrading.com/wp-content/uploads/2026/10/synapse-logo-horizontal-light.png Spencer Li2026-10-17 18:07:012026-10-19 17:50:45The Little Book That Beats the Market Summary: Joel Greenblatt’s Magic Formula
Spencer Li

How to Draw Trendlines and Trade Channels: Touch, Close, Hold

Technical Analysis & Price Action
Draw trendlines that hold - technical analysis

The classic trading books, one simple drawing method, and the one rule they all agree on

Published: 17 October 2026 · Last updated: 17 October 2026 · By Spencer Li, CFTe


Open any daily chart of a stock in a clear uptrend. Find two higher lows, a few weeks apart, and connect them with a straight line. Extend the line to the right. That is a trendline.

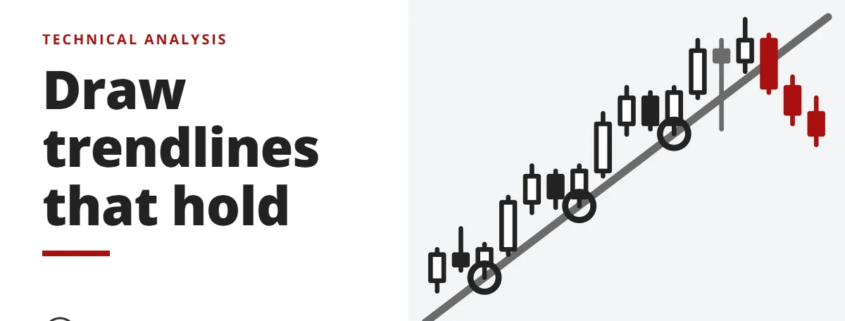
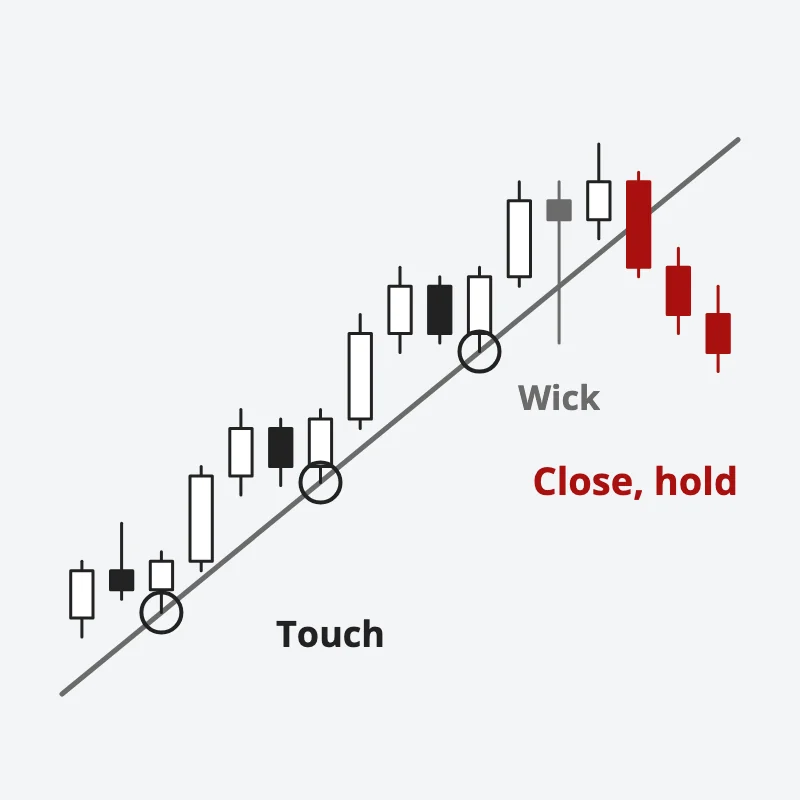
The hard part is everything after that. Which lows count, when is a line broken, and what do you do when it is? Here is the short answer. Draw the line through the lows that price has actually touched, and the more touches the better. Judge a break by the close, never by a wick that pokes through during the day. Then wait to see whether the break holds before you act on it.

The sections below cover each step, how channels work, and where the classic books disagree with each other.

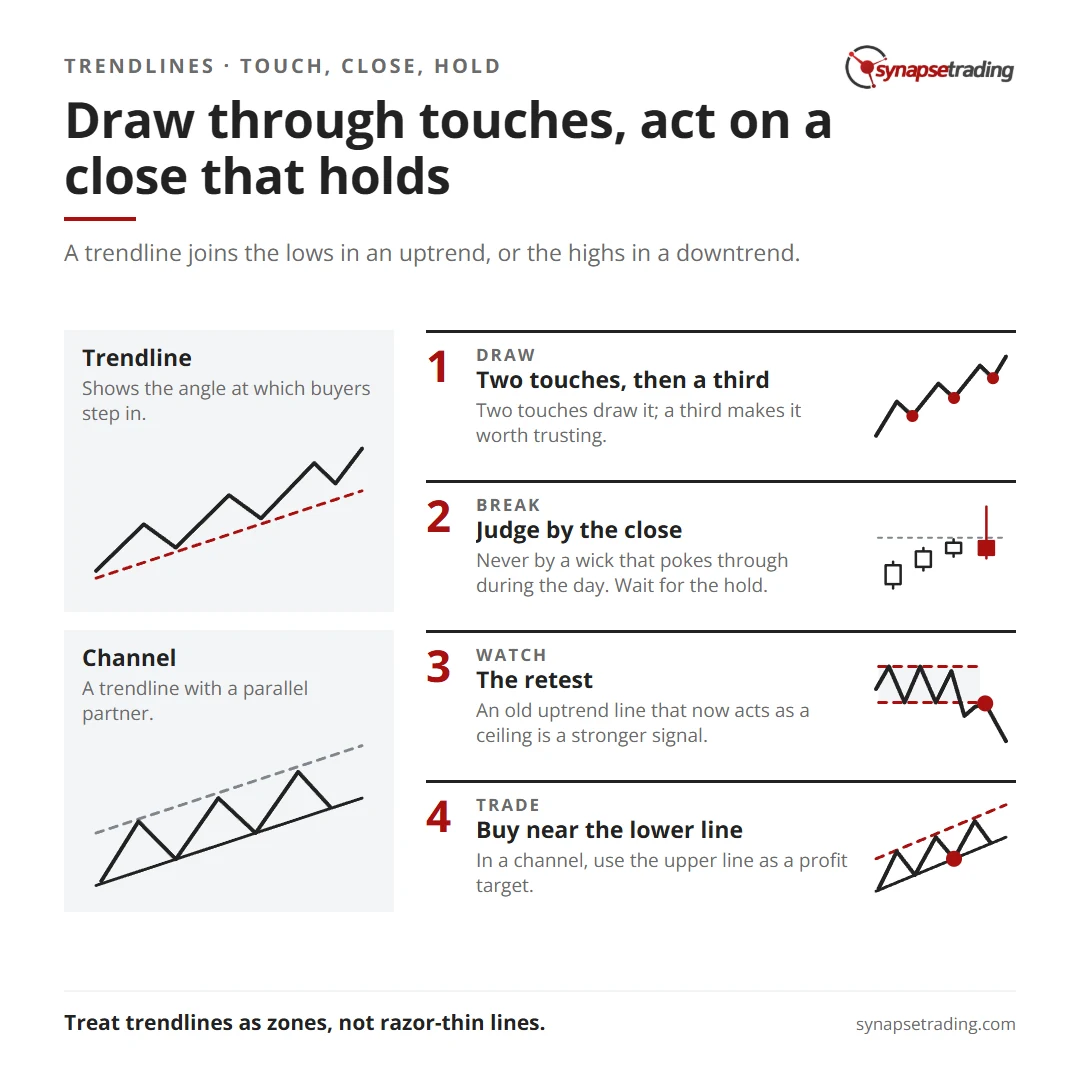
Draw through touches, act on a close that holds. Summary card for the post: How to Draw Trendlines and Trade Channels: Touch, Close, Hold.

What is a trendline, and why does it work?

A trendline joins the lows in an uptrend, or the highs in a downtrend. It shows the angle at which buyers have been willing to step in.

Edwards and Magee, whose book is still the classic on chart patterns, observed that “nearly all Minor and most Intermediate Trends follow nearly straight lines.” They also admitted they did not know why prices so often pull back to the line before carrying on. In their words: “NO ONE KNOWS WHY.”

One likely reason is less mysterious. Plenty of traders draw the same obvious line and place their orders near it, so a line that thousands of people watch ends up mattering because of all the orders sitting around it. It keeps working for as long as they keep watching.

How do you draw a trendline correctly?

Here are the drawing rules most of the classic books share.

  1. Use at least two touches to draw it and a third to trust it. The more times price has touched the line and turned, the more it matters. Touches count for more than length.
  2. Never draw the line through price. If you have to cut through candles to make it fit, it is the wrong line. Adjust it or drop it.
  3. Expect the flatter line to last longer. A very steep line breaks sooner, and when it does, the trend tends to pause and drift sideways for a while, whereas a gentler line can carry a trend for many months.
  4. Use log scale for long, strong trends. On a chart covering years, a stock that doubled several times will curve away from a straight line on a normal scale.
  5. Draw on the daily or weekly chart. Lines on short intraday charts get broken all the time and mean far less.

That fourth rule trips up a lot of people. A trader asked on Reddit, “Trendlines on log charts or normal charts?” Their line had held on a normal chart and broken on a log chart, and they wrote, “Now this makes me question my entire thought process!” It is a fair reaction. For a few months of data, the scale barely matters. Over several years, Edwards and Magee noted the gap “may become MARKED,” and most of the books prefer log scale for long trends.

When is a trendline really broken?

This is where the books disagree, and it is worth seeing exactly how.

BookWhat counts as a real break
Edwards and MageeA close beyond the line “by a margin equal to about 3% OF THE STOCK’S PRICE”
John Murphy3% for major long-term lines, 1% for shorter ones, plus a two-day rule
Martin PringThe 3% rule is “useless intraday”. A valid breakout “should hold for several periods”
Singapore Polytechnic course text“a penetration has to last for more than two (or three) days”
Al BrooksMost breakouts fail, so the first break is often a trap

Do note what they all agree on. Every one of them wants more than a quick poke through the line during the day. A close beyond the line counts for more than a wick, and a break that holds for a few days counts for more than a single close.

An uptrend line drawn through three touches; a wick through it is ignored, and the break is a close below the line that holds
Draw the line through the touches, ignore wicks, and act only on a close that holds.

So a sensible rule is to judge on the daily close, and then wait for the hold. Which of the filters is best is still an open question, because the books argue for their own filters with examples rather than with counted results. If you want to see why so many breaks fail, our post on false breakouts goes through how to spot them.

Want a simple way to check a chart in minutes each day? Our free 15-Minute Swing Trader’s Checklist has the routine and the questions to ask before every trade. Get the free checklist →

What should you do when a trendline breaks?

Usually, nothing yet. Pring wrote that “Whenever a trendline is violated, the odds strongly favor a change in trend.” But a change in trend can mean a pause or a sideways range just as easily as a reversal.

The thing to watch for is the retest. After a clean break, price often comes back to the broken line from the other side. If an old uptrend line now acts as a ceiling and price turns away from it, that is a much stronger signal than the break itself. Our post on how resistance becomes support explains why old lines flip their role.

And if price breaks the line, then closes back above it within a bar or two, treat that as a failed break. The trend you thought had ended is often still alive.

The break of a long-term trendline, one that has held for many months, is rare. It is one of the strongest reversal clues on a chart, and even then the retest is worth waiting for.

Edwards and Magee added one useful warning. “In cases of speculative BLOW-OFF, TRENDLINES ARE OF LITTLE USE.” When a stock goes nearly vertical, there is no sensible line to draw, so do not force one.

How do you draw and trade a channel?

A channel is just a trendline with a parallel partner. In an uptrend, draw the trendline under the lows. Then copy it and move the copy up so it touches the highs. The upper line is often called the return line.

Here is how traders tend to use one.

  • Buy near the lower line, in the direction of the trend. That is where the risk is smallest, because the line is close and the reason for the trade is clear.
  • Use the return line as a target. Many traders take some profit when price reaches the upper line of an uptrend channel.
  • Be careful with breaks of the return line. Al Brooks, writing about intraday charts, found that a break above the top line of a channel fails within about 5 bars more often than it carries on. A sudden spurt above the channel is more often a sign of a tired trend than the start of a faster one.

Do note that this kind of channel is drawn by hand from price. Keltner channels and other indicator bands are calculated, which is a different tool, covered in our post on channels, bands and overlays. Two common chart patterns are built from channels too. A flag is a short channel sloping against the trend, and a wedge is a channel whose lines are converging.

How do trendlines fit with market structure?

Think of a trendline as a quick sketch of the trend, and market structure as the full picture. A trendline tells you the angle. The sequence of higher highs and higher lows tells you whether the trend is still intact. When both break together, the case is much stronger than when only the line goes.

Market structure trading covers how to read those highs and lows.

Trendlines are among the most useful tools on a chart, as long as you treat them as zones rather than razor-thin lines. Price is not a ruler. A line that price respects within a small margin is doing its job.

So go back to the chart you opened at the start and count the touches on your line. Then look at the last time price broke through it, and ask yourself honestly whether you would have jumped on that break straight away, or waited for the close and the hold. For more on reading price directly, see the guide to price action trading.

FAQ

How do you draw a trendline correctly?

Connect at least two lows in an uptrend, or two highs in a downtrend, without cutting through any candles. A third touch confirms it, and more touches make it stronger.

How many touches make a valid trendline?

Two touches draw it, and a third makes it worth trusting. The classic books agree that the number of touches matters more than the length of the line.

What is the 3% rule for trendline breaks?

It is Edwards and Magee’s filter: a close beyond the line by about 3% of the stock’s price. John Murphy uses 3% for major lines and 1% for shorter ones, and Martin Pring calls the rule useless on intraday charts.

Should trendlines be drawn on log or linear charts?

Use log scale for long, strong trends covering years. For a few months of data, the scale makes little difference.

How do you trade a trend channel?

Buy near the lower line in an uptrend, use the upper line as a profit target, and be wary of breaks above the upper line, which often fail.

Go deeper

A good line only helps if you check it the same way every day. The free 15-Minute Swing Trader’s Checklist has the daily routine, the questions to ask before every trade, and the five rules that protect your account.


About the author. Spencer Li is The 15-Minute Trader and the founder of Synapse Trading. He is a Certified Financial Technician (CFTe) with 15+ years of trading, run from 70+ countries. He holds a B.Acc and B.BM from SMU. Every trade he takes is public, dated, losses left in. He teaches low-risk swing trading in 15 minutes a day, one system for any market.

Educational content only, not personalised financial advice. Trading carries risk, including loss of capital. Past performance is not indicative of future results. Synapse Trading is not licensed or regulated by MAS.
by Spencer Li
https://synapsetrading.com/wp-content/uploads/2026/10/how-to-draw-trendlines-card.webp 630 1200 Spencer Li https://synapsetrading.com/wp-content/uploads/2026/10/synapse-logo-horizontal-light.png Spencer Li2026-10-17 18:05:462026-10-19 17:22:18How to Draw Trendlines and Trade Channels: Touch, Close, Hold
Spencer Li

Momentum Trading Strategy: What the Research Says, and Why It Crashes

Trading Strategies & Systems
Momentum trading, by the research - trading strategies

The 2 kinds of momentum, the evidence behind them, the weeks when they fail, and a simple 3-step check

Published: 17 October 2026 · Last updated: 17 October 2026 · By Spencer Li, CFTe


A momentum trading strategy buys whatever has risen the most over the past few months and avoids, or sells short, whatever has fallen the most. The bet is that strong prices tend to stay strong for a while, and weak prices tend to stay weak.

It sounds too simple to work, but it is one of the best-tested ideas in finance. Researchers have found it in stocks, bonds, currencies and commodities, across many decades and many countries.

There is a catch, though. Momentum has rare, violent losing streaks, and they tend to arrive just as a beaten-down market starts to recover. The edge also shrinks once trading costs come out. Below are the 2 kinds of momentum, what the research says, and a simple 3-step check.

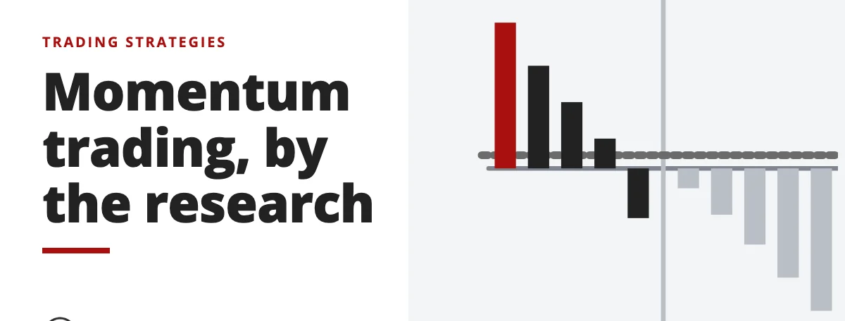
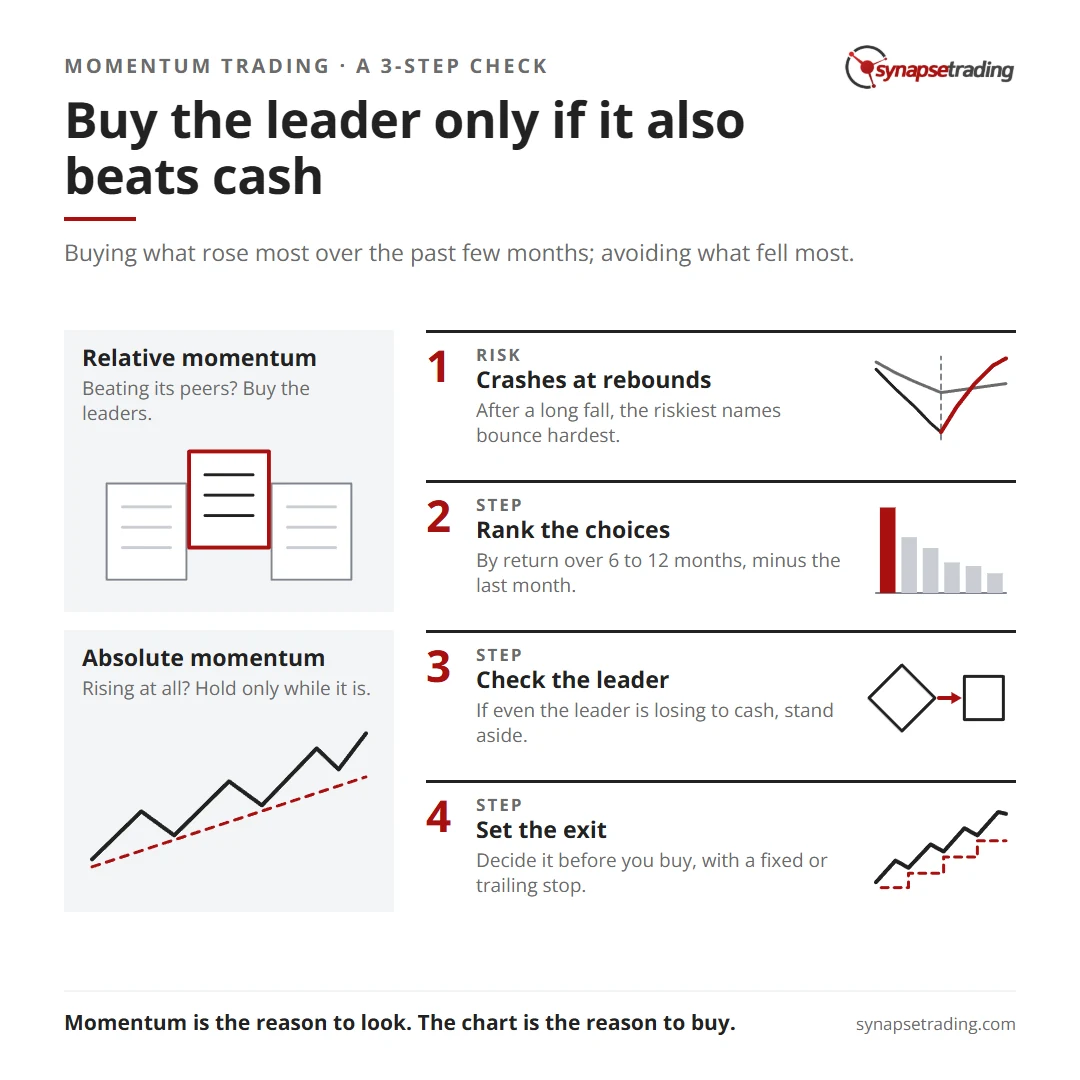
Buy the leader only if it also beats cash. Summary card for the post: Momentum Trading Strategy: What the Research Says, and Why It Crashes.

What are the 2 types of momentum?

The word “momentum” covers 2 different questions, and most confusion comes from mixing them up.

Relative momentum asks: which of these assets has risen more than the others? Academics call it cross-sectional momentum. You rank a group of stocks or funds by their past return and buy the leaders.

Absolute momentum asks: has this asset risen at all? Academics call it time-series momentum. You look at one asset on its own and only hold it while its recent return is positive.

Relative momentumAbsolute momentum
The questionIs it beating its peers?Is it rising at all?
Also calledCross-sectional momentum, relative strengthTime-series momentum, trend following
Typical lookback3 to 12 monthsAbout 12 months
What it needsA group of assets to rankJust 1 asset
What it does in a bear marketStill buys the “best” of a falling groupMoves you to cash or bonds
Main riskCrashes at sharp reboundsWhipsaws in sideways markets

The second kind is close to what our post on trend following describes. And neither kind is the same as a momentum indicator, which measures how fast price is moving on a chart over a few days. A trader can use that indicator without running a momentum strategy at all.

Does momentum trading actually work?

On the long-run evidence, yes, it has.

The modern research starts with a 1993 paper by Narasimhan Jegadeesh and Sheridan Titman, who found that stocks with the best returns over the past 3 to 12 months kept beating the worst ones over the next few months. Critics said they had simply found a pattern by chance. So in 2001 the same authors checked the years after their paper, and reported that “momentum profits have continued in the 1990’s suggesting that the original results were not a product of data snooping bias.”

The absolute kind has similar backing. A 2012 study by Tobias Moskowitz, Yao Hua Ooi and Lasse Pedersen looked at 58 futures and currency markets over more than 25 years. They found that “the past 12-month excess return of each instrument is a positive predictor of its future return.” The effect “persists for about a year and then partially reverses over longer horizons.”

That last phrase is worth noticing. Momentum is a medium-term effect. Over the following 4 to 5 years, the 2001 paper found the winners tended to give some of it back.

One practical point surprises most new traders. Most momentum research ranks assets by their total return over a past period, often the last 12 months, leaving out the most recent month. It does not use the RSI or a moving average crossover.

A trader on a swing trading forum learned this the hard way. He screened for stocks above their 20 and 50-day averages with an RSI near 45 to 50, and could not find a single stock in a clear uptrend. That screen is looking for a pullback inside a trend, which is a different job.

If you want a simple daily routine for reading trends before you trade them, our free 15-Minute Swing Trader’s Checklist covers it. Get the free checklist →

How do momentum traders pick what to buy?

There are 2 well-known published approaches, and they come from opposite ends of the market.

Gary Antonacci’s Dual Momentum Investing (2015) uses both kinds together. Relative momentum picks the strongest asset, and absolute momentum decides whether to be invested at all. His argument is that relative momentum alone “raises returns without reducing risk,” because it still buys the best of a falling group. Adding the absolute check is meant to move the money to bonds when even the leader is losing to Treasury bills.

William O’Neil, who built a long career on stock leaders, used momentum differently. He rejected simply buying the stocks with the highest relative strength. He wanted stocks that were beating the market as they broke out of a sound base near a new high. In his own comparison, stocks bought that way worked 6 or 7 times in 10, against 3 or 4 times in 10 for stocks bought while sliding below their 10-week average. Our post with William O’Neil’s trading tips covers more of his thinking.

Why do momentum strategies crash?

This is the part most momentum sales pages leave out.

Kent Daniel and Tobias Moskowitz studied the worst stretches in a 2014 paper called “Momentum Crashes.” They found that momentum suffers “infrequent and persistent strings of negative returns.” The crashes, in their words, “occur in ‘panic’ states – following market declines and when market volatility is high – and are contemporaneous with market rebounds.”

Their numbers from 2009 show it plainly. From March to May 2009, the US market rose 26%. The past winners rose only 8%, while the past losers rose 163%. In July and August 1932, the market rose 82%, the winners 32% and the losers 232%.

The reason is simple. After a long fall, the “winners” are the stocks that fell least, often the dull, defensive ones. The “losers” are the most beaten-down, riskiest names. When fear lifts, the riskiest names bounce hardest. A momentum book that is short the losers gets hurt badly. A long-only book of leaders is not wiped out, but it badly lags.

Momentum also has a lumpy feel, even in good years. A trader posted on a swing trading forum after his momentum screener gave him 3 signals in 1 week. One collapsed, one ran hard, and one did nothing. His verdict was: “I think I got all 3 expected outcomes.” That is a fair summary of how this style feels from trade to trade.

Does the momentum edge still exist after costs?

The honest answer is smaller than the textbook numbers suggest.

Research by David McLean and Jeffrey Pontiff, published in 2016, found that across many published market patterns, about half of the original return disappears once the paper is out and traders start acting on it. Momentum also trades often, because the leaders keep changing. Every commission and every bit of slippage comes out of the edge.

To be fair to the other side, the 2001 Jegadeesh and Titman check is a real point in momentum’s favour. The profits continued after the 1993 paper, which is more than many published patterns can say. What has shrunk is the size of the edge, and the margin for error that comes with it.

How to use momentum: a 3-step check

Here is a simple way to use momentum without being run over by it. It works for picking a stock, a sector or a whole market.

  1. Rank the choices. Rank them by their return over the past 6 to 12 months, leaving out the most recent month. Look at the top of the list only.
  2. Check the leader against cash. Make sure the leader is also rising on its own, with a return above what cash pays. If even the leader is losing to cash, stand aside.
  3. Set the exit. Decide it before you buy. A fixed stop or a trailing stop loss keeps a single crash from taking a large share of the account.

Here is a hypothetical example with 5 made-up funds and a cash rate of 4% a year:

Hypothetical fundReturn over the past 12 months, excluding last monthBeats peers?Beats cash?
Fund A18%Yes, topYes
Fund B12%NoYes
Fund C6%NoYes
Fund D2%NoNo
Fund E-9%NoNo

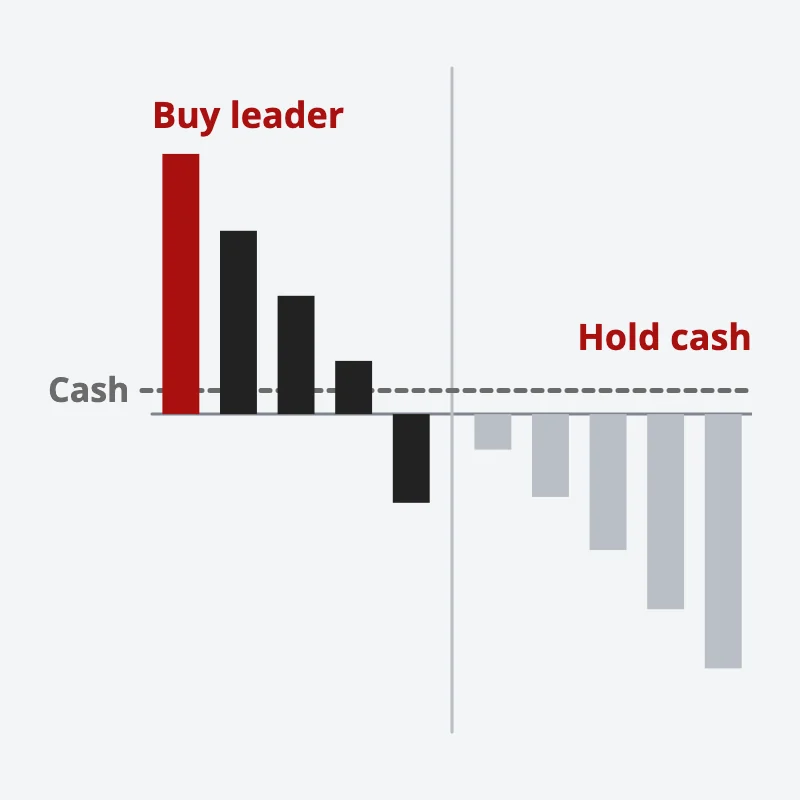
Fund A passes the first 2 steps. Now imagine every fund is negative, with Fund A at -3%. It is still the “best,” but it fails the cash check, and the check says to hold cash instead.

Two sets of ranked bars: when the leader beats cash, buy the leader; when even the leader is below cash, hold cash
Buy the strongest choice only if it also beats cash; otherwise hold cash.

The Daniel and Moskowitz paper adds one more idea for the last step. A version of momentum that shrank its bets when its own risk was high “approximately doubles the alpha and Sharpe Ratio” of the plain version, in their tests. In plain terms, smaller positions in wild markets did much better than a fixed size.

Momentum works best as the reason to look at a stock, with the chart as the reason to buy it. The ranking narrows the list. The entry, the stop and the size still decide the result. For the entry side, see our post on the 4 types of trading setups.

So, when your strongest stocks lag on the first big up day after a fall, will you know whether that is a crash in the making or a normal wobble? And how much of your account would you let ride on a single leader? For more ways to build a system around rules like these, see the guide to trading strategies.

FAQ

What is momentum trading in simple terms?

It is buying assets that have risen the most over the past few months, on the evidence that strong prices tend to stay strong for a while, and exiting when that strength fades.

Is momentum trading profitable?

The research says momentum has paid over long periods across many markets. It also shows rare, sharp crashes, and about half of a published edge tends to fade once traders learn of it. Results depend heavily on costs, sizing and exits.

What is the difference between momentum and trend following?

Trend following is usually absolute momentum: holding an asset while it rises on its own. Momentum trading often means relative momentum, which ranks assets against each other and buys the leaders.

What timeframe does momentum trading use?

Most research looks at returns over the past 3 to 12 months and finds the effect lasts up to about a year. Short-term swing traders apply the same idea over weeks.

Is a momentum indicator the same as a momentum strategy?

No. A momentum indicator measures how fast price is moving over a few bars on a chart. A momentum strategy ranks assets by their return over months and holds the leaders.

Go deeper

Momentum tells you where the strength is. The free 15-Minute Swing Trader’s Checklist has the daily routine, the questions to ask before every trade, and the five rules that protect your account.


About the author. Spencer Li is The 15-Minute Trader and the founder of Synapse Trading. He is a Certified Financial Technician (CFTe) with 15+ years of trading, run from 70+ countries. He holds a B.Acc and B.BM from SMU. Every trade he takes is public, dated, losses left in. He teaches low-risk swing trading in 15 minutes a day, one system for any market.

Educational content only, not personalised financial advice. Trading carries risk, including loss of capital. Past performance is not indicative of future results. Synapse Trading is not licensed or regulated by MAS.
by Spencer Li
https://synapsetrading.com/wp-content/uploads/2026/10/momentum-trading-card.webp 630 1200 Spencer Li https://synapsetrading.com/wp-content/uploads/2026/10/synapse-logo-horizontal-light.png Spencer Li2026-10-17 18:04:142026-10-19 17:50:47Momentum Trading Strategy: What the Research Says, and Why It Crashes
Spencer Li

How to Make Money in Stocks Summary: William O’Neil’s CAN SLIM Rules

Trading Foundations
O'Neil's CAN SLIM rules - book summary

The seven letters O’Neil drew from a century of big winners, the 7% to 8% loss rule that protects them, and when he takes profits

Published: 17 October 2026 · Last updated: 17 October 2026 · By Spencer Li, CFTe


What is How to Make Money in Stocks about? William O’Neil’s book sets out one system for buying growth stocks, called CAN SLIM, and the selling rules that make it work. He built it by studying the biggest stock market winners of each year and asking what they looked like just before they ran.

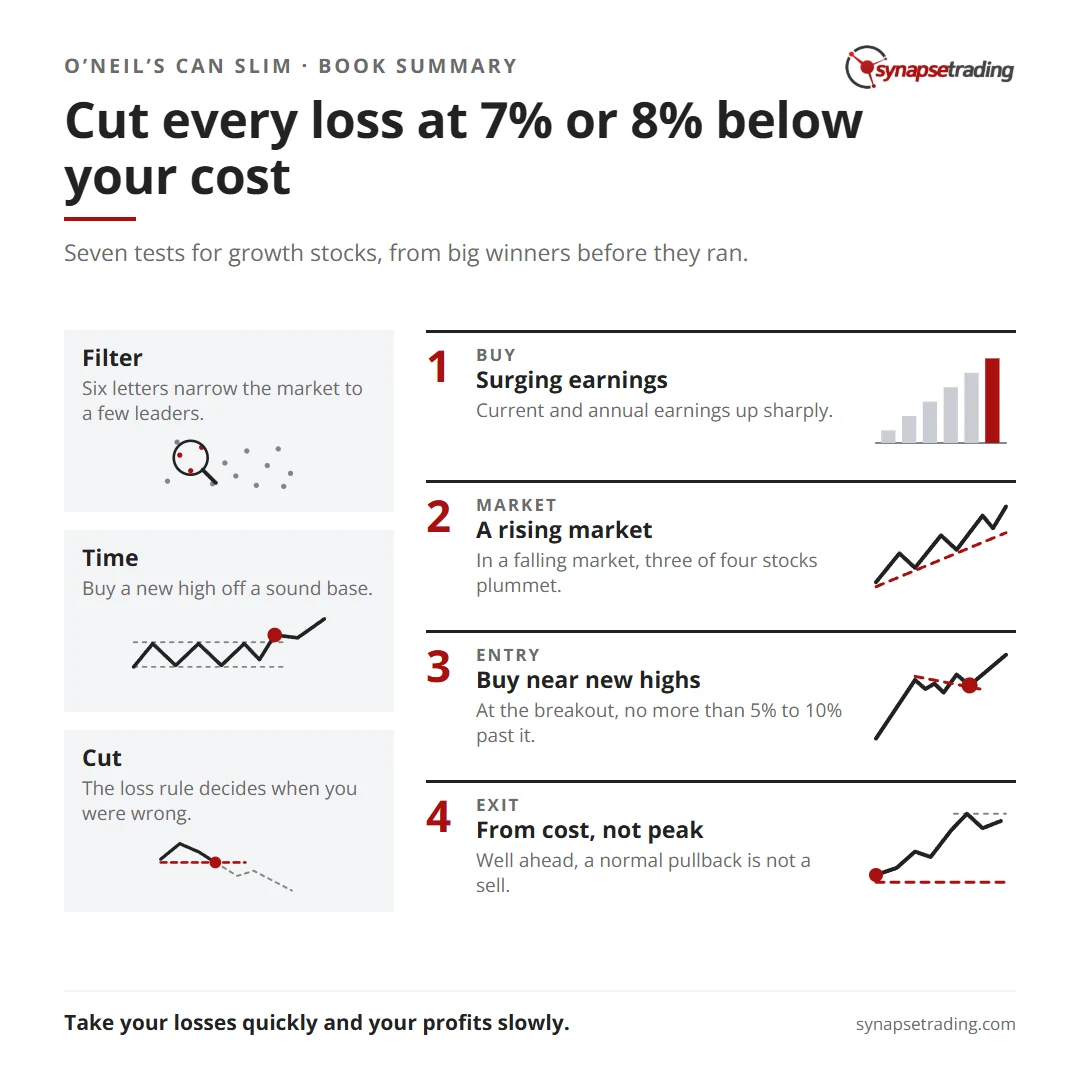
The answer fits in seven letters. Buy companies with surging current and annual earnings, something new, and strong demand for their shares. Buy the leader in its group, owned by good funds, in a rising market. Then cut every loss at 7% or 8% below your cost, with no exceptions. This summary walks through each letter, the loss and profit rules, and where the evidence is weaker than the book admits.

Cut every loss at 7% or 8% below your cost. Summary card for the post: How to Make Money in Stocks Summary: William O'Neil's CAN SLIM Rules.

Who is William O’Neil?

William J. O’Neil founded the research firm William O’Neil + Co. and the newspaper Investor’s Business Daily. He started small, with five shares of Procter & Gamble, and says the book “isn’t written for the elite.” It is written for ordinary savers who want a set of rules they can follow.

The edition summarised here is the fourth, published by McGraw-Hill in 2009. It opens on the market falls of 2000 and 2008.

What is the overview of the book?

The book has two main parts. Part I is about buying: a chapter on chart bases, then one chapter for each of the seven CAN SLIM letters. Part II is about being smart from the start: cutting losses, selling on the way up, money management and the 21 most common mistakes. Later chapters cover industry groups, reading the news and mutual funds.

The evidence is a long study. O’Neil’s firm took the greatest winner of each year across 125 years and charted what each looked like before its big move. His core belief is that the market is “human nature and crowd psychology on daily display.” Because human nature does not change, he argues the same price patterns keep coming back.

One caution before the rules. The study looks at winners chosen after the fact. It shows what the big winners looked like, but not how many stocks looked the same and then failed.

What does CAN SLIM stand for?

Each letter is a test. A stock has to pass all seven.

LetterWhat it meansThe book’s number
C: current quarterly earningsLatest quarter’s earnings per share up sharply on the same quarter a year agoAt least 25% to 50%. “A mediocre 10% or 12% isn’t enough.”
A: annual earningsEarnings up in each of the last three years25% or more a year, with return on equity of 17% or more
N: something newA new product, new management or new industry conditions, and a new price high off a sound baseOver 95% of the winners had something new
S: supply and demandFewer shares on offer, and big buying at the breakoutBreakout volume at least 40% to 50% above normal
L: leader or laggardBuy the number one stock in a leading groupRelative strength of 80 or higher
I: institutional sponsorshipA rising number of good funds owning the stockAt least one or two top-performing funds
M: market directionThe general market must be in an uptrendRead the index price and volume every day

O’Neil calls the change in earnings per share “the single most important element in stock selection today.” He says only about 2% of stocks show earnings growth that strong at any one time. So C alone throws out most of the market. On estimates he is just as firm: “Actual reported earnings are facts.”

How does CAN SLIM work as a system?

It helps to see the seven letters as three jobs.

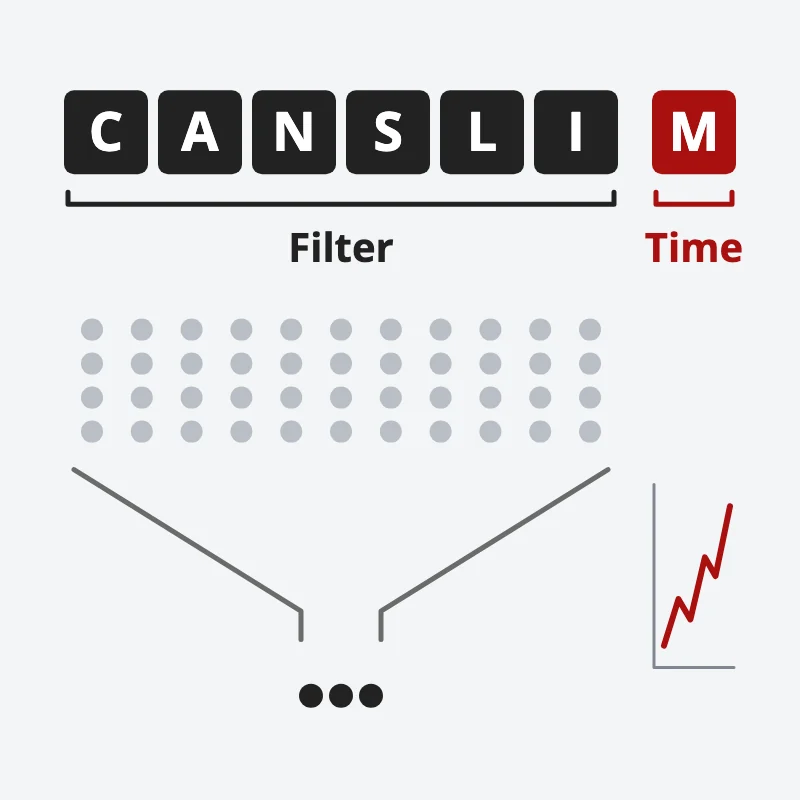
  1. Filter. C, A, N, S, L and I narrow the market down to a handful of leading companies with real earnings.
  2. Time. The new high off a sound base, and the M, decide when to buy. A good stock bought at the wrong moment still fails.
  3. Cut. The loss rule decides when you were wrong, and it never bends.

The timing job is the one most readers skip. O’Neil is blunt about M. Get the other six letters right in a falling market, and “three out of four of your stocks will plummet” with it.

The letters C, A, N, S, L and I filter many stocks down to a few leaders; the letter M, market direction, times the buy
Six CAN SLIM letters pick the stock; M, the market’s direction, decides when to buy.

Why does O’Neil buy stocks near their highs?

This is the part that feels wrong to most new investors. O’Neil calls it the Great Paradox: “What seems too high in price and risky to the majority usually goes higher eventually, and what seems low and cheap usually goes lower.”

So he buys a stock as it breaks to a new high out of a base, a stretch of sideways trading that lasts from seven or eight weeks to over a year. His favourite base is the cup with handle, which we break down in our guide to the cup and handle pattern. The buy is at the breakout, and no more than 5% to 10% past it, because a stock that has run further is likely to pull back and shake you out. As he puts it: “There’s a right time, and then there are all the other times.”

The same thinking makes him wary of cheap shares. “I prefer not to buy any common stock that sells for below $15 per share,” he writes, because most of his super winners broke out of bases between $30 and $50.

What is O’Neil’s 7% to 8% stop-loss rule?

Cut every loss when a stock falls 7% or 8% below what you paid. He calls it “an absolute maximum.” The reason is his own hit rate: “only one or two out of ten stocks that I’ve bought turned out to be truly outstanding.” The other eight have to be kept small, or they eat the winners.

Three details matter.

  • It runs from your cost, not the peak. “Do not sell a stock just because it’s off 7% to 8% from its peak price.” Once you are well ahead, a normal pullback is not a sell.
  • It caps your real risk. Follow it and, in his words, “It’s 8%, no matter what you buy.”
  • It stops the big loss early. “Every 50% loss began as a 10% or 20% loss.”

His summary is an old line: “take your losses quickly and your profits slowly.” I came to the same place in what I learnt in 15 years of trading. Once I accepted that half my trades would lose, a single loss stopped feeling like a verdict on me.

When does O’Neil take profits?

He found that most winners, after breaking out of a proper base, “tend to move up 20% to 25%” and then pull back to build a new base. So the plain rule is to take most gains at 20% to 25%, while the stock is still rising. “If you don’t sell early, you’ll be late.”

There is one big exception. If a stock jumps 20% in only one to three weeks after the breakout, hold it for at least eight weeks. Those are the ones that can become the big winners.

Put the two rules together and you get a ratio of about three to one between the profit target and the loss cut. O’Neil says winning comes from losing “the least amount possible” when you are wrong, not from being right all the time.

How many stocks should you own?

Fewer than most people think. “Wide diversification is a substitute for lack of knowledge,” he writes. He sets the number by account size, from two stocks in a small account to four or five in a mid-sized one, and six or seven even past a million dollars. If you want a sixth stock, sell the weakest of your five first.

If you want a checklist that sets your exit before you enter, our free 15-Minute Swing Trader’s Checklist lays it out. Get the free checklist →

Concluding thoughts

How to Make Money in Stocks is one of the few investing books that gives you numbers rather than opinions. Its best lesson is not a letter in CAN SLIM. It is the loss rule, and the idea that you will be wrong most of the time and can still do well.

O’Neil ends Part II with 21 mistakes, and the first behind them all: “By far the greatest mistake that 98% of all investors make” is never studying where their own buys and sells went wrong.

For his best one-liners, see our post on William O’Neil’s best trading tips and quotes. The book also sits on my reading list and in our guide to the best investing and trading books of all time.

So pick your last losing trade. How far did it fall below your cost before you sold it?

FAQ

What is the CAN SLIM method?

William O’Neil’s seven-part test for growth stocks: current earnings, annual earnings, something new, supply and demand, leader, institutional sponsorship and market direction.

What is O’Neil’s 7% to 8% rule?

Sell any stock that falls 7% or 8% below the price you paid, with no exceptions. The rule is measured from your cost, not from the stock’s peak.

Does O’Neil recommend buying stocks at new highs?

Yes, when the stock is breaking out of a sound base in a rising market. He avoids buying more than 5% to 10% past the breakout point.

When does CAN SLIM say to take profits?

Most gains at 20% to 25%. If a stock rises 20% within three weeks of breaking out, hold it for at least eight weeks.

Go deeper

O’Neil’s rules work because they are written down before the trade. The free 15-Minute Swing Trader’s Checklist does the same for swing traders: the daily scan, the questions to ask before you enter, and the five rules that keep you in the game.


About the author. Spencer Li is The 15-Minute Trader and the founder of Synapse Trading. He is a Certified Financial Technician (CFTe) with 15+ years of trading, run from 70+ countries. He holds a B.Acc and B.BM from SMU. Every trade he takes is public, dated, losses left in. He teaches low-risk swing trading in 15 minutes a day, one system for any market.

Educational content only, not personalised financial advice. Trading carries risk, including loss of capital. Past performance is not indicative of future results. Synapse Trading is not licensed or regulated by MAS.
by Spencer Li
https://synapsetrading.com/wp-content/uploads/2026/10/how-to-make-money-in-stocks-summary-card.webp 630 1200 Spencer Li https://synapsetrading.com/wp-content/uploads/2026/10/synapse-logo-horizontal-light.png Spencer Li2026-10-17 18:03:582026-10-19 17:50:48How to Make Money in Stocks Summary: William O’Neil’s CAN SLIM Rules
Spencer Li

Market Top or Pullback? How to Tell the Difference

Trading Strategies & Systems
Market top or pullback? - market analysis

Most falls feel like the start of something bigger. The history says most of them are not, and a few signs separate the ones that are

Published: 17 October 2026 · Last updated: 17 October 2026 · By Spencer Li, CFTe


“This is probably the top of this bull market.” A trader posted that on a stock forum in June 2026. Every sell-off brings a wave of posts like it.

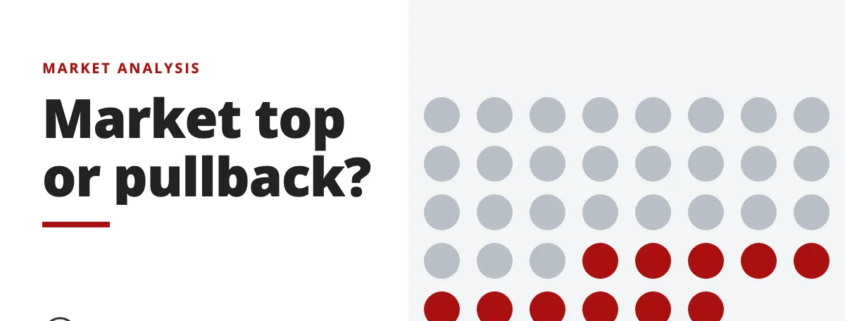
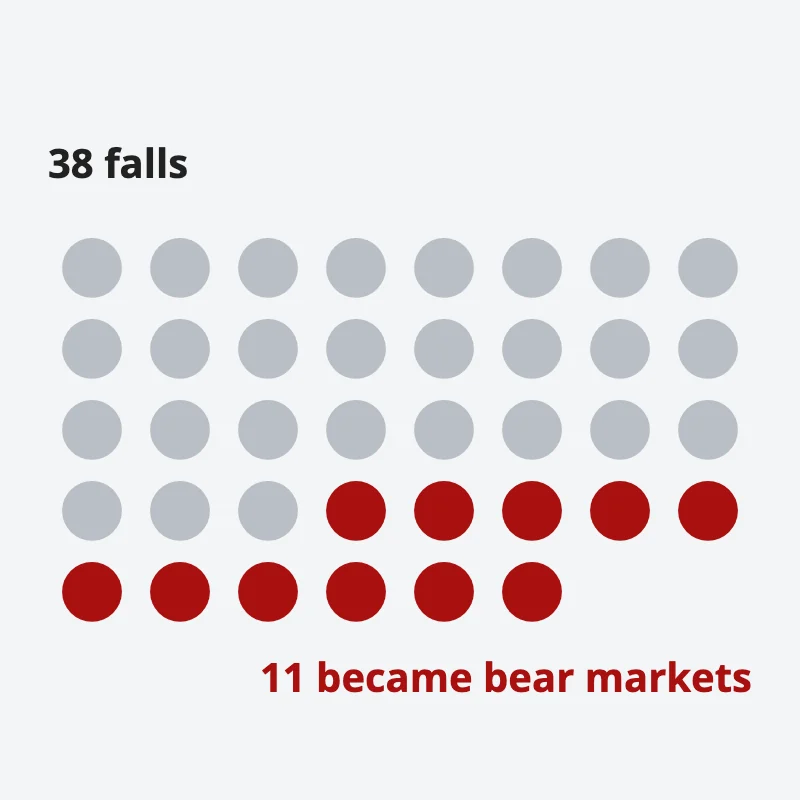
Here is the short answer. In the moment, nobody can tell a top from a pullback for certain. But the odds favour the pullback. From 1950 to October 2022, the S&P 500 had 38 falls of 10% or more on a closing basis. Only 11 of them, or 29%, went on to become bear markets of 20% or more.

38 dots for the S&P 500 falls of 10% or more since 1950; only 11, in red, went on to become bear markets
Most falls of 10% are pullbacks: only 11 of 38 since 1950 became bear markets.

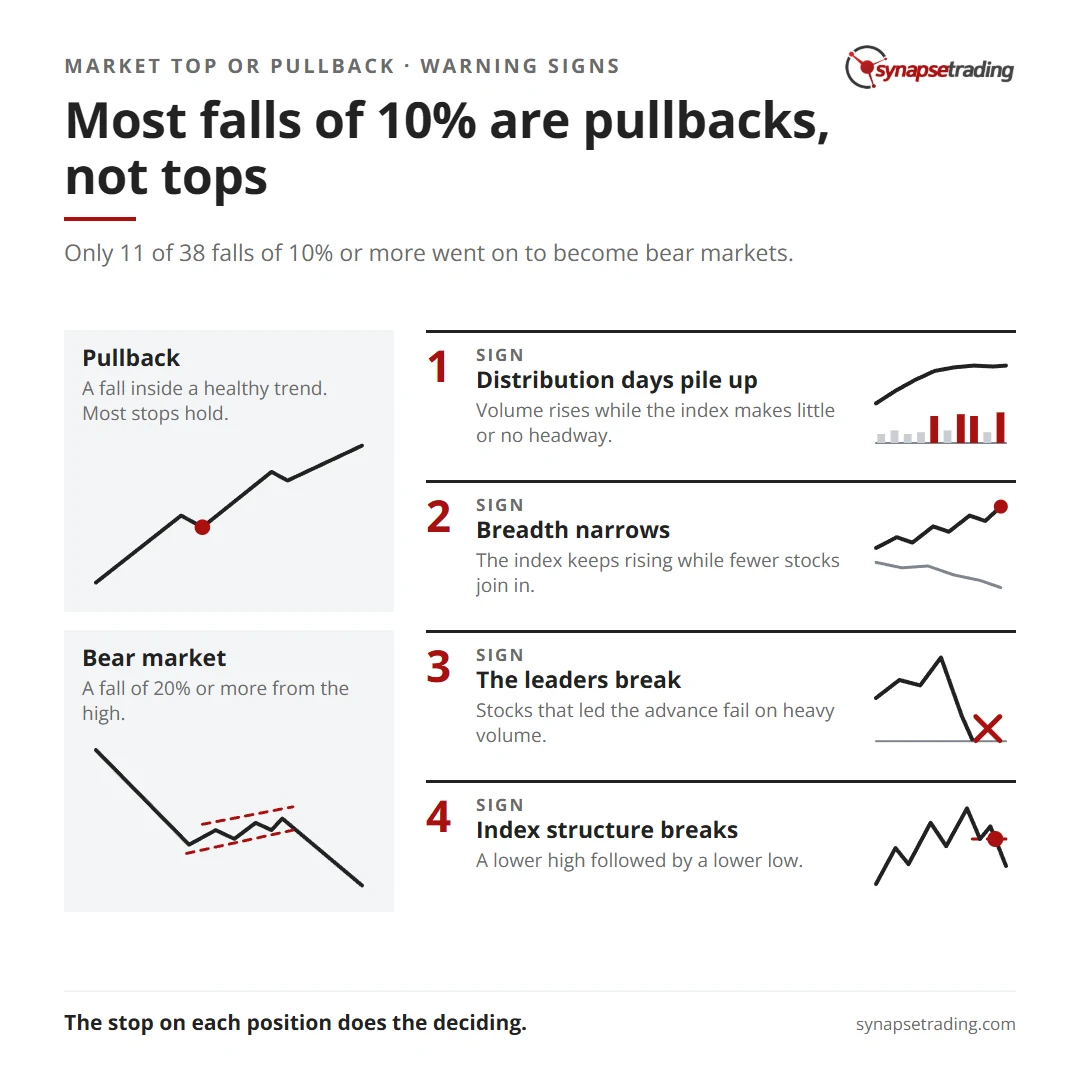
What separates the real tops is a cluster of warning signs that build over weeks, usually while prices are still near their highs. There are 5 to watch: distribution, narrowing breadth, bonds turning first, leaders breaking down, and the index’s own structure breaking. One sign on its own is noise. Several at once deserve your attention.

Most falls of 10% are pullbacks, not tops. Summary card for the post: Market Top or Pullback? How to Tell the Difference.

How often does a pullback turn into a bear market?

Less often than it feels. The figures below are for the S&P 500 on a closing basis from 1950 to October 2022, counted from the Yardeni Research tables of bull and bear markets (October 2022 edition).

Once the fall reachesChance it goes on to1950 to 2022
10%15%18 of 38, or 47%
15%20%11 of 18, or 61%
10%20%11 of 38, or 29%
20%30%6 of 11, or 55%
20%40%3 of 11, or 27%

Two things stand out. At 10% down, the odds are well in favour of a pullback. But once a fall reaches 15%, the odds of it going on to 20% rise to about 3 in 5. Each step down makes the next step more likely.

Do note the 20% line is a convention, and the market does not know it exists. Six falls from 1950 to 2022 stopped between 17% and 19.9%, including 1990, 1998 and 2018. Every one of them turned back up. The 2025 fall, from 19 February to 8 April, stopped at 18.9%. A rule built on the exact 20% line inherits that noise.

What are the 5 warning signs that show up before a real market top?

None of these is a timing signal on its own. They are the signs that, together, separate a top that is forming from a pullback inside a healthy trend.

1. Distribution days pile up. William O’Neil, the founder of Investor’s Business Daily, built his market timing around this idea. A distribution day is a day when volume rises from the day before while the index makes little or no headway. On a down day, the index “should decline more than 0.2%” to count. His key point is that distribution happens while prices are still rising, which is why so few people notice it.

His book gives the count in more than one place, and the figures differ. In one passage, 4 or 5 days of definite distribution over 4 or 5 weeks means the market “will almost always turn down.” Elsewhere, his firm’s rule was 5 or 6 distribution days in any 4 to 5 week window. So treat the count as a range rather than an exact trigger.

2. Breadth narrows. Near a top, the index can keep rising while fewer and fewer stocks join in. The big names carry the average, and the rest quietly roll over. Our guide on what market breadth is explains how to measure it, and the advance/decline line is one of the simplest tools for it. An index at new highs with a falling A/D line is the classic warning.

3. Bonds turn first. John Murphy’s work on intermarket analysis found that “near market tops, the bond market will usually turn down first.” In 1987, bonds broke down in April and stocks topped in August. The lead varies, so this is background, never a trigger.

4. The leaders break. The stocks that led the advance start failing on heavy volume. O’Neil noted that by the time the index shows a clear top reversal, leading stocks have usually been under distribution for days or weeks.

5. The index structure breaks. In an uptrend, the index makes higher highs and higher lows. A close below the last higher low is the first warning. A lower high followed by a lower low is the evidence. Our post on market structure walks through that sequence step by step.

If you want a short daily routine that keeps you checking these things before you act, our free 15-Minute Swing Trader’s Checklist covers it. Get the free checklist →

Why do so many people call the top too early?

Mostly, they are early. A falling market always comes with a story, and stories are convincing. Every 5% dip gets an explanation within hours. Our post on the narrative fallacy looks at why the mind grabs those stories so quickly.

There is also a crowd effect. When everyone online is calling the top, it feels risky not to agree. That is herd mentality at work, and it pushes people out of good positions at exactly the wrong time.

Does a recession make a bear market worse?

Yes, by a clear margin. The 3 deepest S&P 500 bear markets since 1950 all came with a recession: 48.2% in 1973 to 1974, 49.1% in 2000 to 2002, and 56.8% in 2007 to 2009. The deepest bear without a recession was 1987, at 33.5%, and it was over within 4 months.

So the question to ask once a fall passes 20% is whether the economy is heading into a recession too, because the answer shapes how deep the fall is likely to go far more than any chart pattern does.

So what should you do when you are not sure?

A sensible default is to treat every fall as a pullback until the warning signs say otherwise. But that is no reason to wait for certainty to manage risk. The stop on each position does the deciding, one trade at a time. If the market is only pulling back, most stops hold. If it is topping, the stops take you out in stages, long before anyone on the news calls it a bear market.

That approach does not need a forecast. It needs a plan that was written before the fall started. Our guide to money and risk management covers how to set that up.

So, on the market you trade right now, how many of the 5 warning signs can you actually see? And are you reacting to the signs, or to the headlines?

FAQ

How do you know if the market has topped?

You usually only know for sure afterwards. Before that, the signs to watch are distribution days piling up, narrowing breadth, bonds turning down first, leading stocks breaking, and the index making a lower high and a lower low.

What is the difference between a pullback, a correction and a bear market?

The usual convention is that a pullback is a fall of less than 10%, a correction is a fall of 10% to 20%, and a bear market is a fall of 20% or more from the high. The lines are conventions, and several falls since 1950 stopped just short of 20%.

What percentage of corrections become bear markets?

From 1950 to 2022, 11 of 38 S&P 500 falls of 10% or more went on to reach 20%, or about 29%. Once a fall reaches 15%, about 61% went on to reach 20%.

What is a distribution day?

A day when market volume rises from the day before while the index stalls or falls. In William O’Neil’s method, a down day must fall more than 0.2% to count. Several in a few weeks is a warning that big investors are selling.

Should you sell everything when you think the market is topping?

Most traders do better managing each position with its own stop than making one big call. A top is only clear afterwards, and selling everything on a guess risks missing the rebound if it was a pullback.

Go deeper

Telling a top from a pullback is easier with a routine you follow every day, before the headlines get loud. The free 15-Minute Swing Trader’s Checklist has the daily routine, the questions to ask before every trade, and the five rules that protect your account.


About the author. Spencer Li is The 15-Minute Trader and the founder of Synapse Trading. He is a Certified Financial Technician (CFTe) with 15+ years of trading, run from 70+ countries. He holds a B.Acc and B.BM from SMU. Every trade he takes is public, dated, losses left in. He teaches low-risk swing trading in 15 minutes a day, one system for any market.

Educational content only, not personalised financial advice. Trading carries risk, including loss of capital. Past performance is not indicative of future results. Synapse Trading is not licensed or regulated by MAS.
by Spencer Li
https://synapsetrading.com/wp-content/uploads/2026/10/market-top-vs-pullback-card.webp 630 1200 Spencer Li https://synapsetrading.com/wp-content/uploads/2026/10/synapse-logo-horizontal-light.png Spencer Li2026-10-17 18:03:492026-10-19 17:50:50Market Top or Pullback? How to Tell the Difference
Page 1 of 104123›»

Free checklist

The 15-Minute Swing Trader’s Checklist

The daily and weekly routine I use to find, manage and review trades in about 15 minutes a day, on the record since 2014.

Get the free checklist

Topics

  • Trading foundations
  • Technical analysis
  • Strategies and systems
  • Risk and money
  • Trading psychology
  • Markets and products

Synapse Trading

Swing trading for busy professionals, in 15 minutes a day.

Start free

Learn

  • Start here
  • Free trading guides
  • Blog
  • Tools and resources

Programs

  • Trading Mastery Program
  • Daily trading signals
  • Student results
  • Public trade log

Company

  • About
  • Contact me
  • Partnerships
  • Disclaimer
  • Privacy policy
  • Terms & Conditions

Synapse Trading Pte Ltd
Registration No. 201316168H
WhatsApp +65-8897-1204
info@synapsetrading.com

Contact Us

Synapse Trading Pte Ltd
Registration No. 201316168H

Whatsapp: +65-8897-1204
Telegram: @iamrecneps
Email: info@synapsetrading.com

Links

Disclaimer
Privacy policy
Terms & Conditions
Contact us
Partnerships

© 2012-2026 Synapse Trading | All rights reserved
  • Link to Facebook
  • Link to X
  • Link to Instagram
  • Link to Youtube
  • Link to LinkedIn
  • Link to Mail
Scroll to top Scroll to top Scroll to top