

What are Channels, Bands & Overlays?
Want the daily routine? Get the free 15-Minute Swing Trader’s Checklist. Get it free →
Bollinger Bands have gained widespread recognition for their ability to incorporate volatility and capture price action, making them a popular tool among Forex traders.
However, several lesser-known technical indicators, such as Donchian channels, Keltner channels, and STARC bands, also offer valuable opportunities for identifying swing action and profitable trades.
These indicators are widely used in the futures and options markets and are well-suited for the vast liquidity and technical nature of the Forex market.
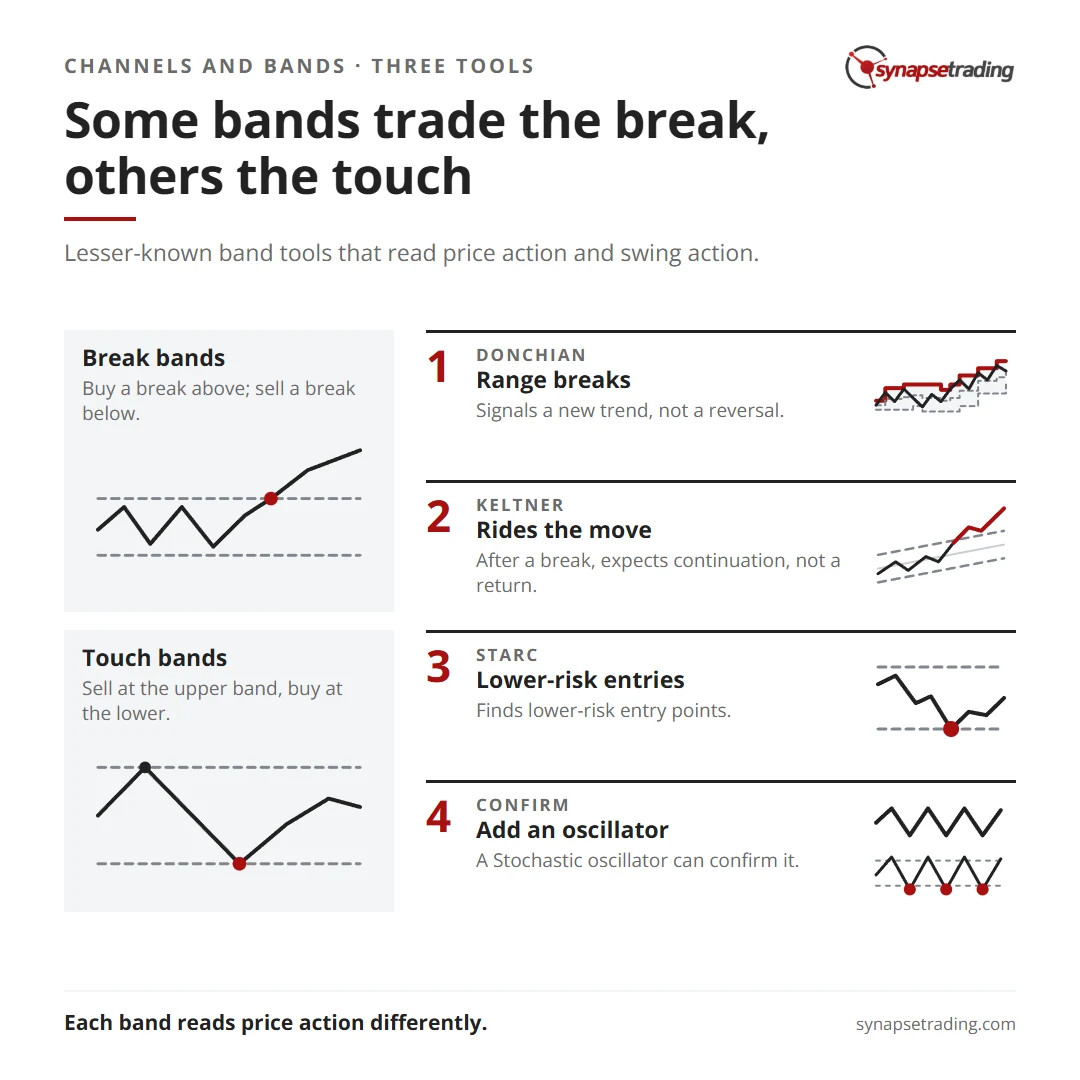
- Donchian channels use a moving average to signal uptrends on upper band breaks and downtrends on lower band breaks.
- Keltner channels rely on the average true range (ATR) or volatility, with breaks above or below the bands indicating potential continuation.
- STARC bands determine high-probability trades: breaking the upper band signals a lower-risk sell, while touching the lower band presents a lower-risk buy opportunity.
Although these band indicators vary in calculation and interpretation, each provides unique insights into price action.
Below is a breakdown of how each of these indicators works and how traders can apply them in the Forex market.
Donchian Channels
Donchian channels are price channel studies available in most charting platforms, useful for both novice and expert traders. Originally designed for the commodity futures market by Richard Donchian, this indicator has found broad application in Forex markets. It aims to capture profitable entries by signaling new trends when price penetrates either the upper or lower band.
Signals:
- Buy (Long): When price breaks above the upper band.
- Sell (Short): When price breaks below the lower band.
Rather than signaling reversals, Donchian channels help identify when a new trend may be emerging.
For instance, if price action surpasses the high range, it may indicate an uptrend. Conversely, if it drops below the low range, a downtrend might be forming.
Example: In a one-hour EUR/USD chart, we observe that price action breaks through the upper band on December 8, signaling a potential long position.
Keltner Channels
Keltner channels, introduced by Chester W. Keltner and later modified by Linda B. Raschke, use ATR to measure volatility and generate trade signals similar to Bollinger Bands.
However, Keltner channels rely on the high and low prices to calculate volatility rather than standard deviation.
Signals:
- Buy (Long): When price breaks above the upper band.
- Sell (Short): When price breaks below the lower band.
These channels favor a continuation of the price movement after breaking the bands rather than expecting a reversal back to the median.
Example: In a daily GBP/JPY chart, the price action breaks above the upper band, signaling the trader to enter a long position.
STARC Bands
STARC bands (Stoller Average Range Channels), developed by Manning Stoller, incorporate volatility into their calculations, similar to Bollinger Bands.
However, they focus on identifying higher-probability trades by highlighting lower-risk sell and buy opportunities.
Signals:
- Sell (High-Risk): When price reaches the upper band.
- Buy (Low-Risk): When price touches the lower band.
STARC bands are particularly useful in helping traders identify lower-risk entry points.
Example: In a NZD/USD chart, price action reaches the upper band, signaling a low-risk sell opportunity. A trader could confirm this with a Stochastic oscillator.
Putting It All Together
Combining band-based indicators such as Donchian channels, Keltner channels, and STARC bands provides a diverse approach to identifying profitable opportunities in the Forex market.
Concluding Thoughts
While Bollinger Bands are widely recognized, lesser-known band indicators like Donchian channels, Keltner channels, and STARC bands offer a different read on price action.
By understanding and incorporating these alternative tools, both novice and experienced traders can diversify their strategies and enhance their ability to capture opportunities in the Forex market.
Want the daily routine? Enter your email for the free 15-Minute Swing Trader's Checklist.
Free 5-page PDF, then occasional trading emails. Education only, not financial advice. Unsubscribe anytime. Kit stores your email in the US: see our privacy policy.
Want to learn the full method? The Trading Mastery Program teaches the 4 strategies I have traded since 2011. It suits beginners and experienced traders.
Rather follow the trades as they happen? Daily Trading Signals is our Telegram channel: my trade ideas with entry, stop and exit, and every trade is public.
Questions about this post? Ask in the free Telegram channel →
Educational content only, not personalised financial advice. Trading carries risk, including loss of capital. Past performance is not indicative of future results. Synapse Trading is not licensed or regulated by MAS.

