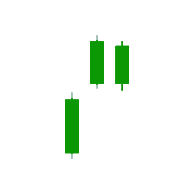
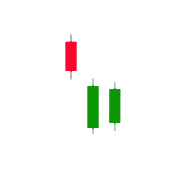
Up Gap Side-by-Side White Lines & Down Gap Side-by-Side White Lines
Join our Telegram channel for more market analysis & trading tips: t.me/synapsetrading
The up/down gap side-by-side white lines is a continuation pattern that can signal the persistence of the current trend, either upward or downward.
While it is a moderately reliable indicator, its rarity and the often muted price movements following its occurrence mean that it should be used in conjunction with other technical analysis tools.
The up version is a large up (white or green) candle followed by a gap and then two more white candles of similar size to each other.
The down version is a large down (black or red) candle followed by two white candles of similar size.
When the pattern occurs, which is rare, it is expected that the price will continue moving in the current trend direction—down or up, as the case may be.
The up gap side-by-side white lines is a bullish continuation pattern with the following characteristics:
The market is in an uptrend.
The first candle is a white candle.
The second candle opens above the close of the first candle (gap up).
The third candle has a real body with the same length as the second candle with an open that’s at the same level or higher than the real body of the first candle.
The down gap side-by-side white lines is a bearish continuation pattern with the following characteristics:
The market is in a downtrend.
The first candle is a black candle.
The second candle is a white candle that opens below the close of the first candle (gap down).
The third candle is a white candle with a real body that’s the same length as the second candle and opens at the same level or lower than the real body of the first candle.
The side-by-side white lines pattern is moderately accurate in predicting a continuation of the current trend, but it is somewhat uncommon.
A continuation occurs 66% of the time.
The pattern doesn’t always produce large price moves.
A little over 60% of the patterns produced a 6% average move in 10 days, and those patterns occurred in downtrends with a downside breakout from the pattern (downtrend continuation).
Patterns occurring in other contexts didn’t have price moves as large, according to Thomas Bulkowski’s candlestick research.
Other chart patterns or technical indicators should be used to confirm the candlestick pattern to maximize the odds of success.
Many traders opt to wait for confirmation from the pattern.
Confirmation is price movement that confirms the expectation of the pattern.
For example, following an up gap side-by-side white lines pattern, a trader may wait for the price to move above the highs of the pattern before initiating a long position.
A stop loss could then be placed below the low of the second or third candle or even the first candle in order to give the trade more room.
The difference between up/down gap side-by-side white lines and a three outside up/down candlestick pattern is that, unlike the former pattern, the latter is a reversal pattern, not a continuation pattern.
In the outside up pattern, a black candlestick is followed by two white candles.
In the outside down pattern, a white candle is followed by two black candles.
Up/Down Gap Side-by-Side White Lines Psychology
Up — Suppose the security is engaged in an uptrend, with confident bulls expecting higher prices.
The first candle shows a rally with a large real body and a close higher than the open.
Bull confidence increases further on the second candle, with an up gap and positive intraday price action that holds a higher high into the closing bell.
Bullish resolve is tested on the third candle, which opens with an initial drop into the opening price of the second candle.
However, the decline fails to gain traction and buyers lift the security back to the high of the second candle by the close.
This reveals diminishing bear power, raising odds for a rally and new high on the next candle.
Down — Suppose the security is engaged in a downtrend, with confident bears expecting lower prices.
The first candle posts a sell-off bar with a large real body and a close lower than the open.
Bear confidence is shaken on the second candle, with a down gap and strong intraday price action that holds below the gap into the closing bell.
Bearish resolve grows on the third candle, which opens with a down gap into the opening price of the second candle.
Once again strong intraday price action fails to pierce gap resistance.
This reveals diminishing bull power, raising odds for a decline and new low on the next candle.
Up/Down Gap Side by Side White Lines Limitations
The pattern is rare, which means finding it and opportunities to use it will be limited.
The pattern has moderate reliability, which means that ideally the candlestick pattern should be coupled with other forms of analysis and confirmed by other trade signals.
Following the pattern, the pattern that tended to produce large price moves was the down gap version occurring in a downtrend.
The pattern served to act as a downtrend continuation pattern.
This pattern, and candlestick patterns in general, don’t provide a price target.
It is up to the trader to determine when they will exit a profitable trade.
Waiting for price confirmation following the pattern is recommended.
 Our flagship mentoring program is suitable for both beginners and advanced traders, covering the 4 strategies which I used over the past 15 years to build up my 7-figure personal trading portfolio.
 If you're looking for a reputable brokerage that covers all products (SG stocks, US stocks, global stocks, bonds, ETFs, REITs, forex, futures, crypto) and has one of the lowest commissions, this is what I currently use.
The Synapse Network is our dedicated global support team, including event managers, research teams, trainers, contributors, as well as the graduates and alumni from all our previous training program intakes.


Leave a Reply
Want to join the discussion?Feel free to contribute!