

The Master Swing Trader Summary: Alan Farley on Pattern Cycles and the 7 Bells
Want the daily routine? Get the free 15-Minute Swing Trader’s Checklist. Get it free →
How Farley maps the market’s repeating phases, where his seven named setups fire, and the risk rule above them all
Published: 22 November 2026 · By Spencer Li, CFTe
Alan Farley’s trading education started with a sheet of paper. He had just found Bollinger Bands. “I spent weeks just staring at them.” He would print a chart, cover the right side, guess where the next bar would print, then slide the paper across to check.
His guesses improved, and he was sure he had cracked it. “I was certain that I had found the secret key to market success. Then I met John Yurko.” Yurko, a technician from an early online forum, told him he was predicting nothing. “I was actually using the chart to read the past,” Farley writes.
That idea grew into The Master Swing Trader, published in 2000. The book argues that markets cycle through the same phases on every chart, from 1-minute bars to monthly ones, and that most of the profit sits at the handover from one phase to the next. Farley calls the map Pattern Cycles. On top of it he builds seven named setups, the 7 Bells, held together by one rule: “never enter a trade without knowing the exit.”
Who is Alan Farley?
The book describes him as “a private trader and publisher of the Hard Right Edge” website. When he wrote it, he had been in the markets “for over 14 years as a private investor, advisor, and author.” He dedicated the book to Yurko, and credits Linda Bradford Raschke, Stan Weinstein and Alexander Elder’s Triple Screen as other sources.
What are the 10 key ideas at a glance?
| Key idea | What it means at the screen |
|---|---|
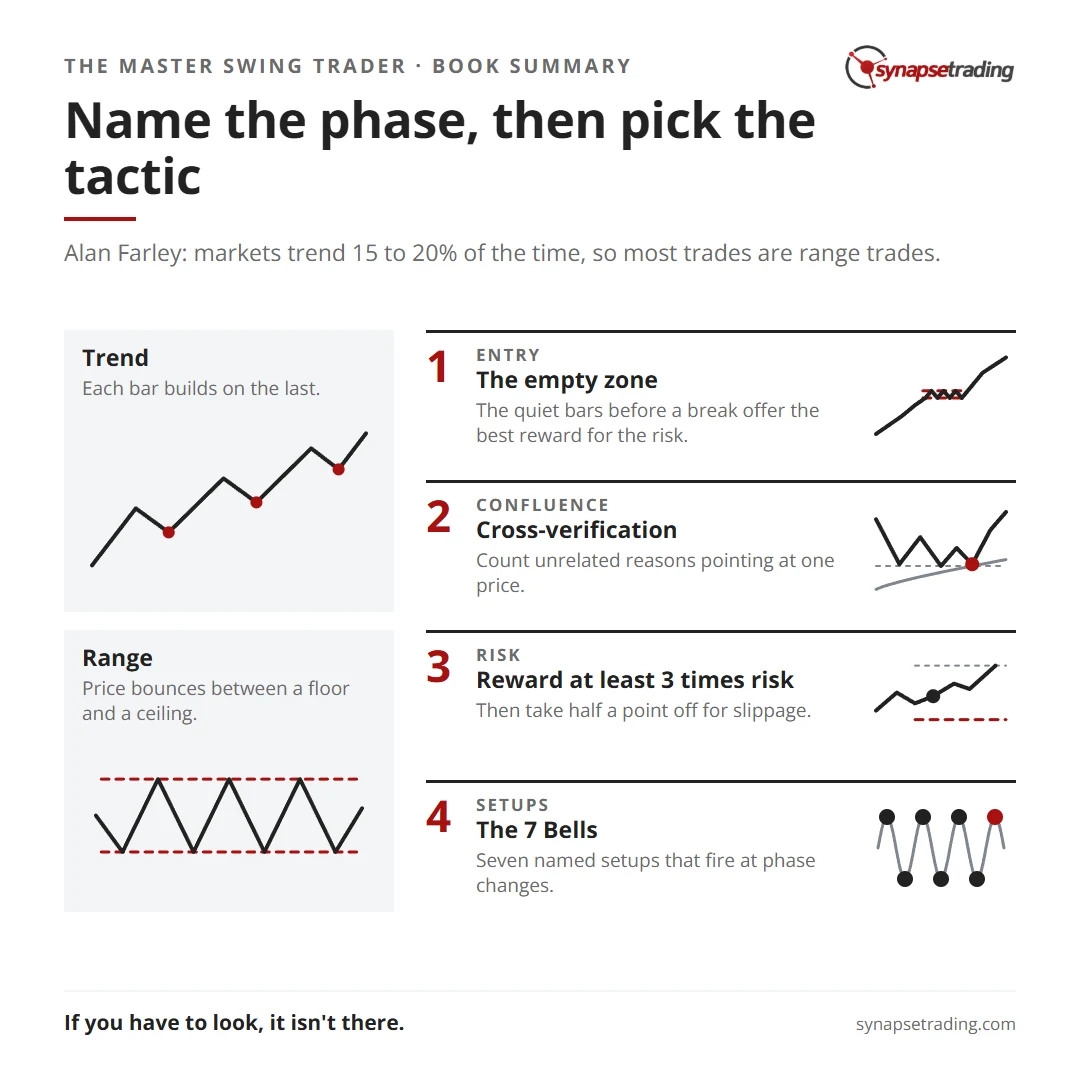
| 1. Markets trend 15 to 20% of the time | Most bars are range, so most trades are range trades |
| 2. Pattern Cycles | Name the phase first, then pick the tactic |
| 3. The empty zone | The quiet bars before a break offer the best reward for the risk |
| 4. Indicators verify the pattern | Price bars first, indicators second |
| 5. Cross-verification | Count unrelated reasons pointing at one price |
| 6. Three time frames | Context above, setup in the middle, timing below |
| 7. Reward at least 3 times risk | Then take half a point off for slippage |
| 8. Know the price that proves you wrong | Skip the trade if it sits far from the entry |
| 9. The 7 Bells | Seven named setups that fire at phase changes |
| 10. Trade in shades of gray | Expect flaws, and distrust a perfect pattern |
Why does Farley say markets trend only 15 to 20% of the time?
Because that number drives the whole book. “Prices trend only fifteen to twenty percent of the time through all equities, derivatives, and indices,” he writes, on every chart from 1-minute to monthly. The rest of the time price sits in a range.
In a trend, each bar builds on the last. In a range, price bounces between a floor and a ceiling. The money is made at the switch. When a range goes quiet, with bars narrowing and volume drying up, he calls the moment before the break “a high-reward empty zone.” The range edge is close, so the risk is small.
Most indicators go flat in exactly that spot. So his standing rule is to “use math-based indicators to verify the price pattern, but not the other way around.” Our post on the best indicators for swing trading gives indicators the same supporting role.
What are Pattern Cycles?
They are Farley’s map of the stages a market repeats. “Pattern Cycles continuously repeat the same stages through all charts and time frames.” Chapter 3 walks them in order: bottoms, breakouts, rallies, highs, tops, reversals and declines.
Each phase gets its own tactic. Two of his matches show the idea:
- “Frequent pullbacks after new breakouts offer low-risk countertrend entry.”
- “Sideways congestion presents fade setups until the empty zone signals the start of a new trend.”
Imagine buying every breakout in a sideways market. The losses feel random. Farley would call them a sound tactic in the wrong phase.
What is cross-verification?
It is Farley’s word for confluence. His glossary defines it as “The convergence of unrelated directional information at a single price level.” The key word is unrelated.
His example is “a hammer candle that strikes an old double top at the bottom of a horizontal Bollinger Band,” which he says “constitutes three unrelated elements.” A candle, a prior high and a volatility band each measure something different. MACD and a moving average do not, since MACD is built from moving averages. In his words, “a setup does not cross-verify when MACD and MAs say the same thing.” Four or more independent reasons at one price earn his top label, CV4.
Then comes the most portable test in the book. Entry to the next barrier is the profit target (PT). Entry to the price that proves the setup wrong is the failure target (FT). “Execute only those trades with high PT and low FT distance.”
How does Farley handle risk?
He starts with the exit. Every setup has a price where the idea is proven wrong, and if that line sits far from the entry, he says to “avoid the trade completely.”
Then he sets a floor for reward. “Seek positions with reward targets that measure at least three times the calculated risk.” Exits are often rushed and cost more than planned, so “one easy method just pulls a half-point off the ratio.” A 3:1 setup on paper becomes 2.5:1.
Now see what that does to the win rate you need. Say you take 10 trades with 2.5R of reward for each 1R of risk, and only 4 work:
4 winners × 2.5R = +10R, and 6 losers × 1R = -6R. You are up 4R.
At that ratio you break even winning about 29% of the time (1 ÷ 3.5). Which fits his flat remark that “Most professional traders have a %WIN under 50%.” His own table makes the trade-off sharper. Win 75% of the time and you can survive an average loss 2.5 times your average win. Win 25% and your average win must be about 6 times your average loss. Our guide on where to put your stop loss and take profit shows how to set both distances from the chart.
Why does Farley use three time frames?
Because one stock can tell three stories at once. Reading one chart and trading another is what he calls a trend relativity error: “Trend relativity errors steal more profits than any other trading mistake.”
His answer is 3D charting. “Identify three time frames that correspond to the chosen holding period.” For a one-to-three-day hold, he judges reward on the daily chart and executes on 60-minute bars. Our post on combining price action with multiple timeframes walks through the same layering.
What are the 7 Bells?
They are Farley’s own setup library, each printed with a one-line thesis:
- Dip Trip. “Price That Moves against a Strong Trend Will Rebound Sharply.”
- Coiled Spring. “Constricted Price Gives Way to Directional Movement.”
- Finger Finder. “Candles Flag Reversals in the Next-Smaller Time Frame.”
- Hole-in-the-Wall. “Gap Downs after Strong Rallies Signal a Trend Change.”
- Power Spike. “High-Volume Events Print the Future Direction of Price.”
- Bear Hug. “Weak Markets Drop Quickly after Rallying into Resistance.”
- 3rd Watch. “Breakouts through Triple Tops Signal Major Uptrends.”
Set them side by side and three ideas keep coming back. Buy a controlled pullback in a live trend. Trade the expansion out of a squeeze. Fade or follow a failure at a well-tested level.
Farley is honest about their limits. “Remember that 7-Bells represent setups that may never happen.” The Bells began as nightly scans, and our guide on how to find stocks to swing trade covers the screener settings that do the first cut.
What does the book not tell you?
Three things.
How today’s markets work. Farley wrote in 2000, in the dot-com day-trading boom, so prices are quoted in fractions and the execution chapter is built on Level II screens that have since changed. The chart reading survives.
Whether the numbers hold. The Dip Trip chapter says “The disciplined swing trader may profit on 60–75% of all positions,” with no trade log behind it. The reward-to-risk figures per setup run from roughly 1.5:1 to 10:1, each read off one example chart from 1999 or 2000.
Every setting. Bollinger Bands, the moving-average ribbons and MACD come with exact settings. Some oscillators he leans on do not. And since swing trading “does not require mechanical models or systems,” in his view, the method is hard to backtest as written.
Where the human edge comes in
Much of this book fits in a scanner. Narrow-range bars, a pullback to the 50% retracement, a volume spike, price above the 200-day average. Farley published his own scans.
But his Thirty Rules, which close the book, keep pointing at what a scanner cannot judge. “If you have to look, it isn’t there.” And against every textbook chart, he asks you to “Demand warts and bruises on your trade setups.” When everyone sees the same clean pattern, the crowd trades it the same way and gets faded. “Look closely for failure when perfection appears.”
A scanner can hand you the candidate. Telling a useful flaw from a warning to stay out is still a person’s call, learned one chart at a time.
When should you read The Master Swing Trader?
After the basics. Farley assumes you know support and resistance, candlesticks and moving averages, and adds around thirty terms of his own.
It sits in the trend following and swing trading section of my reading list. My own copy is heavily marked. The marks cluster on entries and exits, like cross-verification and his line to “enter in mild times but exit in wild times.” For the wider shelf, see the best investing and trading books of all time.
Concluding thoughts
The Master Swing Trader is a dense book built on one habit: know which phase the market is in before you pick a trade.
For the mindset his call to “trade in shades of gray” demands, read our Trading in the Zone summary. For the three-screen idea behind his 3D charting, see our summary of Trading for a Living.
So look back at your last losing swing trade. Which phase was the market in, and which phase was your setup built for?
FAQ
What is The Master Swing Trader about?
It is Alan Farley’s 2000 guide to short-term swing trading. It maps the phases markets repeat, which he calls Pattern Cycles, and gives seven named setups, the 7 Bells, that trade the handover from one phase to the next.
What are Alan Farley’s 7 Bells?
Dip Trip, Coiled Spring, Finger Finder, Hole-in-the-Wall, Power Spike, Bear Hug and 3rd Watch. Each comes with its own entry, stop and exit rules.
Is The Master Swing Trader still useful today?
The chart reading, cross-verification and risk rules still apply. The execution chapter is dated, since it was written for the trading systems of 2000.
Go deeper
Farley’s first rule is to know the exit before you enter. The free 15-Minute Swing Trader’s Checklist builds that habit into a daily routine: the scan, the questions to ask before you enter, and the five rules that keep you in the game. You can get it at the end of this post.
About the author. Spencer Li is The 15-Minute Trader and the founder of Synapse Trading. He is a Certified Financial Technician (CFTe) with 15+ years of trading, run from 70+ countries. He holds a B.Acc and B.BM from SMU. Every trade he takes is public, dated, losses left in. He teaches rules-based swing trading in 15 minutes a day, one system for any market.
Educational content only, not personalised financial advice. Trading carries risk, including loss of capital. Past performance is not indicative of future results. Synapse Trading is not licensed or regulated by MAS.
Want the daily routine? Enter your email for the free 15-Minute Swing Trader's Checklist.
Free 5-page PDF, then occasional trading emails. Education only, not financial advice. Unsubscribe anytime. Kit stores your email in the US: see our privacy policy.
Want to learn the full method? The Trading Mastery Program teaches the 4 strategies I have traded since 2011. It suits beginners and experienced traders.
Rather follow the trades as they happen? Daily Trading Signals is our Telegram channel: my trade ideas with entry, stop and exit, and every trade is public.
Questions about this post? Ask in the free Telegram channel →
Educational content only, not personalised financial advice. Trading carries risk, including loss of capital. Past performance is not indicative of future results. Synapse Trading is not licensed or regulated by MAS.