• Link to Facebook
  • Link to X
  • Link to Instagram
  • Link to Youtube
  • Link to LinkedIn
  • Link to Mail
Synapse Trading
  • Home
  • About
    • My Background
    • My Trading Journey
    • My Travel Log
    • Media & Interviews
  • Mentoring
    • Trading Mastery Program
    • Results & Testimonials
  • Signals
    • Telegram (Free to join!)
    • Daily Trading Signals
    • Daily Trading Signals (Results)
  • Resources
    • Free Trading Guides
    • Tools & Resources
    • Blog & Infographics
  • Contact
    • Contact Us
    • Partnership Opportunities
  • Click to open the search input field Click to open the search input field Search
  • Menu Menu

Tag Archive for: bonds

Spencer Li

How to Buy US T-Bills (USD) on Interactive Brokers (IBKR)

Promotions, Tools & Resources

Recently, many people have been asking me how to buy US T-Bills (USD), since the yields are currently above 4.5%, so I have put together this simple guide.

I am using Interactive Brokers to make the transactions, so if you do not have an account, the first step is to open an Interactive Brokers account.


Once you have an account, log into the “Trader Workstation”, which is a software you can download for free.

When setting up for account, you also need to make sure you have activated permissions to trade bonds. You can do so by indicating the maximum experience for bonds.
Screenshot 2022 10 13 at 12 23 58 AM

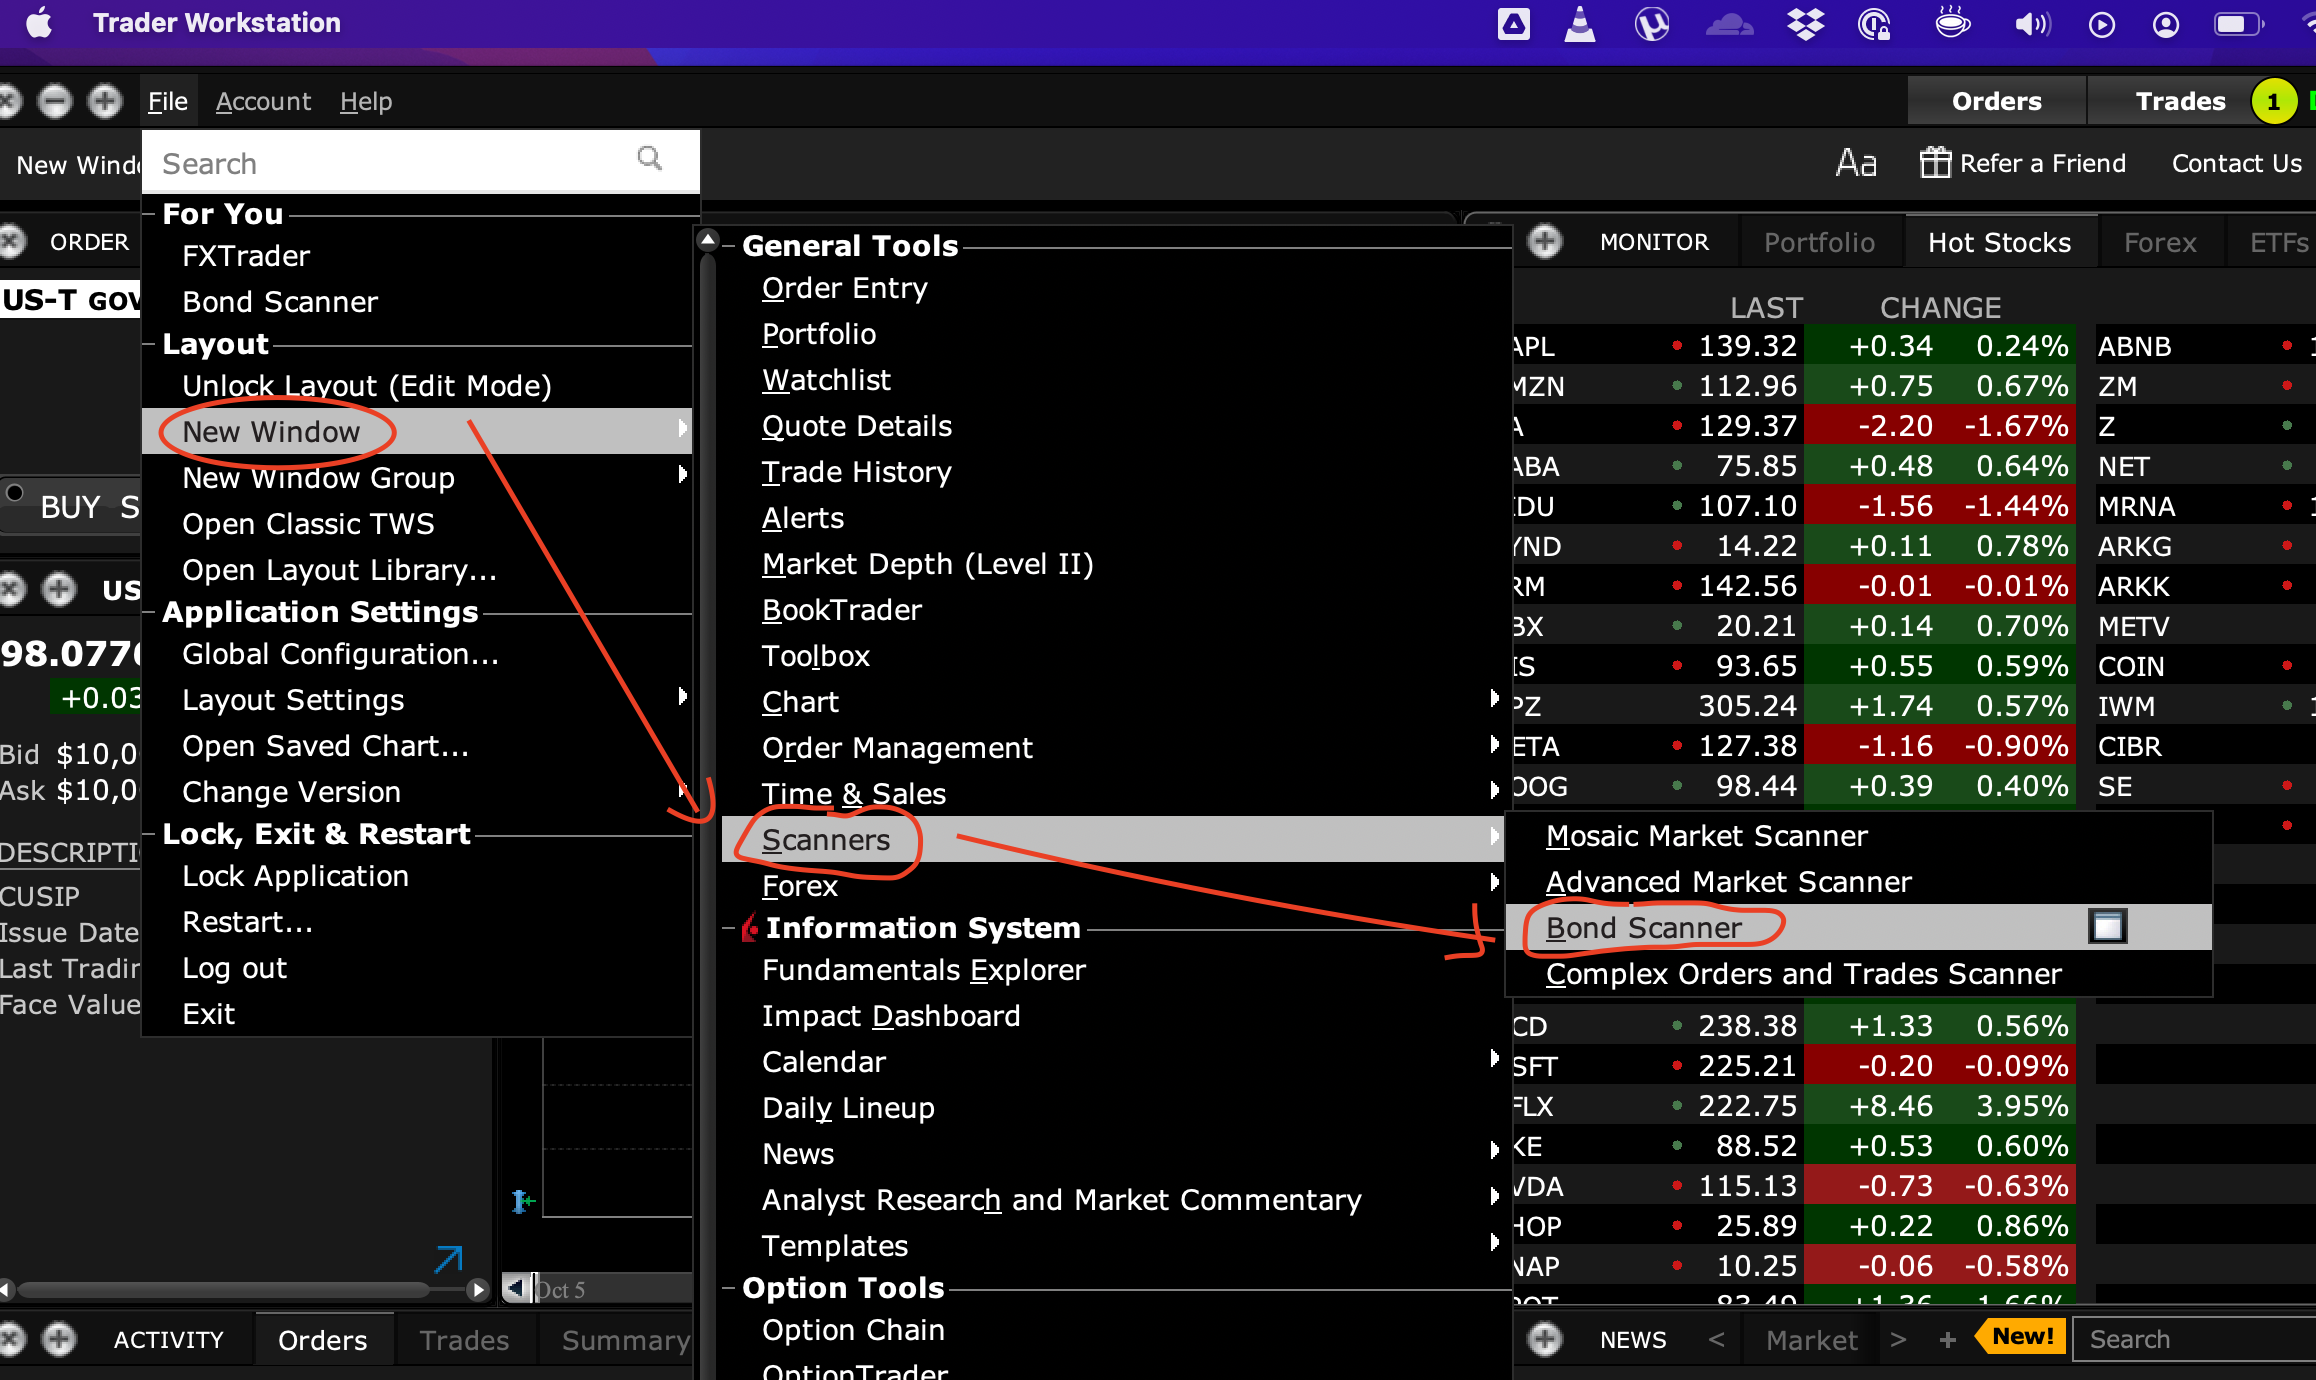
Select “New Window” > “Scanners” > “Bond Scanner” to open the page for bonds.


Screenshot 2022 10 13 at 12 27 32 AM

Next, select “US Treasuries” and check the box which says “T-Bills” on the right side. Click the “Search” button at the top to filter.

You will see all the T-Bills available. The maturity date is the date which the T-bill expires.

If you want 3 months, then it will be roughly today’s date + 3 months (13 Jan 2023).
If you want 6 months, then it will be roughly today’s date + 6 months (13 Apr 2023).
 

Screenshot 2022 10 13 at 12 32 03 AM

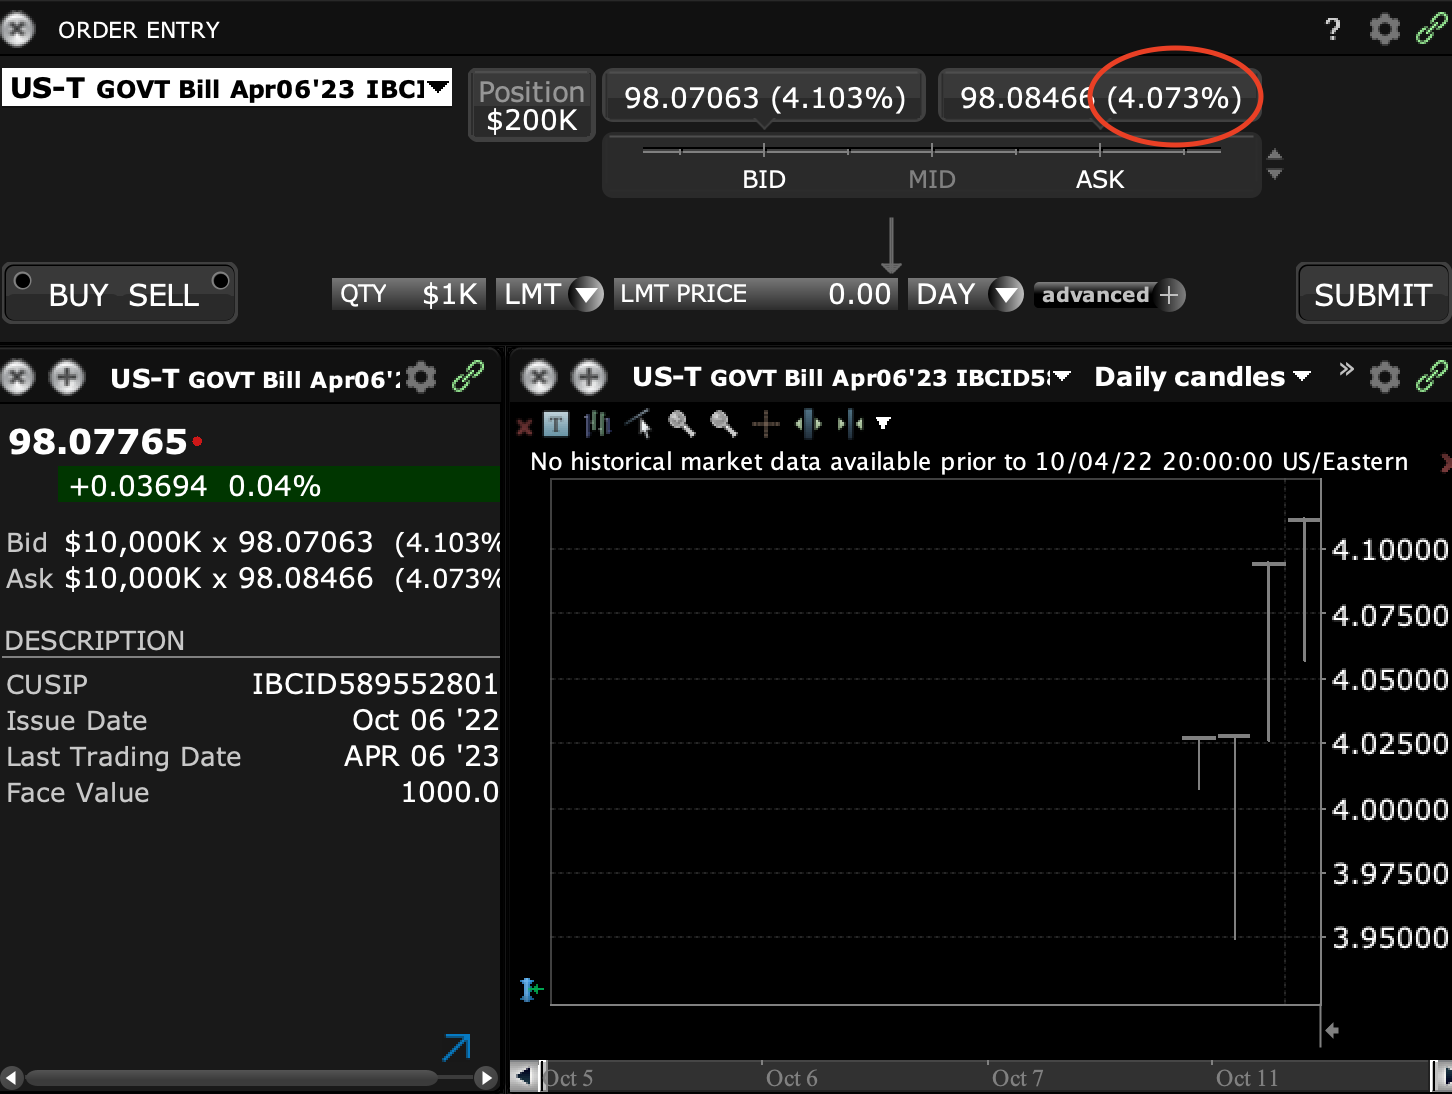
Click on the one which you want to buy, and come to the trading screen.

For this example, I picked the Apr06’23 which is about 6 months. You can see that the yield is 4.073% at the current price.

The way it works is that you buy it at $98.08466, and over time the price will increase as it nears maturity date (in 6 months).

Upon maturity, it will become $100, and it will be liquidated at that price.

You can also sell it before it reaches maturity.


Give its short duration, T-Bills do not fluctuate much in price, so in a sense it is almost as stable as holding cash, because it can easily be liquidated any time.

However, compared to cash, you can now get a 4.5% return on these “spare cash”, while waiting to deploy it in the stock market.

0 Comments/by Spencer Li
https://synapsetrading.com/wp-content/uploads/2019/10/logo.jpg 0 0 Spencer Li https://synapsetrading.com/wp-content/uploads/2019/10/logo.jpg Spencer Li2022-11-27 19:38:442023-05-03 23:36:36How to Buy US T-Bills (USD) on Interactive Brokers (IBKR)
Spencer Li

Is the Stock Market Heading for a Correction? (While Bitcoin Surges…)

Market Analysis
is the market heading for a correction thumbnail

After the sharp run-up in stocks from last year’s March lows, some people are starting to wonder if the market has got a bit too bubbly.

In this post, we will compare the different stock indices, as well as some other products, to see if there are any good opportunities.


The Meteoric Rise of Bitcoin

Meteoric Rise of Bitcoin

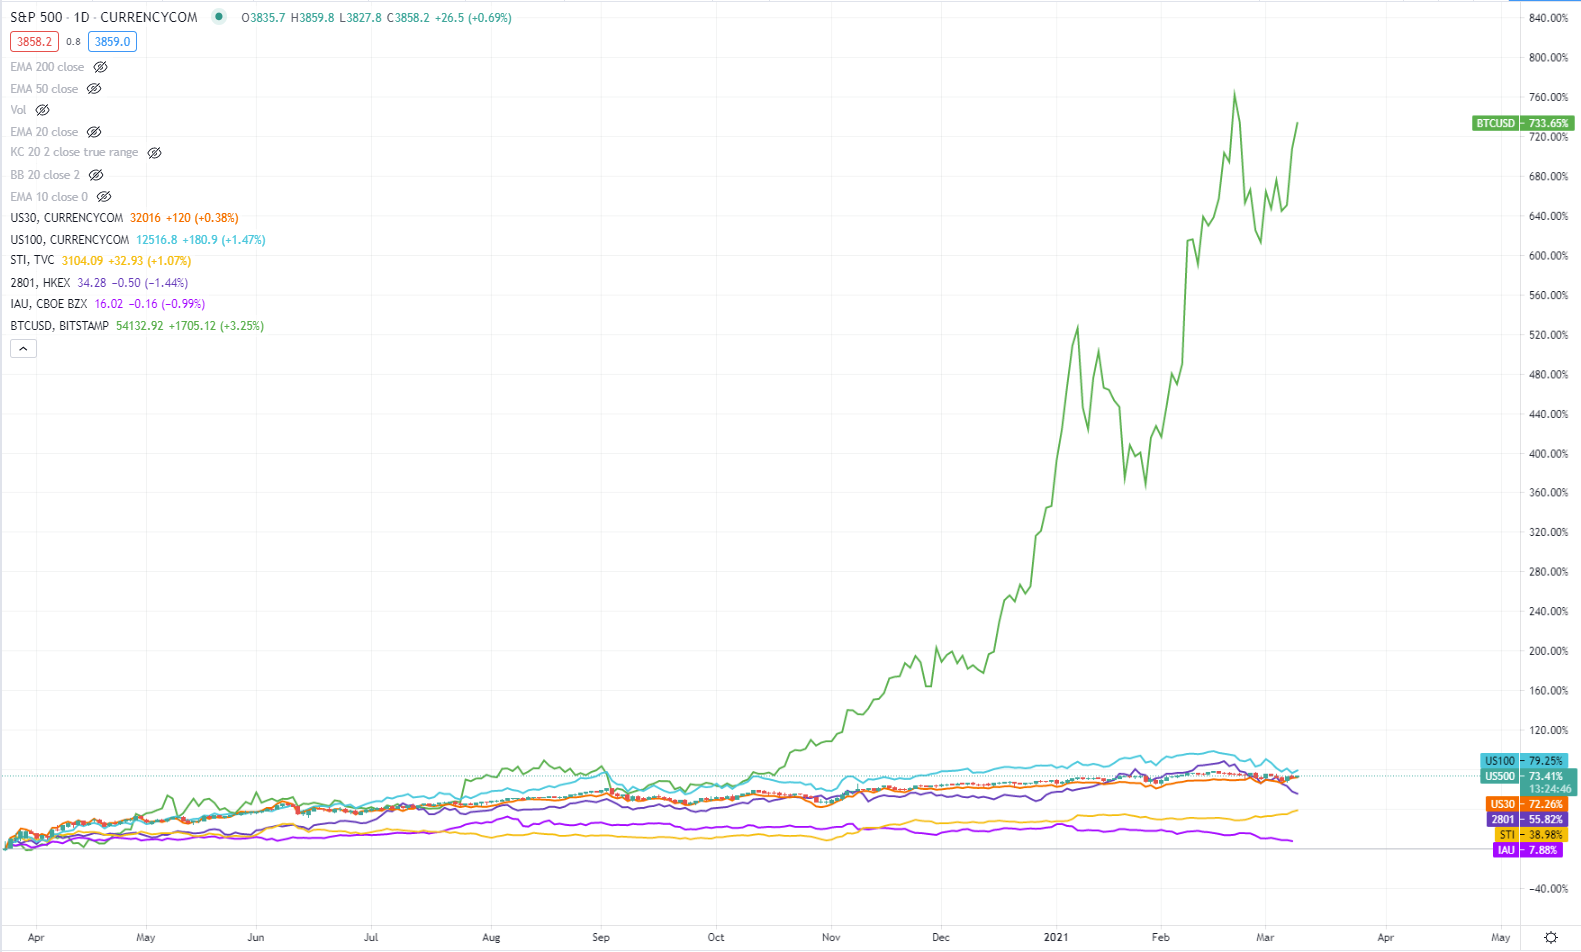
When placed on the same scale, the epic 700+% returns on Bitcoin (BTC/USD) dwarfs everything else, and has also provided some of the best returns for my portfolio last year.

Looking at its strong trend, it does look like there are a few more legs for it to go, so I will hold onto it for now.

To see the rest of the products, I will now remove Bitcoin from this comparison.


Overview of Various Markets


Overview of Various Markets


The top 3 you see are the 3 indices of the US stock market, and the one in candles is the S&P 500. The other 2 are the Dow Jones Index and the NASDAQ.

The Nasdaq had the sharpest recovery at the start, but the other 2 recently caught up, especially in the last few weeks where the NASDAQ corrected sharply.

So in terms of percentage recovery, all 3 indices are roughly at the same level.

Next if we look at the line in dark purple (2801), which is one of the China Stock ETFs which I invest in, it had a good run, and just earlier this year it was on par with the NASDAQ.

However, in recent weeks, it has corrected sharply and is now below the 3 US stock indices.

The STI Index (Singapore market) was pretty much lackluster last year, but has picked up in recent months, making it one of the top performing stock markets this year.

The last line on the chart is Gold (one of the Gold ETFs to be specific), and it seemed to have hit its recent peak in August last year.


Will Rising Rates Kill the Stock Market?


Kill the Stock Market


Historically, rising yields have led to recessions, but the lag time could be years, so it’s not like we won’t be able to see it coming as it happens.


Kill the Stock Market 2

Kill the Stock Market 3


Looking at the charts of bond prices (which are an inverse of interest rates), we can see that it peaked around the same time the stock market bottomed (March 2020), and in recent weeks has been dropping faster.

This in itself it not necessarily a bearish indication for stocks, because it is more of a sign of potential rising inflation, but as long as inflation remains low, then it may not necessarily be bad for stock prices.

Which means the best way is still to check out the charts of the stock indices.


Chart Analysis of S&P 500


Chart Analysis of S&P 500

Chart Analysis of S&P 500 2

In summary, the stock indices are currently trading within a sideways range after a long run-up, so it won’t be surprising if there is some medium-term correction before the trend continues.

Stay tuned for more real-time market updates in our Telegram channel:
?? https://t.me/synapsetrading

0 Comments/by Spencer Li
https://synapsetrading.com/wp-content/uploads/2021/03/is-the-market-heading-for-a-correction-thumbnail.jpg 720 1280 Spencer Li https://synapsetrading.com/wp-content/uploads/2019/10/logo.jpg Spencer Li2021-03-09 17:28:412022-03-08 12:00:43Is the Stock Market Heading for a Correction? (While Bitcoin Surges…)

Free Trading Guides

Free Trading Guides

Blog Categories

  • Beginner's Guide
  • Blockchain & Crypto
  • Book Summaries
  • Economics & News Trading
  • Investing & Portfolio Management
  • Living Your Best Life
  • Market Analysis
  • Markets & Products
  • News & Events
  • Promotions
  • Risk & Money Management
  • Stock Trading
  • Technical Analysis & Price Action
  • Testimonials
  • Tools & Resources
  • Trading Psychology
  • Trading Strategies
  • Trading Tips
  • Travel & Lifestyle

Free Trading Guides

Free Trading Guides

Contact Us

Synapse Trading Pte Ltd
Registration No. 201316168H

Whatsapp: +65-8897-1204
Telegram: @iamrecneps
Email: info@synapsetrading.com

Links

Disclaimer
Privacy policy
Terms & Conditions
Contact us
Partnerships

© 2012-2024 Synapse Trading | All rights reserved | - powered by Enfold WordPress Theme
  • Link to Facebook
  • Link to X
  • Link to Instagram
  • Link to Youtube
  • Link to LinkedIn
  • Link to Mail
Scroll to top Scroll to top Scroll to top