On Neck Pattern
Join our Telegram channel for more market analysis & trading tips: t.me/synapsetrading
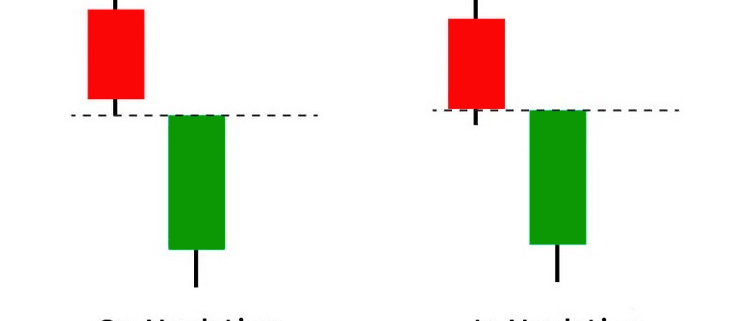
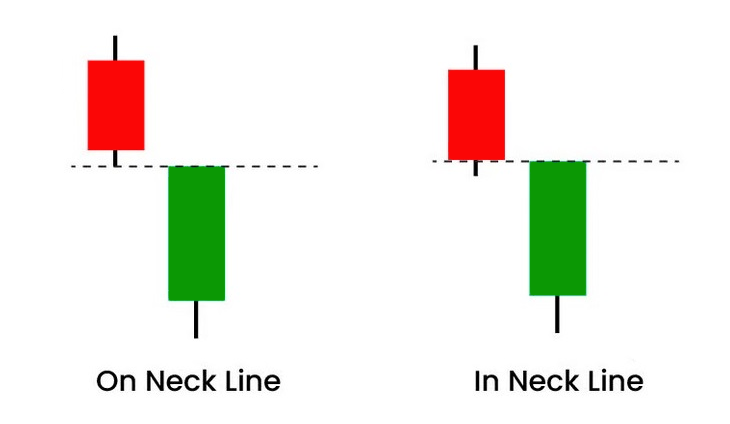
The on neck pattern occurs when a long real-bodied down candle is followed by a smaller real-bodied up candle that gaps down on the open but then closes near the prior candle’s close.
The pattern is called a neckline because the two closing prices are the same (or almost the same) across the two candles, forming a horizontal neckline.
The pattern is theoretically considered a continuation pattern, indicating that the price will continue lower following the pattern.
In reality, that only occurs about half the time.
Therefore, the pattern also often indicates at least a short-term reversal higher.
The on neck pattern occurs during a downtrend, or a pullback within an uptrend, when a bearish candle with a long real body is followed by a smaller bullish candle that fails to close above the bearish candle’s close.
The small bullish candle could take any number of forms, such as a doji, rickshaw man, or any bull candle with a smaller real body than the prior candle, but the closing prices of the two candles should be equal or nearly equal.
The pattern shows bulls attempting a rally that ends up fizzling out on the second candle, unable to push the close above the prior candle’s close.
Theoretically, it is expected that the price will continue lower following the pattern.
According to the Encyclopedia of Candlestick Charts by Thomas Bulkowski, the price only continues to the downside 56% of the time.
The rest of the time it will be acting as a reversal pattern to the upside.
Bulkowski’s study found that while the price did tend to continue lower more often, when the price did reverse to the upside, the ensuing move was larger.
Therefore, traders may prefer to actually watch for a move higher following the pattern to signal an upside reversal.
These types of up moves tend to be slightly larger than declines that follow the pattern.
Traders should use the on neck pattern in conjunction with other forms of technical analysis, such as chart patterns or technical indicators.
This is because the pattern could result in a move in either direction, so confirming data may help signal which direction that is likely to be.
Traders also have the option of waiting for confirmation candles.
Confirmation candles are the candles that follow the pattern, moving either up or down, alerting the trader which direction the price could move further.
For example, if the pattern forms and then the price drops below the low of the second candle, that could be interpreted as confirmation that the price is heading lower.
In the psychology behind the on neck pattern, the security is engaged in a primary downtrend or a major pullback within a primary uptrend.
The first candle posts a long black real body.
This weak price action increases bearish complacency while forcing weakened bulls into full retreat.
The security gaps down on the second candle and sells off to a new low, but buyers take control and are able to lift the price to the prior close but not above it.
The bears see that the bulls lacked the power to push the price above the prior close.
The theory is that the bears will take control over the next several candles, pushing the price lower.
However, as discussed, in reality, this only occurs about half the time.
Thus the pattern puts both bears and bulls on edge, resulting in essentially a coin flip as to whether prices will go higher or lower following the pattern.
An example of the on neck pattern can be seen on the daily chart of Apple Inc. (AAPL), where two on neck patterns occurred during pullbacks within an overall uptrend.
In this case, the price proceeded higher following the pattern.
Once the price started to move up following the pattern, a stop loss could be instituted below the pattern to control risk in the event the price started to decline again.
The difference between the on neck pattern and counterattack lines lies in their structure.
Counterattack lines are very similar to the on neck pattern, except that with counterattack lines the down candle and up candle have real bodies of similar size.
In the on neck pattern, the second candle is smaller.
In theory, the on neck pattern is a continuation pattern, while counterattack lines are a reversal pattern.
However, the on neck pattern has its limitations.
Following the pattern, the price could move higher or lower with nearly equal odds.
Moves to the upside following the pattern tend to be larger than moves to the downside.
Trading based on the pattern could result in any number of variations.
While a breakout lower is relatively easy to define as a drop below the low (or close) of the second candle, the trader will need to decide if they view a move above the high (or close) of the second candle or first candle as the breakout point higher.
A method of profit-taking must be devised as the candlestick pattern doesn’t have an inherent profit target.
The pattern is best used in conjunction with confirming evidence from other technical indicators and methods.
 Our flagship mentoring program is suitable for both beginners and advanced traders, covering the 4 strategies which I used over the past 15 years to build up my 7-figure personal trading portfolio.
 If you're looking for a reputable brokerage that covers all products (SG stocks, US stocks, global stocks, bonds, ETFs, REITs, forex, futures, crypto) and has one of the lowest commissions, this is what I currently use.
The Synapse Network is our dedicated global support team, including event managers, research teams, trainers, contributors, as well as the graduates and alumni from all our previous training program intakes.


Leave a Reply
Want to join the discussion?Feel free to contribute!