Market analysis, insights and trading ideas on various markets and products!

When it comes to intraday trading, quite often the big move can comes from a single currency, and if we time our entry right, the risk can be very small while the profit potential remains large.

In this case, most traders using technical analysis will notice the obvious double top breakdown. However, it does not mean we can jump straight in with a short. Since we know that this is a type 4 range (this part is taught during our training program), we will wait patiently for a pullback before entering.

This enables us to keep risk small, making our intraday trading safe, as we will not see huge fluctuations in our P&L unlike gambling/punting, which lacks the consistency of daily recurring profits.

audusd 210813 h1

audusd 210813 h1 2

The first chart we see with the huge complex descending triangle at the top is the weekly chart of Gold, which we were calling for shorts a couple of months ago.
https://synapsetrading.com/gold-our-big-short-trade-of-the-year/

From there, Gold plunged more than $400 (ahh… the ol’ good days of easy money shorting Gold), and subsequently staged a strong rebound of about $200. Based on the price action, we have enough clues to know that the big players will be looking for an opportunity to resume their selling, which could begin anytime they feel that prices have retraced sufficiently.

gold 190813 w1

Now we zoom in to the daily chart, and we noticed that Gold still looks pretty bullish, judging by the lack of any selling pressure… yet. I will be monitoring this closely so that I can find the perfect time to short Gold again. When the time is ripe, I will share with my students. Don’t forget to shore up your capital to get ready for this big short!

gold 190813 d1

For my event on Thursday, I noticed that out of the 70 sign-ups, a few were duplicates, and there might be some last minute cancellations, so after tidying up, there are 2-3 new slots open for grabs. First come first serve. https://www.eventbrite.sg/event/7760228051?ref=ecal 

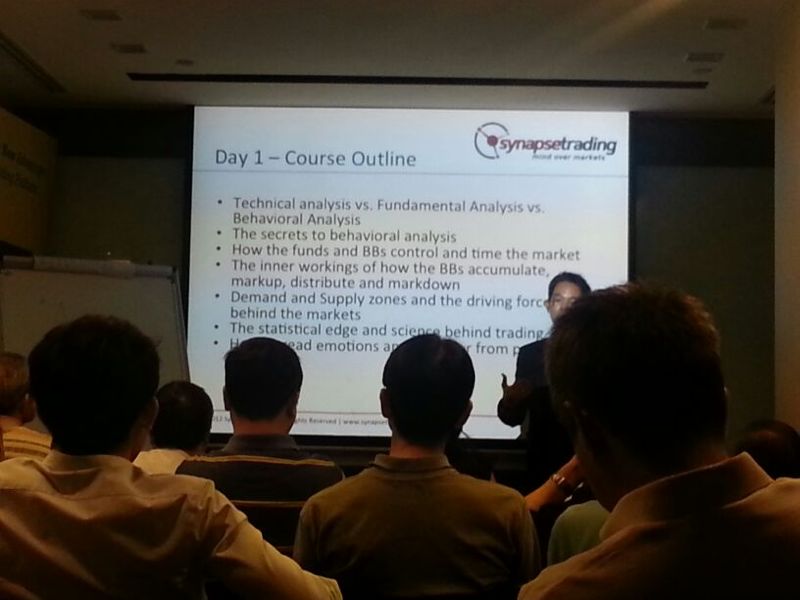
After the trading workshop yesterday, I gave everyone the forex daily 35 pips challenge, and today I traded with some of my students to show them it can be done.  On every trading day, a major pair like the EUR/USD typically has a conservative trading range of roughly 70 pips, so the challenge is to make 35 pips a day consistently. While this might seem insignificant when people try to punt/gamble for once-off big gains, the power of consistency must not be underestimated.

A trader who starts off trading a measly 0.5 standard lots will be making 0.5 x 35 x US$10 = US$175 a day, which adds up to roughly US$3,500 a month, comparable to most full-time jobs. Not bad for a few trades a day! A trader who progress to 3 standard lots will be making 3 x 35 x US$10 = US$1,050 a day, which adds up to roughly US$20,000 a month, comparable to a high-end job in the financial sector. If a trader then progresses to trading 10 standard lots,… well I leave you to work out the math.

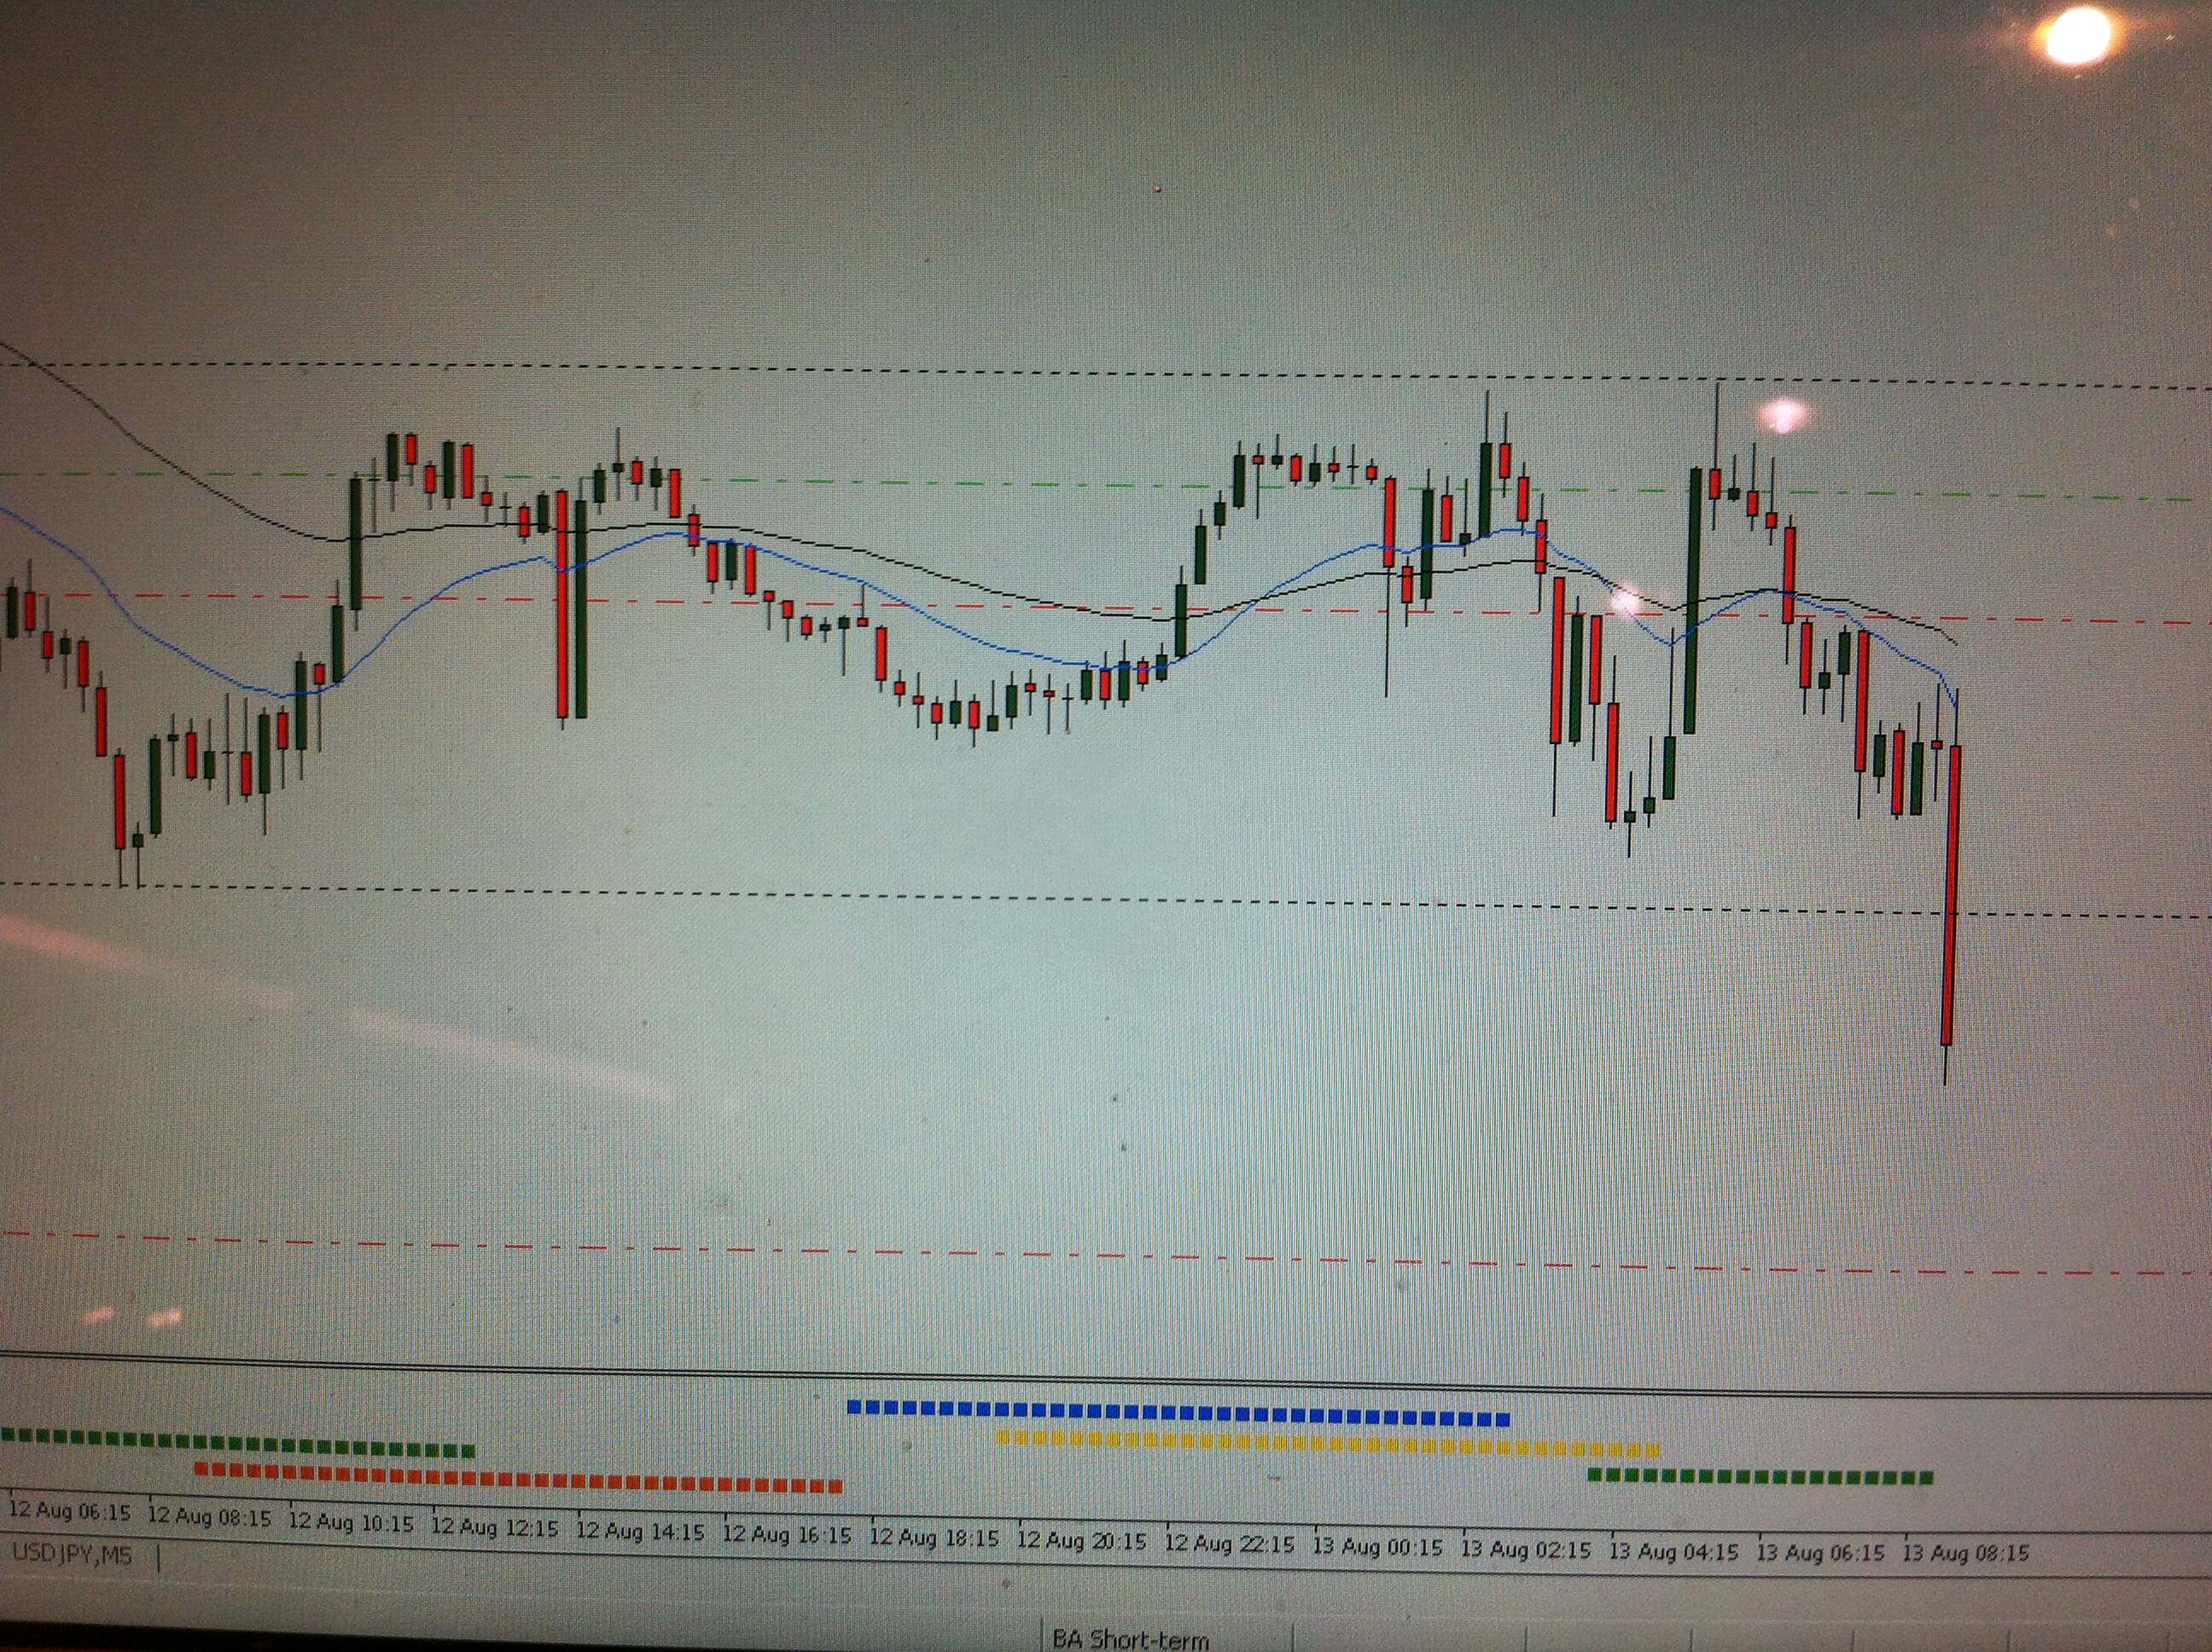
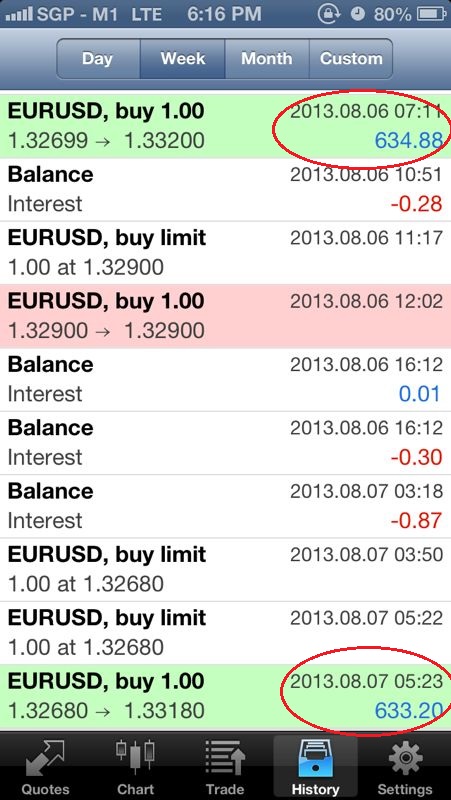
For today, the trading range was 83 pips, and I managed to catch 68 pips, and trailed my stops for a small portion of my profits. This was done in just ONE GOOD TRADE, well-timed with precision and accuracy. I have highlighted the sequence of steps from trade entry to exit, as well as how I managed my risk and trailed my stops.  Of course, my students were following me live as I made these trades.

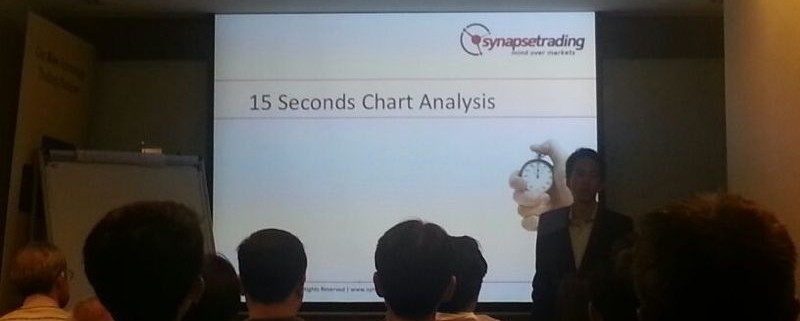
For those who are interested to hear me share more about how I always make such accurate entries by reading blank charts, I will be revealing how intraday trading can be done at a relaxed pace. https://www.eventbrite.sg/event/7760228051?ref=ecal 

2013-08-13 17.01.02
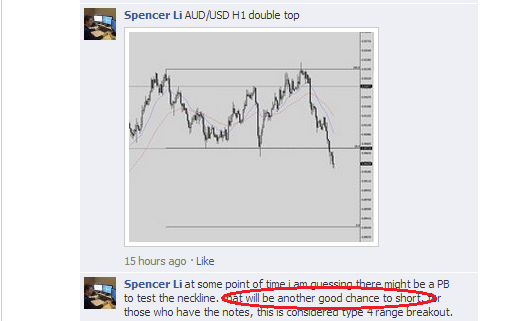
Forex trading strategies – Waiting patiently for a good setup

2013-08-13 17.01.30Checking the economic calendar for major forex news

2013-08-13 17.59.09
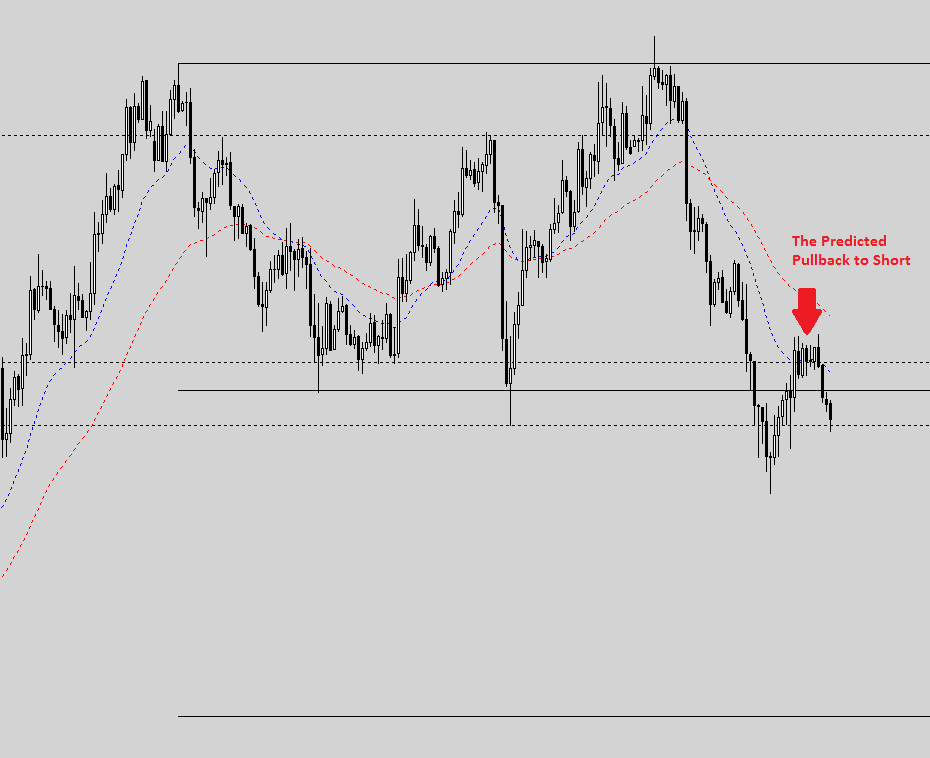
Pin-point entry using one of our price action forex trading strategies – No technical analysis or indicators required

2013-08-13 19.22.40
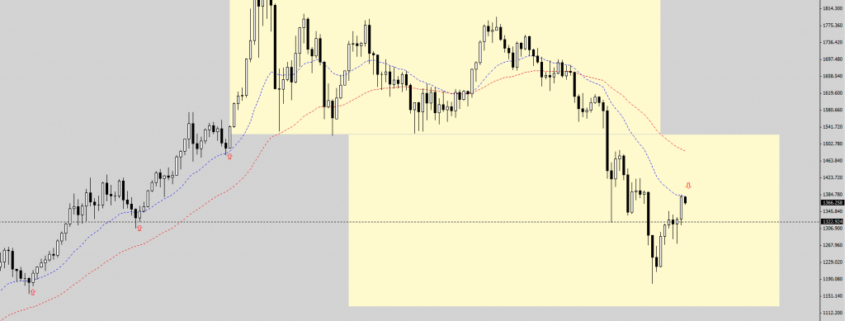
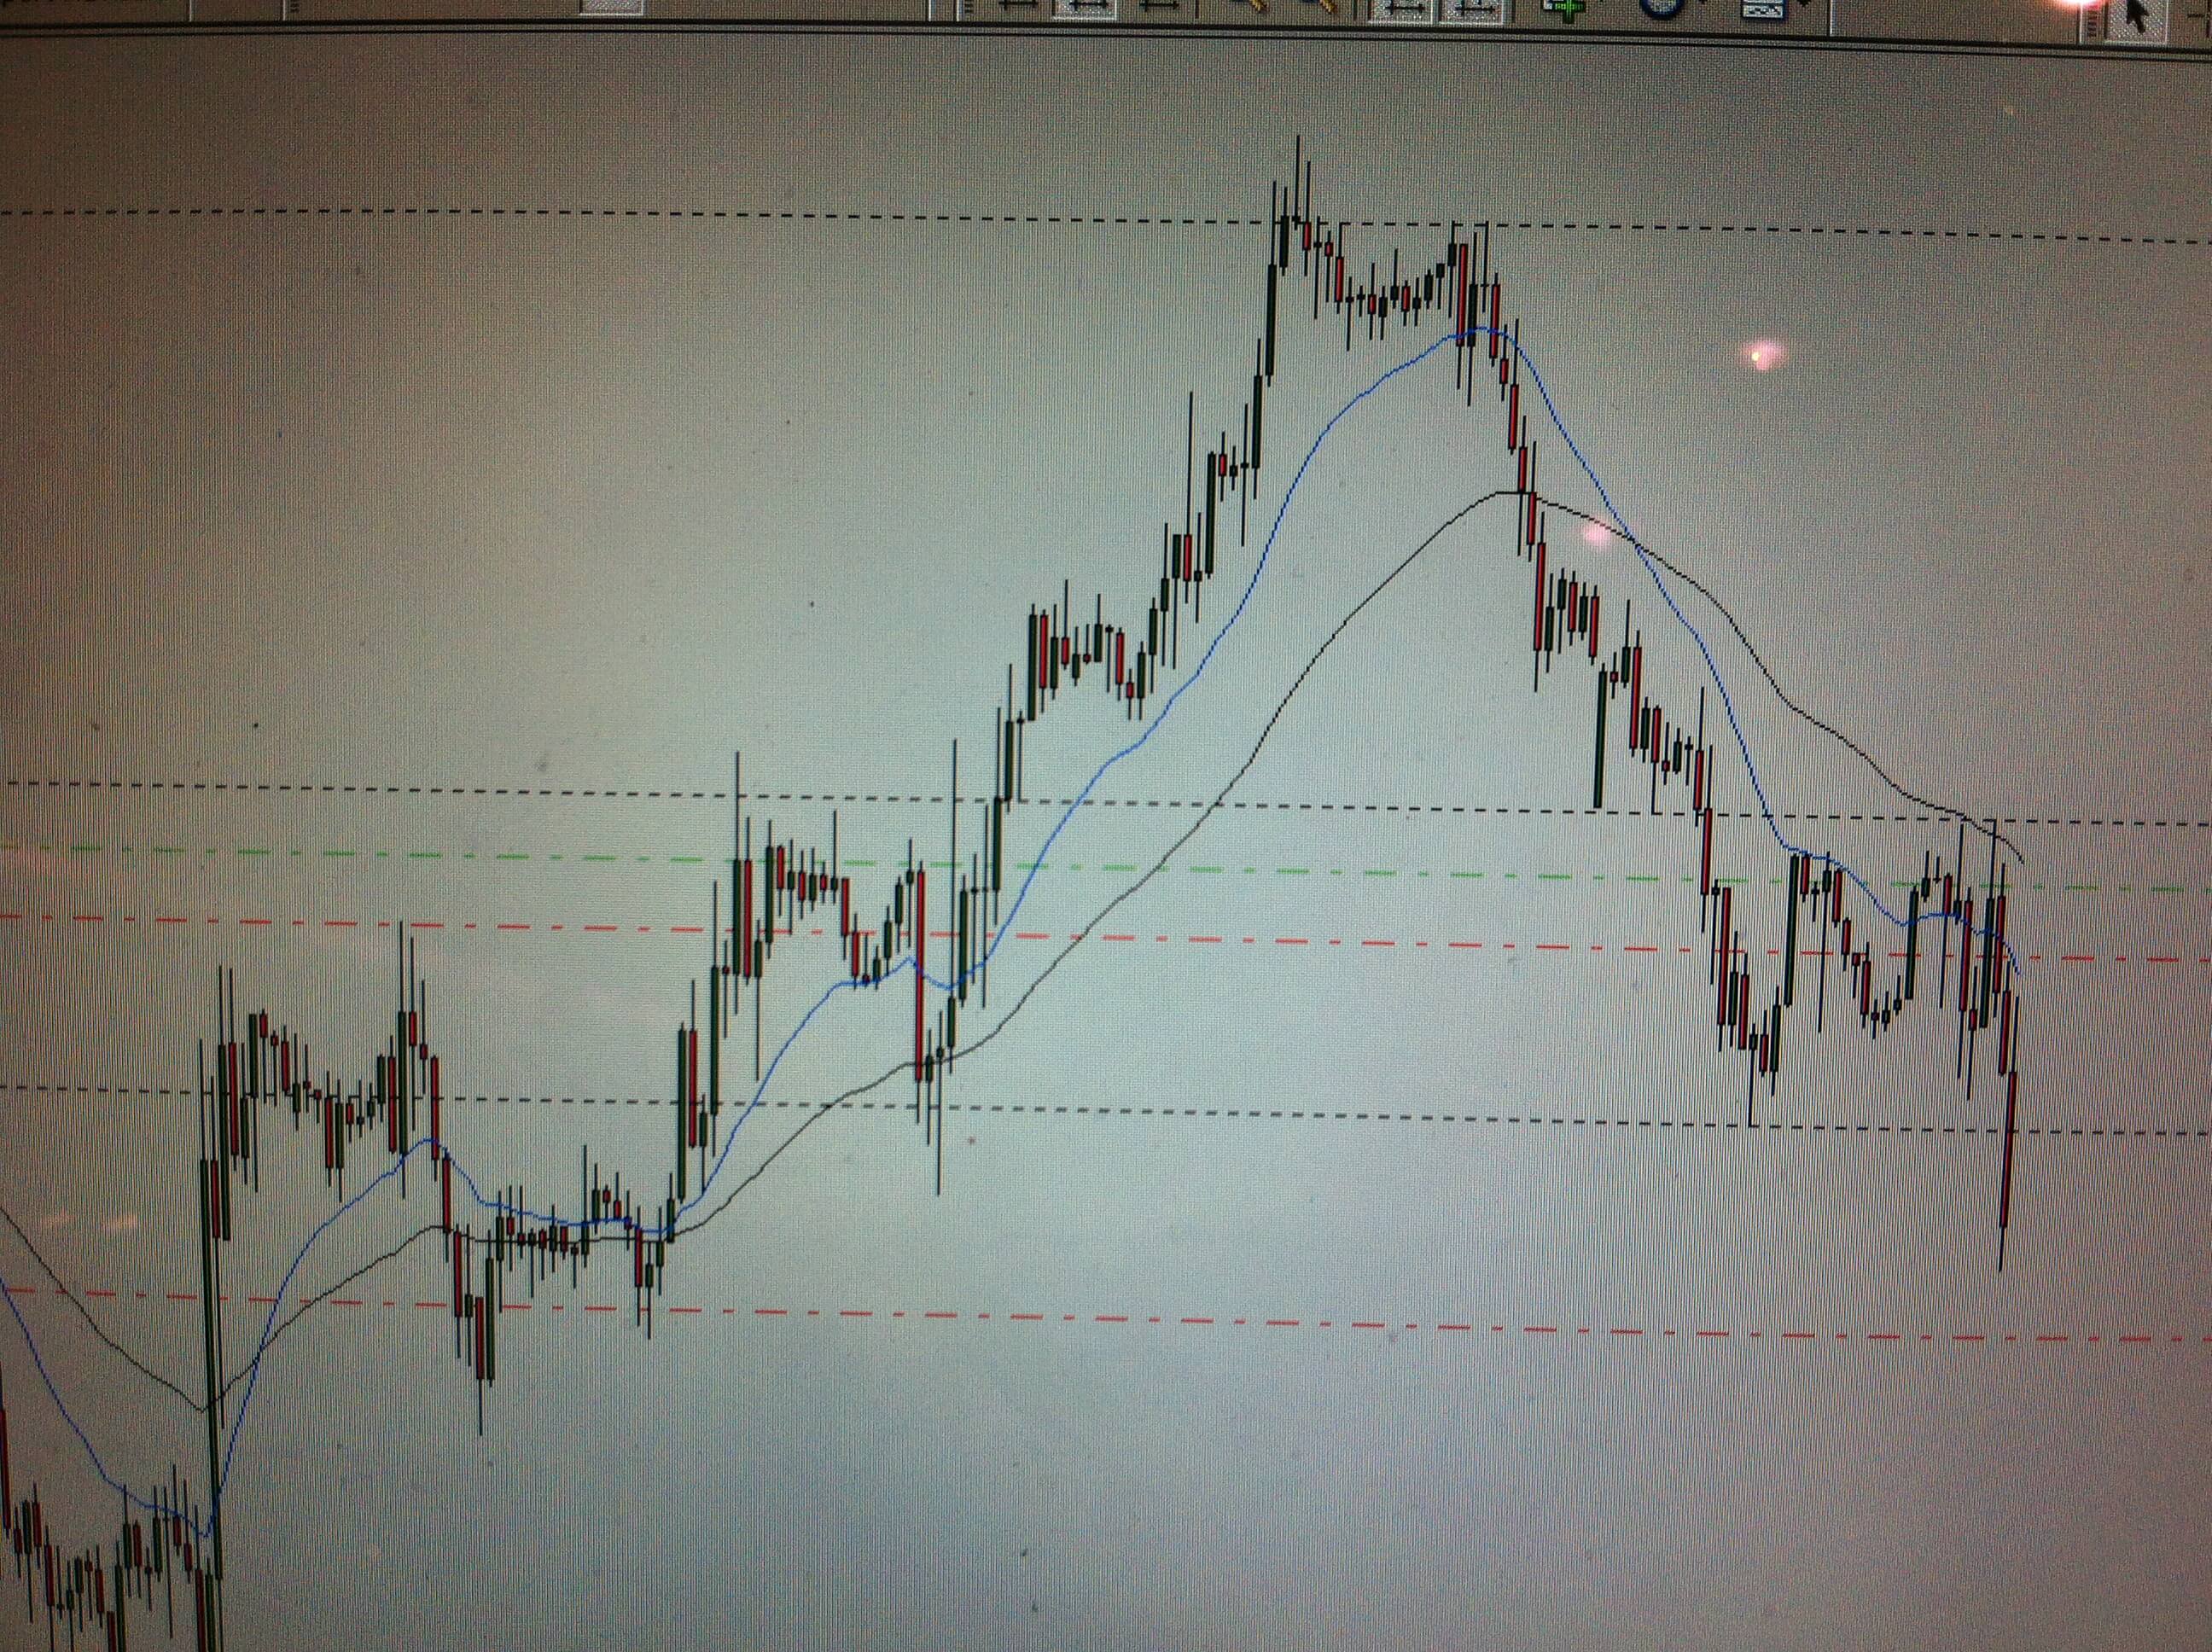
Price action goes in our favour very quickly

2013-08-13 20.32.48
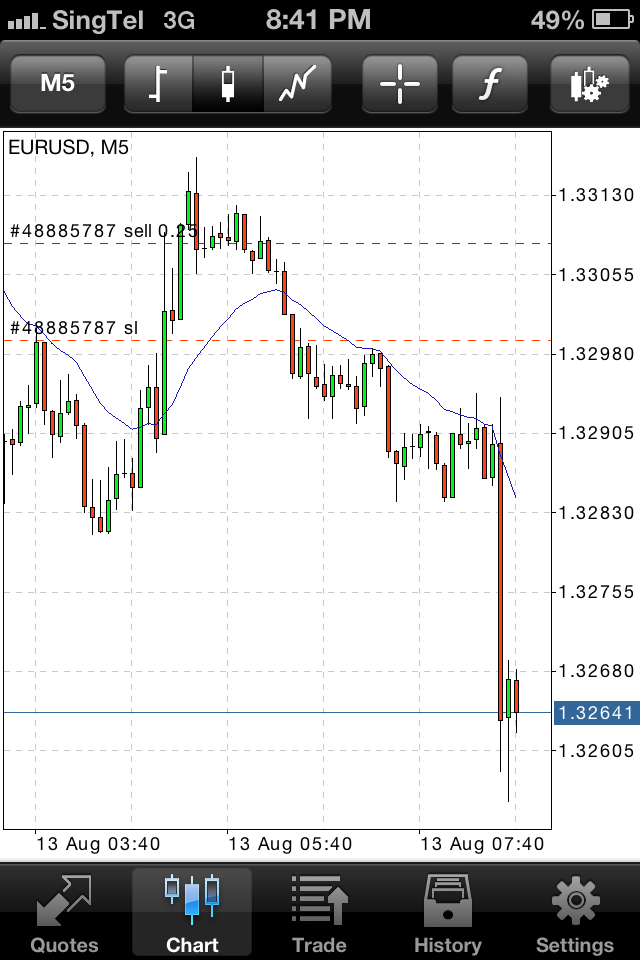
EUR/USD – Price spike down on news release!

2013-08-13 20.35.14
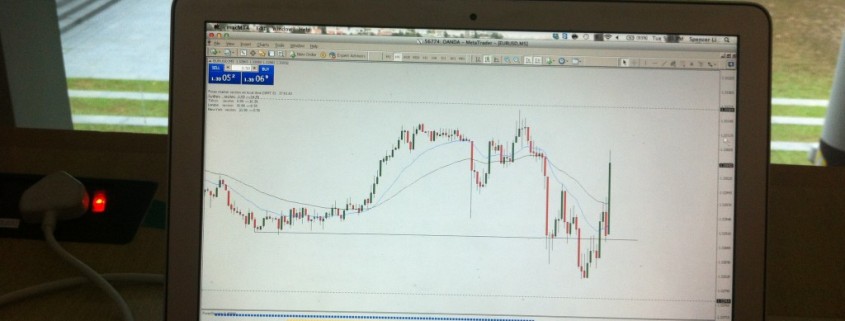
Managing our risk by shifting stoploss to lock in profits

2013-08-13 20.41.151st TP is hit for 40+ pips! Taking half profits.

2013-08-13 22.08.53

 2nd TP was hit at 1.3235, a few pips off the low of the day. Simply uncanny how accurate these price projections can be.  Trailing a small position overnight to gun for 100+ pips overnight.

2013-08-13 17.03.41

2013-08-13 17.03.57

A big thanks to one of my students who insisted on using some of the profits he made today to buy me some sweet treats. With the daily effort put in, I am pretty sure it is only a matter of time before he will be trading a huge account of his own. Keep up the good work!

Spencer Li  –  The Wealth Coach  –  Stocks Investing  –  Forex Trading

Yesterday, I was invited to give another sharing session at City Index, this time I decided to showcase the speed and precise nature of our chart-reading technique, widely-known by the trading circle as Behavioral Analysis. This time, I shared the origins and mechanism behind this new science of chart analysis.

My apologies for those who didn’t manage to make it, because the maximum capacity of the place was 70 people, and I had to close the registration ahead of the event as I did not expect it to be filled so fast.

But fret not, for I will have another sharing session later this month for those who missed this, and I will be adding in something new and exciting, so that those who choose to attend again will get to learn something new. I see many familiar faces every time I give a seminar, and each time they learn something new, which is why they keep coming back for more.

In my mentoring program, I usually have quite a mix of newbies and professional traders. For this sharing session, I noticed we also had a few seasoned traders and even trainers from other training schools sitting in. This is not surprising, as there is always more to learn in the markets, which is why I believe it is very important to be humble and keeping improving myself.

There are only 5 seats left for this September intake, as I believe teaching is best in small classes, so I always limit my intake each quarter. If you miss up on this, you will have to wait till December for the next intake. https://synapsetrading.com/the-synapse-program/

For those who signed up on the spot, you have already been added to the private forum, and you can start your trading journey. One new student already sent me his 2 recent trades, amounting to $1268 in just 2 trades, already covering half of his course fees. I believe he has made the effort to start using the forum, and has been reading up all the useful trading tips and articles I have written in the forum.

2013-08-06 23.56.15

2013-08-06 23.56.36

2013-08-06 23.56.18

2013-08-06 23.56.35

2013-08-06 23.56.39

2013-08-07 18.09.40

2013-08-07 18.17.50

forum updates

I have chosen 5 weekly charts to provide an overview of the global markets, and to see where we are likely to be heading next. The black horizontal line denotes the 2007 highs, to provide a reference point for comparison. The blue boxes indicate key behavioral clues for us to read and time the markets.

First off, we can see that the US markets are the strongest, surpassing the 2007 highs, and looking poised to push even further.

^dji 020813

^gspc 020813

Next, we move on to the European markets, which have not recovered much. The decline has been plugged, but instead of recovery, all we see is a slow chugging movement elucidated by a prolonged sideways market.

^stoxx 020813

Nearer to home, the China markets have been extremely weak, continuing an aimless drift downwards. It does not look like it would be recovering any time soon.

^sse 020813

Lastly, this is the chart of the STI, straddling the middle ground between the strong US markets and the weak China/Europe markets. Since we have already recovered by more than 50%, I believe there is a good chance we will make a push to test the 2007 highs.

^sti 020813

Currently, I am still holding on to my long positions, which are already deep in the money, and recently initiated some short positions. Here are the previous documented posts:
https://synapsetrading.com/sti-banks-signs-of-cracking/
https://synapsetrading.com/sembmar-a-surreptitious-change-of-hands/

On Tuesday, I will be sharing more at my live event, and you can drop by if you have any questions about the market. Actually, the event is already sold out, but if you don’t mind standing, or taking the chance that some people might not turn up, you can still drop by to avoid missing out on this event.
http://www.eventbrite.sg/event/7582887621?ref=ecal

To get priority updates on our future events, you can sign up for our mailing list,
and also “like” us on facebook.
https://www.facebook.com/synapsetrading
http://forms.aweber.com/form/18/2028118318.htm