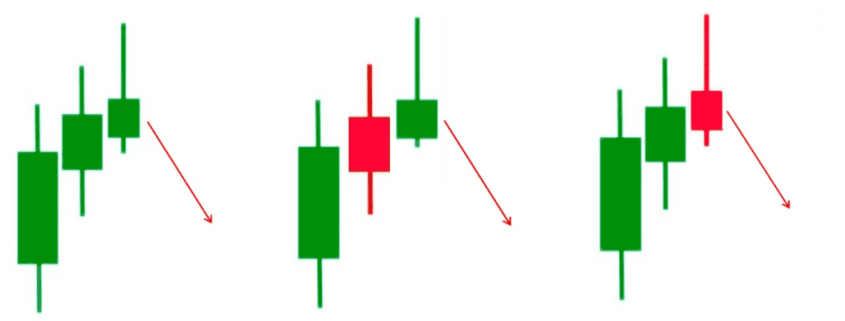
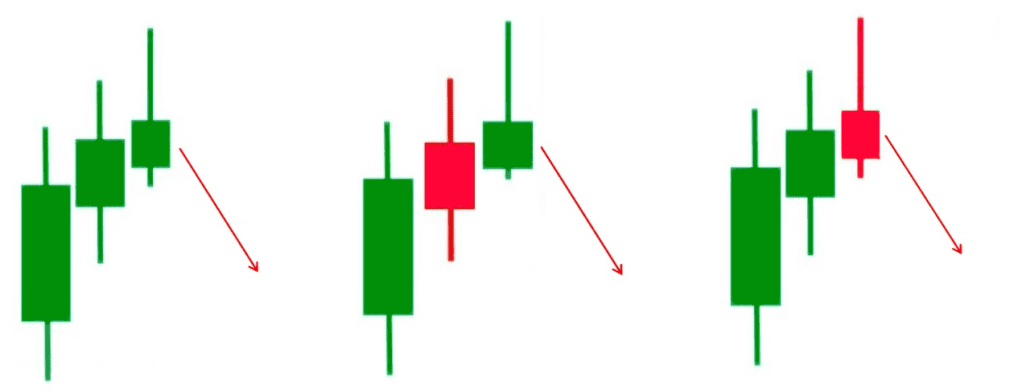
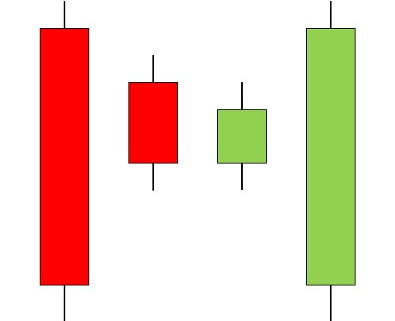
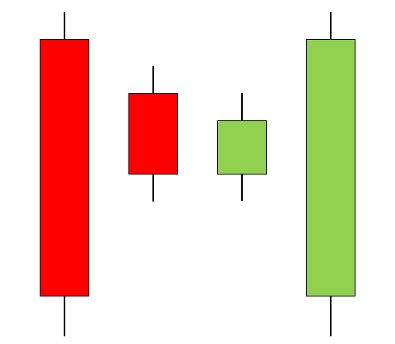
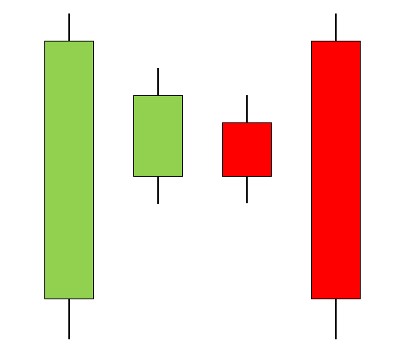
A bearish abandoned baby is a specialized candlestick pattern consisting of three candles: one with rising prices, a second with holding prices, and a third with falling prices.
Technical analysts expect that this pattern signals at least a short-term reversal in a currently upward-trending price.
The occurrence of this pattern is quite rare, appearing approximately 50 times over the past two decades on S&P 500 stocks.
The signal is usually followed by bearish performance over the short term.
Understanding Bearish Abandoned Babies
A bearish abandoned baby can be a signal for a downward reversal trend in the price of a security.
This pattern is formed when a doji-like candle is preceded by a gap between its lowest price and that of the previous candlestick.
The previous candlestick is a tall white candlestick with small shadows.
The doji is also followed by a gap between its lowest price and the highest price of the next candle.
The next candlestick is a tall red candlestick with small shadows.
In this pattern, the doji candle becomes an important signal for traders and technical analysts seeking to identify a bearish reversal of a bullish trend.
When this pattern occurs, price trends lower over the next 20 days about 65% of the time, with a median return of -3.00%, while the return for the benchmark S&P 500 index was positive for the same days.
In contrast to the rare bearish abandoned baby pattern, the equally rare bullish abandoned baby pattern, with a similar price structure, forecasts a bullish trend following its appearance.
Similar Patterns to Bearish Abandoned Baby
Both the bearish abandoned baby and the bullish abandoned baby are similar to the evening star and morning star formations.
The difference that makes the abandoned baby patterns so rare is the occurrence of the doji candle with a gap on either side.
The evening star and morning star formations do not require the middle candle to be a doji or to have gaps on either side.
The name for this pattern, like many of the names of candlestick patterns, comes from traditional usage among rice traders in Japan.
Steve Nison is credited with first publishing this name in the popular press in 1991, though the name has been around in Japanese trading for centuries.
This pattern is also similar to the bar-chart pattern known as an island reversal but with only a single candle.
Why a Bearish Abandoned Baby Pattern Forms
A bearish abandoned baby pattern forms due to a sudden shift in market sentiment from bullish to bearish.
The specific reasons for the formation of a bearish abandoned baby pattern can vary, but some common reasons may include:
- Profit-taking: After a prolonged uptrend, traders who have been holding long positions may start taking profits as they anticipate a potential reversal in price movement. This selling pressure can lead to a gap down between the preceding bullish candle and the subsequent bearish candle.
- Bearish News or Events: Negative news announcements, disappointing earnings reports, or other adverse developments related to the security or broader market can trigger a sudden shift in investor sentiment from bullish to bearish.
- Technical Factors: Technical factors such as key resistance levels, overbought conditions, or bearish chart patterns may contribute to the formation of the bearish abandoned baby pattern. Traders may perceive these technical signals as opportunities to sell or short the security.
- Lack of Buying Support: In some cases, the formation of a bearish abandoned baby pattern may be driven by a lack of buying support or liquidity in the market. If buyers are hesitant to enter the market or are unable to absorb selling pressure, prices may gap down.
Advantages of Trading a Bearish Abandoned Baby Pattern
A bearish abandoned baby pattern often indicates a potential reversal of an uptrend.
Traders who identify this pattern may use it as a signal to exit long positions or even initiate short positions, anticipating a downward movement in the price.
Distinctive characteristics of the bearish abandoned baby pattern, such as the gap down and isolation of the bearish candle, can provide clear entry and exit points for traders.
When combined with other technical indicators or chart patterns, the presence of a bearish abandoned baby can provide additional confirmation of bearish sentiment in the market.
This can strengthen traders’ confidence in their trading decisions and can be useful as a risk management tool.
For example, when recognizing a bearish abandoned baby pattern, traders can place stop-loss orders above the high of the abandoned baby candle to limit potential losses if the market moves against their position.
Finally, developing the ability to identify bearish abandoned baby patterns enhances traders’ pattern recognition skills.
As traders get better at identifying one pattern, they may gain technical skills to spot other patterns.
Therefore, learning and trading the bearish abandoned baby pattern may enhance a trader’s overall abilities.
Tips for Using Bearish Abandoned Baby Patterns
When using the bearish abandoned baby pattern, there are a few things to keep in mind.
While none of the following tips are required, and their usefulness may vary depending on your specific situation, consider the following:
- Confirm with Volume: Look for confirmation of the bearish signal by analyzing trading volume. Ideally, there should be an increase in volume accompanying the formation of the bearish abandoned baby pattern, indicating strong selling pressure. Higher volume can lend credibility to the pattern and increase the likelihood of a significant price reversal.
- Wait for Confirmation: Before taking any trading action based solely on the bearish abandoned baby pattern, wait for confirmation from subsequent price action. This could involve waiting for the next candle to close below the low of the bearish abandoned baby candle or waiting for additional bearish price movement in subsequent sessions.
- Set Stop-loss Orders: Place stop-loss orders to manage risk effectively. You can set stop-loss orders above the high of the bearish abandoned baby candle to limit potential losses if the price reverses unexpectedly. This helps protect your capital in case the pattern fails to result in a significant downward movement.
- Consider Market Context: Assess the broader market context before making trading decisions. Consider factors such as prevailing trends, support and resistance levels, and upcoming economic events or news releases that could impact market sentiment beyond what you pick up just from a trading chart.
- Manage Position Size: Manage your position size based on your risk management strategy and the strength of the bearish signal. As with all investing, consider your comfort level and risk aversion when deciding what trades to execute.
You can use other indicators like RSI, MACD, and other reversal patterns to provide additional confirmation of a trade pattern.
Limitations of a Bearish Abandoned Baby Pattern
While the bearish abandoned baby pattern can be a useful tool for traders, there are a few things to keep in mind.
Like any technical analysis pattern, the bearish abandoned baby is not foolproof.
Sometimes, what appears to be a bearish abandoned baby may not lead to a significant reversal.
You need to be cautious and confirm signals with other indicators or analysis techniques.
It can sometimes be subjective how to interpret candlestick patterns, including the bearish abandoned baby.
Different traders may interpret the same pattern differently, leading to inconsistencies in trading decisions.
Plus, in volatile markets, the bearish abandoned baby pattern can lead to whipsaws where prices quickly reverse direction after triggering a signal.
This may make it tough to spot the pattern or may cause false signals.
Relying solely on the bearish abandoned baby pattern without considering other factors such as fundamental analysis, market sentiment, or macroeconomic factors can be risky.
You should consider using the bearish abandoned baby to aid in other analysis but realize it may fall short if used as the only technical indicator when deciding on a trade.
Lastly, the significance of the bearish abandoned baby pattern may vary depending on the timeframe being analyzed.
What appears to be a strong signal on a shorter timeframe chart (for example, a 1-hour chart) may be less reliable on a longer timeframe chart (for example, a daily chart).
Traders should consider the timeframe sensitivity when incorporating this pattern into their analysis, as once again, the pattern may communicate different results depending on how it is interpreted.
Concluding Thoughts
A bearish abandoned baby pattern in trading occurs when a gap down forms after an uptrend, followed by a doji or spinning top candlestick representing indecision, and finally a gap up.
This pattern suggests a potential trend reversal from bullish to bearish sentiment, though it should be used as a supplement to support broader trading analysis.
The Synapse Network is our dedicated global support team, including event managers, research teams, trainers, contributors, as well as the graduates and alumni from all our previous training program intakes.