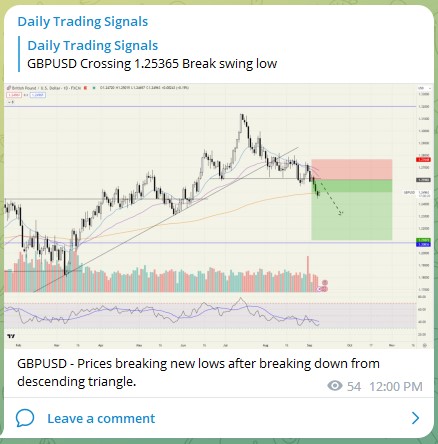
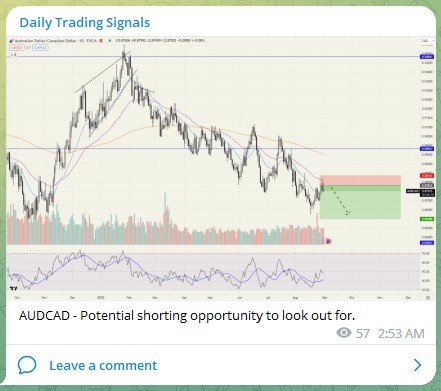
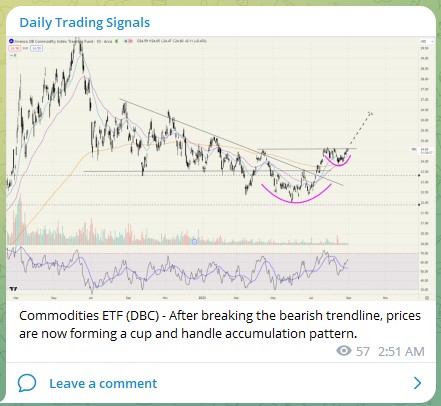
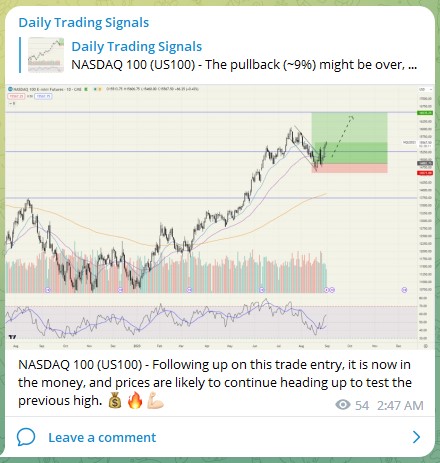
Market analysis, insights and trading ideas on various markets and products!

Trend-following indicators are technical tools that measure the direction and strength of trends within a chosen time frame.

Some trend-following indicators are plotted directly on the price panel.

These indicators issue a bearish signal when positioned above the price and a bullish signal when situated below the price.

Others are drawn below the panel, generating upticks and downticks from 0 to 100 or across a central ‘zero’ line.

These indicators create bullish or bearish divergences when their signals oppose the price action.

Characteristics of Trend-Following Indicators

Most trend-following indicators are ‘lagging,’ meaning they generate a buy or sell signal after a trend or reversal is already underway.

The moving average is the most popular lagging trend-following indicator.

These indicators can also be ‘leading,’ predicting price action before it begins by using multiple calculations and comparing momentum across different time frames.

Parabolic Stop and Reverse (Parabolic SAR) is a well-known leading trend-following indicator.

Functions of Trend-Following Indicators

Trend-following indicators serve three primary functions:

  1. Alerting the Technician: They alert the technician to a developing trend or an impending reversal.
  2. Predicting Price Direction: They predict short- and long-term price direction.
  3. Confirming Observations: They confirm observations and signals in the price pattern and other technical indicators.

Signal reliability is dependent on the settings used for drawing the trend-following indicator.

For example, a 50-day moving average and a 200-day moving average generate unique buy and sell signals that may work in one time frame but not in another.

Types of Trend-Following Indicators

Simple Moving Average (SMA)

The Simple Moving Average (SMA) measures the average price across a range of price bars chosen by the technician.

It is a highly effective tool for evaluating the strength of the current trend and determining whether an established trend will continue or reverse.

The SMA is less effective in sideways and range-bound markets.

Interactions between the price and the moving average generate bullish and bearish divergences, which evaluate trend strength and direction.

Exponential Moving Average (EMA)

The Exponential Moving Average (EMA) measures the average price across a range of price bars but places greater weight on more recent data points.

This ‘weighted moving average’ responds more quickly to recent price action than the SMA, theoretically generating earlier buy and sell signals.

However, this weighting also tends to generate more false signals than the SMA.

Average Directional Index (ADX/DMS)

The Average Directional Index (ADX/DMS) measures the strength or weakness of an active trend.

It uses moving averages in several time frames to generate three lines—ADX, +DMI, and -DMI.

These lines cross higher or lower through a panel with values between 0 and 100.

ADX measures the strength of an uptrend when +DMI is above -DMI and the strength of a downtrend when +DMI is below -DMI.

Moving Average Convergence-Divergence (MACD)

Moving Average Convergence-Divergence (MACD) is a widely used technical tool that analyzes the relationship between moving averages set at different intervals.

MACD generates directional lines or a histogram that gauges current momentum and price direction.

It is calculated by subtracting a 26-period EMA from a 12-period EMA, with a 9-period EMA of the MACD, called the ‘signal line,’ added to the plot.

Parabolic Stop and Reverse (Parabolic SAR)

Developed by RSI creator Welles Wilder Jr., the Parabolic Stop and Reverse (Parabolic SAR) is used to confirm trend direction and generate reversal signals.

Indicator data points generate dots above or below the price on the main chart panel.

The calculation applies an ‘invisible’ trailing stop, forcing the indicator to change direction when hit, marking a potential trend reversal.

Additional Trend-Following Indicators

  • Accumulative Swing Index: Evaluates the long-term trend through changes in opening, closing, high, and low prices.
  • Alligator: Uses three Fibonacci-tuned moving averages to identify trends and reversals.
  • Aroon: Evaluates whether a security is trending or range-bound and, if trending, the strength or weakness of the advance or decline.
  • Elder Ray Index: Evaluates buying and selling pressure by separating price action into bull and bear power.
  • ZigZag: Connects plot points on a price chart that reverse whenever the asset reverses by more than a specified percentage.

Concluding Thoughts

Trend-following indicators are essential tools for traders and investors aiming to capitalize on market trends.

While they offer valuable insights into the direction and strength of trends, their effectiveness can vary based on the settings and market conditions.

Using these indicators in conjunction with other technical analysis tools can enhance their reliability and help traders make more informed decisions.

What Is a Technical Indicator?

Technical indicators are mathematical patterns derived from historical data that technical traders and investors use to forecast future price trends and make trading decisions.

They derive data points from past price, volume, and open interest data using a mathematical formula.

A technical indicator is displayed graphically and compared to the corresponding price chart for analysis.

The mechanics of a technical indicator capture the behavior and sometimes the psychology of investors to hint at future price activity trends.

Cycle volumes, momentum readings, volume patterns, price trends, Bollinger Bands, moving averages, Elliot waves, oscillators, and sentiment indicators are technical indicators used in technical analysis to forecast future price movements.

Besides providing valuable insight into the price structure, a technical indicator shows how to profit from price movements.

What Are Technical Indicators?

Technical indicators are heuristic or pattern-based signals generated by a security’s or contract’s price, volume, and open interest used by traders who employ technical analysis.

Technical analysts use indicators to forecast future price movements by analyzing historical data.

Some technical indicators generate signals independently, while others work in tandem.

They are used in technical analysis to assess a security’s strength or weakness by focusing on trading signals, patterns, price movements, and other analytical charting tools.

Although there are non-specific market technical indicators, some technical indicators are intended to be used for a specific financial market.

How Do Technical Indicators Work?

Technical analysis is a trading discipline that uses statistical trends gathered from trading activity, such as price movement and volume, to evaluate investments and identify trading opportunities.

Unlike fundamental analysts, who attempt to determine a security’s intrinsic value using financial or economic data, technical analysts use price movement patterns, trading signals, and other analytical charting tools to assess a security’s strength or weakness.

Any security with historical trading data can benefit from technical analysis.

This includes stocks, futures, commodities, fixed-income securities, currencies, and other financial instruments.

Technical analysis is far more common in commodities and forex markets, where traders are concerned with short-term price movements.

Types of Technical Indicators

Technical Indicators can be divided into the following categories:

Momentum Indicators

Momentum indicators are tools traders use to understand better how quickly or slowly the price of security changes.

Momentum indicators should be used with other indicators and tools because they do not identify the direction of movement but only the timeframe in which the price change occurs.

Momentum indicators help traders understand the speed at which the price of certain stocks changes.

Below are some of the popular momentum indicators:

  1. Moving Average Convergence Divergence (MACD):
    • MACD is a momentum indicator that shows the relationship between two moving averages, i.e., 26 EMA and 12 EMA.
    • It consists of the MACD line and the signal line.
    • The buying signal is generated when the MACD line crosses the signal line from below, and the selling signal is generated when it crosses from above.
  2. Relative Strength Index (RSI):
    • The RSI acts as a metric for price changes and the speed at which they change for a particular period.
    • It oscillates between zero and 100, indicating overbought conditions above 70 and oversold conditions below 30.
  3. Average Directional Index (ADX):
    • The ADX helps measure both the momentum and direction of price movements.
    • ADX values of 20 or higher indicate a trending market, while values below 20 suggest a directionless or consolidated market.
  4. Rate of Change:
    • The rate of change indicates the speed at which the price changes over time.
    • A positive ROC indicates high momentum, while a negative ROC signals low momentum, suggesting a sell signal.
  5. Stochastic:
    • Stochastics compare the current closing price of a stock over a particular period.
    • It identifies overbought and oversold zones, oscillating between 0 and 100.
  6. Relative Strength:
    • Relative strength measures a stock’s performance compared to its benchmark or another stock.
    • It helps identify the strongest and weakest securities or asset classes within the financial market.

Trend Indicators

Trend indicators help traders analyze whether trends will continue or reverse.

  1. Moving Averages:
    • Moving averages smooth out price data by averaging prices over a specified period.
    • They help identify the current trend direction.
  2. Supertrend:
    • Supertrend is a trend indicator that shows the direction of price movement.
    • It changes color based on the trend direction, indicating buy or sell signals.
  3. Parabolic SAR:
    • Parabolic SAR highlights the direction in which a security is moving.
    • It appears as a series of dots placed above or below the price bars on a chart.

Volume Indicators

Volume indicators help confirm trends and patterns by indicating how many stocks were bought and sold in the market at a given period.

  1. On-Balance Volume (OBV):
    • OBV calculates buying and selling pressure as a cumulative indicator, adding or subtracting volume based on price movements.
  2. Volume Price Trend Indicator:
    • The VPT indicator determines a stock’s price direction and the strength of price change.
    • It combines cumulative volume with price movements.
  3. Money Flow Index (MFI):
    • MFI is a movement and volume indicator that measures trading pressure, indicating buying or selling momentum.

Volatility Indicators

Volatility indicators help traders gauge market volatility, which can create big swings in stock prices.

  1. Bollinger Bands:
    • Bollinger Bands consist of three bands: the upper, lower, and middle bands.
    • They expand and contract based on market volatility.
  2. Keltner Channel:
    • The Keltner Channel determines the direction of a trend using the average true range (ATR) and exponential moving averages (EMA).
  3. Donchian Channel:
    • Donchian Channels determine volatility by creating bands around a median price.
  4. Average True Range (ATR):
    • ATR measures the true range of price bars, indicating higher trading ranges and increased volatility.

Breadth Indicators

Breadth indicators gauge internal strength or weakness in an index by measuring the percentage of stocks trading above a specified moving average.

  1. Percent/Number of Stocks above Moving Average:
    • This indicator gauges the internal strength or weakness of an index by measuring the percentage of stocks trading above a specified moving average.
  2. Periodic Highs and Lows:
    • This indicator tracks the number of stocks trading near their periodic high or low levels.
  3. Advance/Decline:
    • The advance-decline ratio refers to the number of advancing shares divided by the number of declining shares.

Concluding Thoughts

When analyzing securities, traders frequently employ a variety of technical indicators.

With numerous options available, traders must select the best indicators and understand how they work.

To generate trade ideas, traders may combine technical indicators with more subjective forms of analysis, such as chart patterns.

Given their quantitative nature, technical indicators can also be incorporated into automated trading systems.

What Is a Technical Indicator?

A technical indicator is a heuristic or pattern-based signal generated from the price, volume, and/or open interest of a security or contract.

These indicators are widely used by traders who engage in technical analysis to predict future price movements based on historical data.

Examples of popular technical indicators include the Relative Strength Index (RSI), Money Flow Index (MFI), stochastics, moving average convergence divergence (MACD), and Bollinger Bands®.

How Technical Indicators Work

Technical indicators are central to the discipline of technical analysis, which is used to evaluate investments and identify trading opportunities.

This approach focuses on analyzing statistical trends from trading activity, such as price movements and volume, to determine the strength or weakness of a security.

Unlike fundamental analysis, which seeks to determine a security’s intrinsic value based on financial or economic data, technical analysis is primarily concerned with price patterns and trading signals.

Technical indicators are typically applied to any security with historical trading data, including stocks, futures, commodities, fixed-income securities, and currencies.

They are especially prevalent in commodities and forex markets, where traders often focus on short-term price fluctuations.

Known as “technicals,” these indicators analyze historical trading data rather than the underlying fundamentals of a business, such as earnings or revenue.

Technical indicators are favored by active traders due to their ability to analyze short-term price movements, though long-term investors may also use them to pinpoint entry and exit points.

Types of Technical Indicators

Technical indicators generally fall into two main categories:

  1. Overlays:
    • These indicators use the same scale as prices and are plotted directly over the prices on a stock chart.
    • Examples include moving averages and Bollinger Bands®.
  2. Oscillators:
    • These indicators oscillate between a local minimum and maximum and are plotted above or below the price chart.
    • Examples include the stochastic oscillator, MACD, and RSI.

Using Technical Indicators

Traders often employ multiple technical indicators when analyzing a security.

With thousands of available options, it’s important for traders to choose the indicators that align with their trading strategy and to thoroughly understand how they function.

In addition to standalone indicators, traders may also combine them with more subjective forms of technical analysis, such as chart patterns, to generate trade ideas.

Given their quantitative nature, technical indicators can also be integrated into automated trading systems.

Concluding Thoughts

Technical indicators are powerful tools for analyzing historical trading data and predicting future price movements.

While they are particularly useful for short-term traders, long-term investors can also benefit from their insights when making decisions about entry and exit points.

Understanding the different types of technical indicators and how they can be applied within a broader trading strategy is essential for successful technical analysis.

Sanku, also known as the Three Gaps pattern, is a Japanese candlestick pattern that consists of three distinct gaps occurring within a well-defined trend.

These gaps may occur consecutively or be separated by several candles.

The appearance of this pattern often suggests that the trend may be nearing exhaustion, signaling traders to watch for potential signs of a reversal.

triple gap candlestick pattern

Understanding the Sanku (Three Gaps) Pattern

The Sanku pattern can occur in both uptrends and downtrends.

In an uptrend, the pattern is referred to as the Rising Three Gaps, where three gaps higher are separated by rising candles.

Conversely, in a downtrend, the pattern is called the Falling Three Gaps, with three gaps lower separated by declining candles.

The gaps may be spaced out over several candles, not just one.

The Sanku pattern indicates strong price action, but it may not be sustainable for long.

In the Rising Three Gaps pattern, the gaps represent aggressive buying.

As the number of buyers diminishes, former buyers may start selling to lock in profits, which can signal the beginning of a reversal.

The pattern is a warning that the trend might be overheating, although it is not a definitive sign of reversal.

A reversal is more likely when the price fills the third gap by moving in the opposite direction.

For example, in an uptrend, if the price drops below the entire third gap, it could indicate that a reversal to the downside is in progress.

The same concept applies in a downtrend when the price moves up through the third gap.

Examples of How to Use the Sanku (Three Gaps) Pattern

The Sanku pattern is typically formed by a bullish candle, followed by a gap higher, another bullish candle, another gap higher, and then a final gap higher with another candle.

Each of these candles could consist of multiple smaller candles, especially in fast-moving markets.

Even two gaps with significant price moves between them can signal that the trend is nearing exhaustion.

For traders looking to lock in profits, the Sanku pattern suggests trailing stop losses behind recent candle lows or the lows of the most recent gap.

When the price drops below the most recent gap higher, it could indicate that the trend is reversing.

This could be a temporary pullback or a long-term top, depending on the context and size of the price moves during the pattern.

If the pattern leads to a long-term decline, it may be indicative of a climax top, especially if accompanied by very high volume.

Some traders may initiate short positions once the reversal begins, placing stop losses above the recent candle or the high of the entire pattern.

The Difference Between the Sanku (Three Gaps) Pattern and Three White Soldiers

The Sanku (Three Gaps) pattern and the Three White Soldiers pattern are both candlestick patterns, but they signal different market behaviors.

The Three White Soldiers pattern occurs after a downtrend and consists of three large upward candles, indicating a potential new uptrend.

In contrast, the Falling Three Gaps pattern occurs during a downtrend and is part of the Sanku pattern.

Limitations of the Sanku (Three Gaps) Pattern

Not all Sanku patterns will result in a reversal.

Consecutive small gaps can occur in uptrends or downtrends for extended periods, which might lead traders to exit positions prematurely and miss out on further gains.

Determining which three gap patterns are significant is subjective.

The larger the price moves and gaps, the more important the pattern is likely to be.

The overall context and market outlook are also crucial.

The Sanku pattern may result in only a minor pullback, or it could precede a full trend reversal.

Finally, the Sanku pattern does not provide a specific profit target, so traders need to use other analysis methods to determine when to exit trades based on this pattern.

Concluding Thoughts

The Sanku (Three Gaps) pattern is a powerful candlestick formation that can signal the potential exhaustion of a trend.

While it can indicate an impending reversal, traders should be cautious and consider the overall context before making trading decisions based on this pattern.

As with any technical analysis tool, combining the Sanku pattern with other indicators and analysis methods can help improve the reliability of trading decisions.

A stalled pattern is a candlestick chart pattern that occurs during an uptrend but signals a potential bearish reversal.

It is also referred to as a deliberation pattern.

Candlestick charts display the open and closing prices of a security, along with their highs and lows for a specific period.

These charts are named after the way the illustrations resemble candles and their wicks.

A stalled pattern suggests indecision in the market and may indicate a limited potential for traders to turn a quick profit through short-term trades.

stalled pattern

Understanding Stalled Patterns

A stalled pattern does not always result in a bearish reversal.

However, if the candle following the stalled pattern moves below the midpoint of the second candle’s real body, a bearish reversal becomes more likely.

Traders often interpret this as a signal to consider cutting their losses.

Reversals can occur rapidly, sometimes within a single day.

However, market analysts often look for reversals that unfold over longer periods, such as weeks.

Technical analysts scan for reversal patterns throughout the day to inform their trading strategies.

Intraday reversals are usually triggered by events like company announcements or news reports that can quickly alter investor sentiment.

A bearish trend, or downward trend, is characterized by a series of lower highs and lower lows.

Once bearish, a market can reverse into an uptrend when both the highs and lows begin to rise.

Understanding Candlestick Charts

A stalled pattern chart consists of three white candles and must meet specific criteria.

First, each candle’s open and close must be higher than that of the previous candle in the pattern.

Second, the third candle must have a shorter real body than the other two candles.

Finally, the third candle should have a tall upper shadow, with an open that is near the close of the second candle.

The wide part of the candle on the chart is known as the real body.

It represents the range between the opening and closing prices of a security over a given time period.

If the real body is black or red, it indicates that the stock closed lower than it opened.

If it is white or green, the stock closed higher.

Investors and market observers can also look for reversals in subsequent candles that follow the stalled pattern.

One indicator of such a reversal is the bearish engulfing pattern.

Concluding Thoughts

The stalled pattern is an important candlestick formation that can signal a potential shift in market sentiment.

While it does not always lead to a bearish reversal, traders should be cautious when they spot this pattern, especially if subsequent price action confirms the reversal.

Understanding the nuances of candlestick charts, including patterns like the stalled pattern, can provide traders with valuable insights into market movements and help inform their trading decisions.