Today, I was invited as a guest speaker to give a talk at 2009 AGM of STATS (Singapore Technical Analysts & Traders Society) on the “Strategic Outlook for 2010”. Before the talk, there was a poll, and it seemed that the general consensus is for a correction in the medium term. Here also some of the pictures taken from our slides.


Dow Jones Industrial Average
Straits Times Index
Straits Times Index
Ezra 
Ezra
 
After finishing my talk, I opened the floor to the public and numerous stock requests were shouted out. Due to time constraints, I only had time to do an on-the-spot analysis for a handful of stocks.
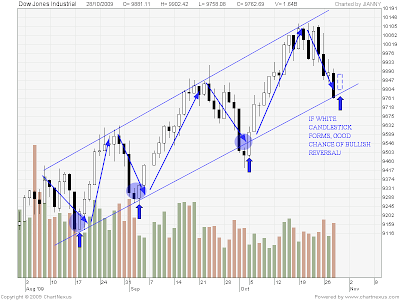
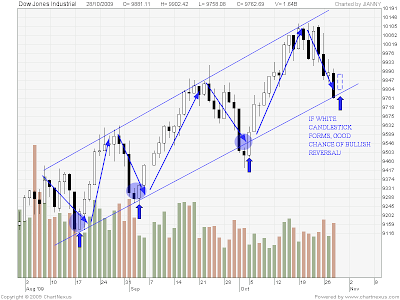
20091030 Dow Jones Industrial 800x600

Price action and volume lies at the core of technical analysis, since that is all the data a market technician works with. Almost all technical methods, such as chart patterns, candlestick patterns or even Elliot wave are studies of price action. Indicators like RSI, Stochastics or MACD are all calculated from price data as well. To understand the big picture, it pays to first understand the building blocks.

Volume Spread Analysis - Spotting the Hidden Clues in Volume

Volume Spread Analysis – Spotting the Hidden Clues in Volume

At the most basic level, price action is the movement of a security’s price. This encompasses all technical and classical pattern analysis, including swings, support and resistance, trends, etc. The most commonly known tools are candlestick and price bar patterns, which are ways of cataloging common price action patterns.

However, the crux about price action is not about memorising patterns and names. It is about understanding. That is what professional traders do. No two people will analyze every bit of price action the same way, and that is why a lot of traders find the concept of price action so elusive. That is why it takes experience to read price action.

Below is a useful picture summary of essential candlestick patterns:

candlesticks patterns

Volume is the number of shares or contracts that trade hands from sellers to buyers during a period of time, and serves as a measure of activity. If a buyer of a stock purchases 100 shares from a seller, then the volume for that period increases by 100 shares based on that transaction.

Hence, volume is energy. It represents the level of commitment and participation by buyers and sellers, hence it indirectly indicates the supply/demand equation. Volume at times also serves as a leading indicator, because large movements in the market are due to the actions of market-movers (also known as the professionals or smart money), and these actions will show up in volume and price. At times,either of these two could provide the leading clues to future market movement.

The level of volume marks the significance of events – for example a breakout, a gap movement, or breaking a key support, etc. The higher the volume, the more significant these events are, because it shows more participation by smart money. In general, volume should be rising n the direction of the trend and decreasing on corrections, which would also be useful for identifying pullbacks in a trend. Watch out for unusual climatic moves in volume, for a climax usually results in a swift reversal or rebound.

The key is understanding the relationship between price and volume.

20091030 Dow Jones Industrial 800x600

Dow Jones Industrial Average
Currently, a markdown phase is heading right into a channel bottom area, where potential demand could come in. We should be looking out for signs of accumulation and bullish reversal bars or small pause bars which could turn the tides.

Singapore Stocks
This is indeed a breakout from triangle formation. Some might argue its an ascending triangle due to the obvious double top peaks formed earlier but either way of looking at it is fine. I have drawn it as a symmetrical triangle in the attachment for easy reference. As for the price target, you actually look at the apex of triangle and apply the 2/3 RULE. That is to say that you draw the arrow taking the apex of the triangle as a reference point and count back 2/3 of the time frame. The price objective would then be the breakout price + height of base.

aibc

aibc

This event was held in SMU, and saw professionals and student flying in from all over the world to attend talks and networking sessions with a variety of renowed industry speakers.

AIBC stage

AIBC jian hui

After 3 days of talks and workshops, the event culminated in a memorable networking dinner and social drinking session in a professional setting. It was indeed a great opportunity to network with many industry professionals.