Technical analysis in trading evaluates and predicts future price moves and trends for securities.
One tool employed often is the Donchian channel.
While the mathematical formula behind it is straightforward, many online trading platforms and technical analysis apps calculate and plot the Donchian channel for you.
This convenience is helpful, but it’s also important to understand the nuts and bolts, so you know the tool’s benefits and its limits.
Table of Contents
Donchian Channel Basics
Basically, the Donchian channel is formed by identifying the highest and lowest prices of a security over a set time.
This can be adjusted based on your trading strategy, though the most common is 20 periods (the typical number of trading days in a month).
The upper channel line is drawn at the highest price reached during a period, while the lower channel line is at the lowest price.
There’s also a middle line, which represents the average of these two extremes.
The Formula for Donchian Channels
The formula for Donchian channels is as follows:
UC = Highest High in Last N Periods
Middle Channel = (UC + LC) / 2
LC = Lowest Low in Last N periods
Where:
UC = Upper channel
N = Number of minutes, hours, days, weeks, or months
LC = Lower channel
How Donchian Channels Work
The upper channel (UC) is the highest price level over a specified number of periods (N).
The periods can be minutes, hours, days, weeks, or months, depending on your trading strategy.
By contrast, the lower channel (LC) is the lowest price level over the same number of periods.
The middle channel is the average of the upper and lower channels, giving you a midpoint in the price range.
High, Low, and Center Channels
High Channel
Choose the period (N minutes/hours/days/weeks/months).
Approximate the high point for each minute, hour, day, week, or month over that period.
Choose the highest point.
Plot the result.
Low Channel
Choose the period (N minutes/hours/days/weeks/months).
Compare the low point for each minute, hour, day, week, or month over that period.
Choose the lowest point.
Plot the result.
Center Channel
Choose the period (N minutes/hours/days/weeks/months).
Compare high and low points for each minute, hour, day, week, or month over that period.
Add the lowest low point to the highest high point and divide by two.
Plot the result.
What Do Donchian Channels Tell You?
Donchian channels depict the relationship between the current price and trading ranges over set periods.
Three values build a visual map of price over time, similar to Bollinger Bands, signaling the extent of bullishness and bearishness for the chosen period.
The top line shows the extent of bullish energy, the highest prices achieved for the period.
The middle line identifies the period’s median or mean reversion price, highlighting the middle ground.
The bottom line shows the extent of bearish energy and the lowest price for the period.
Example of How to Use Donchian Channels
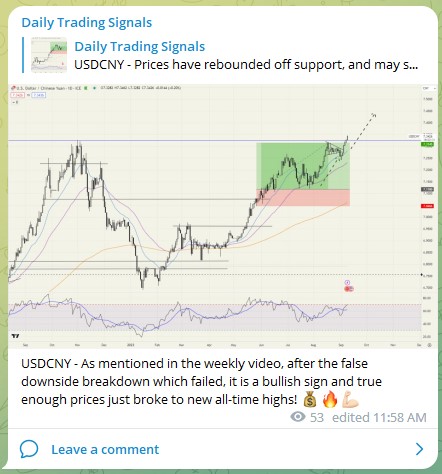
In this example, the Donchian channel is the shaded area bound by the upper green and the lower red lines, using 20 days for the band construction over N periods.
As the price moves to its highest point in the last 20 days or more, the price bars “push” the green line higher.
As the price drops to its lowest point in 20 days or more, the price bars “push” the red line lower.
When the price decreases for 20 days from a high, the green line will be horizontal and then start dropping.
Conversely, when the price rises from a low for 20 days, the red line will be horizontal for 20 days and then start rising.
Practical Uses of the Donchian Channel
Donchian channels have several applications for traders in stocks, forex, commodities, and other markets.
They can help identify potential breakouts and reversals in price, which are the moments when traders are called on to make strategic decisions.
These strategies can help you capitalize on price trends while having predefined entry and exit points to secure gains or limit losses.
Using the Donchian channel can thus be part of a disciplined approach to managing trades.
Assessing Volatility
The width of the area enclosed within the upper and lower lines reveals the asset’s volatility.
A wider channel signifies high volatility and larger swings in price during the period, implying the asset has a high potential for price fluctuations.
A narrow channel shows lower volatility, meaning the asset could be more stable or is in the midst of consolidating previous gains or losses.
When an asset price keeps trading within a narrow range of the Donchian channel, signaling potential consolidation, a breakout could be more likely to occur once the price moves above or below the outer lines.
Finding Support and Resistance Levels
An important use of Donchian channels is to determine support and resistance levels.
The upper band of the channel diagrams the highest price of an asset over a set period, which can serve as its resistance level.
Alternatively, the lower band, marking the lowest price point for the same time, provides the support level.
Identifying a Breakout
A breakout above the upper band can signal the beginning of an upward swing, suggesting a potential buying opportunity.
Meanwhile, should the price go below the lower band, this could be the time for selling or shorting the asset.
Determining when a breakout happens involves watching for when the price moves beyond the upper or lower band.
You can usually confirm a breakout once the price closes at a point above or below the upper or lower channels.
Following Trends
Beyond using the channels for signs of a breakout, they are used to follow trends and strategize accordingly.
For example, you might consider buying a long position on a security when the price stays near or touches the upper band, signaling upward momentum.
Alternatively, a short position might be in order if there’s a similar movement at or near the lower channel.
The middle line is useful too, as it allows you to have another means for seeing relative support or resistance in the asset prices.
Stop-Loss Orders
Donchian channels can be a risk management tool for locking in profits or stopping a slide in losses.
For example, if you are holding a long position, you might want to follow a common approach: setting your stop-loss just below the lower Donchian channel band.
Should the price plunge beneath that point, there might be a reversal or breakdown in the trend.
This could be where you put the stop-loss to limit your risk.
If you have shorted an asset, you would place a stop-loss at a point above the upper band.
Should the price go above this level, you might have an upward trend.
A stop-loss there would protect you from further losses.
You can also use the Donchian channel for trailing stop-loss orders.
For a long position, you can gradually push the stop-loss upward, trailing below the lower band when it’s rising.
If you’re in a short position, you can adjust it lower, trailing just above the descending upper band.
Take-Profit Orders
Whether you have a long or short position, the middle line of the Donchian channel can help you determine where to put a take-profit order.
This is a limit order identifying the price at which you’ll get out of a position and pocket the profit.
You might, for instance, secure at least some of your profits if the price starts to cross the mid-channel line, particularly if it’s previously worked as a support or resistance level.
Another strategy would involve waiting for the asset’s price to hit up against the opposite band of the channel.
In a long position, this would mean using the upper band for taking profits, and in a short position, similarly for the lower band.
Combining Donchian Channels With Other Tools
Donchian Channels can be blended with other technical analysis tools to bolster a trading strategy.
Here are several ways to do so:
Moving averages and volume: Moving averages are used to smooth out price data for a period by creating a constantly updated average price.
You can lay them over a Donchian channel to confirm or isolate trends.
Also, you can use volume charts to confirm the solidity of a breakout signaled by the Donchian channel.
Relative strength index (RSI): This measures how rapid price shifts occur.
Often, technical analysts use this data, scored between 0 and 100, to recognize when there’s too much buying or selling of a security.
You can use RSI with a Donchian channel to initiate or back off trades.
For example, a breakout beyond the upper band, with a high RSI, could suggest an overtraded security and signal the need for caution before buying.
Alternatively, a breakout below the lower band and a low RSI could indicate the security is oversold, signaling a potential buying opportunity.
Moving average convergence divergence (MACD): Using MACD with Donchian Channels combines trend and momentum strategies.
MACD measures momentum by comparing two moving averages and can be used to confirm signals from a Donchian channel.
For example, should a price break the upper Donchian band, signaling a bullish trend, a bullish MACD crossover (when the line in the MACD crosses above the signal line) could indicate how strong the trend is.
Likewise, should the price drop beneath the lower Donchian channel and come with a bearish MACD crossover, this would signal that the move downward is a strong trend.
The Difference Between Donchian Channels and Bollinger Bands
Donchian channels plot the highest high and lowest low over N periods while Bollinger Bands plot a simple moving average for N periods plus or minus the standard deviation of the price for N periods times two.
This results in a more balanced calculation that reduces the impact of big high or low prints.
Limits in Applying Donchian Channels
Donchian channels have the same limitations as most other technical analysis charts.
You could be looking at periods that may not reflect the market for an asset or seeing false signals about its future moves.
There’s also the risk of looking for cues to confirm what you wish were the case or have previously concluded.
Here are some potential issues in using Donchian channels:
False breakouts: When a price breaks above or below the Donchian channel, this could suggest a trend, and then it quickly reverses direction.
In the meantime, this might have led to a premature and unprofitable set of trades before the reversal.
Lagging indicator: Donchian channel charts are, at best, lagging indicators.
They depict past price changes but don’t predict them.
The Donchian channel might not supply signals fast enough to trade on in a highly volatile market.
Sideways markets: Donchian channels, like most technical analysis tools, are clearest when dealing with trending markets.
In sideways markets where trading is within a tight range with no evident trendline, the price might touch the upper and lower bands frequently, potentially leading to false signals for trend-following strategies.
Overreliance on them: Donchian channels should be used with other technical analysis tools to confirm signals and check your conclusions against the broader market.
The wrong period setting: Donchian channels give you the best information when you have chosen the right number of periods to calculate the high and low bands.
But, of course, this leads to the question of how to know the number of periods to use.
That comes from experience since there are no one-size-fits-all directions to give.
What works for certain assets or markets might not work well in another.
How Do Donchian Channels Differ From Other Moving Average Indicators?
Donchian channels, unlike standard moving average indicators, focus on the highest and lowest price points over a set time frame.
While moving averages give a smoothed average price trend, Donchian channels create a band enclosing the extreme highs and lows.
This can be particularly useful for identifying breakout points and the size of volatility.
How Do I Pick the Number of Periods for a Donchian Channel?
Selecting the right number of periods for Donchian channels is crucial and should match your trading strategy, your trading horizon, and the market’s volatility.
Fewer periods will be more responsive to price moves, which is better for short-term trading.
A higher number of periods gives you a wider overview of market trends, which is better for long-term trading strategies.
You should also consider the asset or market involved, the range in price for the market or asset over time, and your risk tolerance when setting the number of periods.
Concluding Thoughts
Donchian channels can be a valuable tool in technical analysis.
They provide a means to identify trends and signs of a breakout.
When integrated with other analytic tools like RSI or MACD, Donchian channels can deliver a more complete picture of market trends and momentum.
However, traders should be aware of their limits, especially in sideways markets, and confirm any price signals before trading on them.