

For subscribers of our “Daily Trading Signals”, we now also include a “Weekly Market Report”, where we provide a weekly deep-dive on the market, including fundamentals, technicals, economics, and portfolio management:
Click here for last week’s market report (18 September 2023)
Click here to subscribe for the latest market report (25 September 2023)
Click here to see the archives of all our past market reports
Market Recap & Upcoming Week
In the realm of technology stocks, a potential dampening in their bright outlook is on the horizon. Central to the 2023 market rally, these stocks now grapple with the prospect of prolonged higher interest rates from the Federal Reserve. Historically, the tech sector thrived not only on industry innovation but also on ultra-low interest rates.
But with the Fed’s response to inflation, this once rosy perspective has shifted. This shift was palpable when the tech sector of the S&P 500 dropped by 29% by the end of 2022. Despite signs of recovery earlier this year, thanks to AI innovations and rate cut speculations, sustained inflation and a strong economy have led to renewed skepticism.
Meanwhile, oil prices inch closer to $100 a barrel, intensifying global inflation concerns. While countries like Saudi Arabia and Russia benefit from this surge, the ramifications for the world economy, particularly inflation and its potential effect on interest rates, are profound.
The Federal Reserve’s strategy took center stage as it continued its stance on steady interest rates, hinting at potential hikes by the year’s end. This decision coincides with their revised economic growth projection, foreseeing a 2.1% GDP rise. As the central bank reduces its bond assets, all eyes are on the future decisions of the rate-setting Federal Open Market Committee (FOMC).
Despite challenges such as escalating energy prices, the U.S. consumer spending trends suggest economic optimism. Adding to the intrigue, the Federal Reserve expressed an ambitious vision for a historically “soft landing.” With plans for an extended rate-cutting cycle, they aim for controlled inflation without severe economic repercussions.
Yet, this optimistic outlook comes with its set of challenges, as history tells us that rate escalations tend to be gradual but decreases are often abrupt. The Fed’s hope now hinges on a balance between growth and inflation management.
As we move into the upcoming week, market watchers should remain vigilant about the potential shifts in the investment landscape.
Key focus areas include the impending reports on U.S. home prices and data for new and pending home sales in August. These metrics might provide insight into the health and direction of the U.S. housing market. Alongside, Federal Reserve Chair Jerome Powell’s town hall with educators on Thursday promises to offer significant cues about the central bank’s stance on prevailing economic conditions.
Moreover, the Personal Consumption Expenditures (PCE) Price Index, which is the Fed’s favored measure of inflation, is slated for release on Friday, potentially influencing investment strategies. Amid these macro indicators, a series of earnings reports are due next week from corporate giants, including Costco, Micron Technology, Accenture, Nike, CarMax, and Carnival Cruise Line. These results could offer a snapshot of the business landscape, further guiding investment decisions.
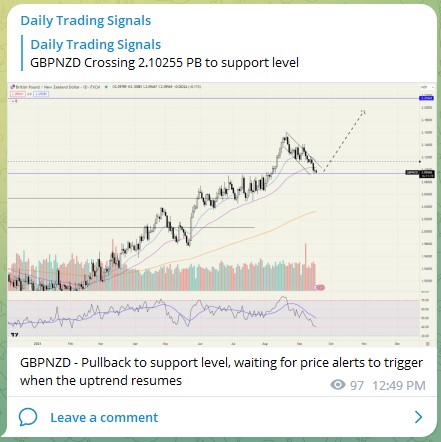
GBPNZD – Pullback to support level, waiting for price alerts to trigger when the uptrend resumes
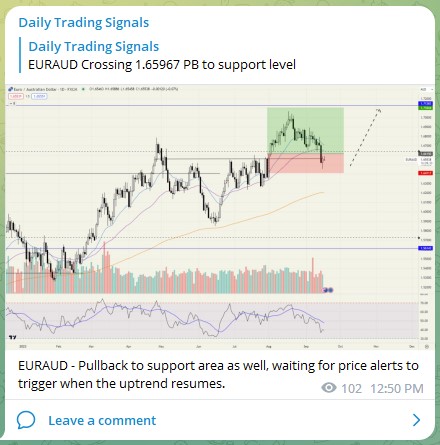
EURAUD – Pullback to support area as well, waiting for price alerts to trigger when the uptrend resumes.

Bitcoin (BTCUSD) – Support levels held once again, will we see a run up soon?
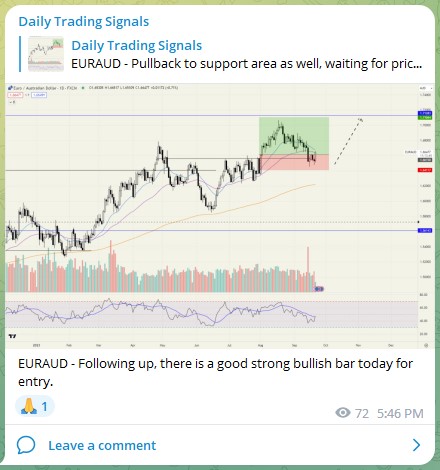
EURAUD – Following up, there is a good strong bullish bar today for entry.
Subscribe for real-time alerts and weekly reports:
👉🏻 https://synapsetrading.com/daily-trading-signals
