

Candlestick Pattern Win Rates: 10 Patterns Tested Against a Random Day
Want the daily routine? Get the free 15-Minute Swing Trader’s Checklist. Get it free →
Published: 17 November 2026 · By Spencer Li, CFTe
I tested 10 classic candlestick patterns on S&P 500 stocks from 2010 to 2019, and none beat a plain day in the same trend by more than luck. The best bullish pattern, the bullish engulfing, won 55.8% of the time over 5 days. But any day after a short dip won 55.0%, so the pattern added less than 1 point. The hammer won 53.9%, a little worse than a random dip day. The 5 bearish patterns were right only 40% to 45% of the time, about the same as betting against any day after a short rise (44.4%). So the candlestick pattern win rates you see quoted can be true and still tell you almost nothing, because most of the win belongs to the trend the candle appeared in. Do note that this tests each pattern on its own, with no confirmation, the way most posts present them, rather than a candle inside a full trading plan.
In June 2025, someone shared a study on r/Daytrading that had gone through more than 127 million price bars, from 1984 to late 2024. It reported success rates for the common patterns, and said some of them had hit around 70% in the early years. The replies were glowing. One reader compared it with a casino, which they said wins only a little over half its games, and wrote: “60% win rate is fantastic.”
That reply is the trap I wanted to test. A casino does not get rich by winning more than half its bets. It gets rich by winning more often than a fair game would allow, and that gap is the house edge. A win rate with no fair game beside it is only half a measurement.
For what each pattern looks like, the definitive guide to candlestick patterns has all of them, and the cheat sheet puts 50+ on one page.
What is a fair game for a candlestick pattern?
It is a day that looks the same as the pattern day, minus the candle.
A bullish reversal pattern only counts after a short fall, by definition. And in a decade when big US stocks mostly rose, a stock that had just dipped tended to bounce anyway, candle or no candle. So the honest comparison for a hammer is every day after a short dip, with the same entry and exit, whether a hammer printed or not. For a bearish pattern, it is every day after a short rise.
I call this the random-day test. Before you trust any win rate, ask one question: what did a random day in the same trend do?
Here is the bullish engulfing, worked out in full.
Bullish engulfing: 55.8% of 10,322 trades won. A random day after a dip: 55.0% won.
Imagine you took 100 of each. The engulfings give you about 56 winners, and the random dip days give you about 55. That is less than 1 extra winner per 100 trades. And the test’s 99.8% range for that gap runs from −2.7 to +3.9 points, so the true gap could easily be zero, or below it.
What were the win rates of all 10 patterns?
The full table, held for 5 days, the measure I picked before the run:
| Pattern | Calls | Signals | Win % (5 days) | Random day, same trend, win % | Gap, points | 99.8% range | Years with a positive gap |
| Bullish engulfing | up | 10,322 | 55.8 | 55.0 | +0.8 | −2.7 to +3.9 | 60% |
| Hammer | up | 8,507 | 53.9 | 55.0 | −1.2 | −4.2 to +1.6 | 20% |
| Morning star | up | 1,527 | 55.1 | 55.0 | +0.0 | −8.7 to +8.8 | 60% |
| Piercing line | up | 1,269 | 53.6 | 55.0 | −1.5 | −10.6 to +8.2 | 50% |
| Three white soldiers | up | 633 | 55.1 | 55.0 | +0.1 | −10.4 to +10.6 | 30% |
| Bearish engulfing | down | 18,212 | 43.8 | 44.4 | −0.5 | −2.8 to +1.7 | 50% |
| Shooting star | down | 9,604 | 43.5 | 44.4 | −0.9 | −3.5 to +1.4 | 60% |
| Evening star | down | 2,130 | 43.8 | 44.4 | −0.6 | −5.3 to +3.9 | 30% |
| Dark cloud cover | down | 1,806 | 44.8 | 44.4 | +0.4 | −4.5 to +5.5 | 40% |
| Three black crows | down | 843 | 40.2 | 44.4 | −4.2 | −12.9 to +6.7 | 30% |
S&P 500 stocks, 2010 to 2019. A win is a trade that made money after costs, in the direction the pattern calls. Gaps are computed before rounding.
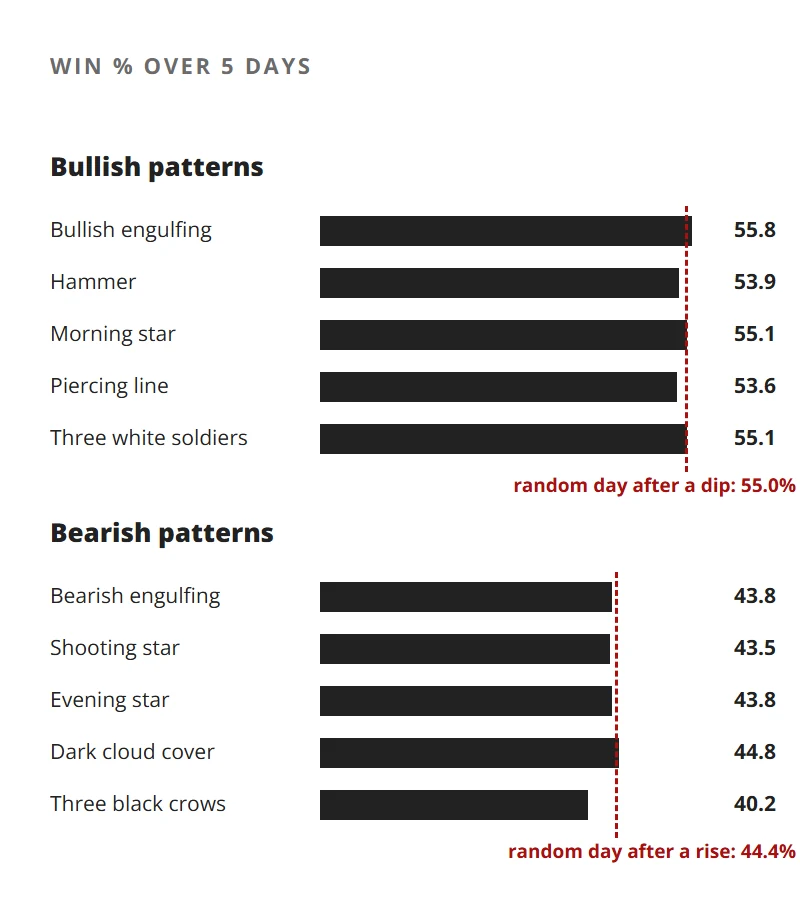
The 1-day and 10-day results tell the same story. The biggest gap in all 30 results was three white soldiers on the next day, 8.6 points worse than a random dip day, and even that one fails. A p-value is the chance of a gap that big turning up by luck alone, and with 30 tests the bar was under 0.0017. That one came in at 0.024.
As for the baselines, after a dip, a long trade won 49.1% over 1 day, 55.0% over 5 days and 56.6% over 10. After a rise, a short trade won 44.8%, 44.4% and 42.8%. On any day at all, a long trade won 48.4%, 53.8% and 55.9%. Basically, the trend sets the odds, and the candle adds nothing.
For a short daily routine that checks the trend before the candle, the free 15-Minute Swing Trader’s Checklist is in the sign-up box at the end of this post.
Why did the bearish patterns lose more often than they won?
Because the market they were betting against kept rising. Large US stocks went up over most of that decade, so a short trade after a rise won only 44.4% of the time over 5 days, and the bearish patterns sat right on that line. Three black crows did worst, at 40.2%.
Suppose you shorted every bearish engulfing in the test. You would have been wrong on about 56 of every 100 trades.
This is where accounts get blown up. A trader sees an evening star at the top of a run, feels the fear that the rally is over, and shorts it. Sometimes it works, and the relief is enormous. But over 2,130 evening stars the call was right 43.8% of the time, and the regret comes from the rest, when the stock just kept climbing.
So which candlestick pattern is the most reliable?
On this test, none was reliable on its own.
Rank the 10 by raw win rate, as a list of the most reliable candlestick patterns would, and the bullish engulfing, morning star and three white soldiers come out on top. Rank them by the gap over a random day in the same trend, and the best is the bullish engulfing at 0.8 points, well inside the noise.
So a ranking by raw win rate is mostly a ranking of trends, because bullish patterns appear after dips, which tended to recover, and bearish ones appear after rises, which tended to keep going.
How did I run the test?
In plain words, in the order it ran (the general steps are in how to backtest a trading strategy):
- Written down first. Before any code ran, I wrote down what would count as an edge: a gap of at least 2 points over the random day, still significant after allowing for 30 tests, and positive in at least 70% of years. I expected most patterns to land within 2 points of their baseline, and they did.
- The stocks. S&P 500 members as listed on each day, so a stock counts only while it was in the index. 491 had price data.
- The years. 2010 to 2019, which covers the 2011 drop, the 2015 to 2016 range, the late-2018 drop and a long bull run.
- The pattern rules. Steve Nison’s descriptions, turned into numbers. A hammer’s lower shadow is at least 2 times its body. The trend before a bullish pattern is a close below its 20-day average and below the close 5 days earlier.
- Entry and exit. The signal is the pattern’s last close. Entry is the next day’s open, and the exit is the close 1, 5 or 10 days later. Every trade pays 0.08% in costs.
- The luck check. Results were resampled 5,000 times in blocks of whole months, so 50 stocks signalling on the same day stay together, rather than passing as 50 separate bets. The ranges are 99.8%, the bar for 30 tests.
- The sturdiness check. Every threshold moved 10% up and down, no verdict changed, and the 5-day gaps shifted under 1.2 points.
- The hand check. 6 signals on Apple’s chart were worked out again from the raw prices, and every one matched.
What does this test not show?
- No full bear market. The decade had sharp drops but no long bear market, and bearish patterns might do better in one. Testing 2000 to 2009 needs data I do not have yet.
- 183 former index members are missing from my price data. Missing dead stocks push raw long win rates up. The pattern and its random day share the same stocks, though, so the gap is far less exposed.
- The pattern alone. No volume filter, no confirmation candle, no stop, no intraday data, and single US stocks only.
- A base-rate study rather than a strategy. No position sizing, no portfolio, and a win rate is only half of any strategy anyway, as win rate vs risk reward shows.
Does this mean candlestick patterns are useless?
No, and saying so would claim more than the test shows.
What it shows is narrow: a pattern taken every time it prints, with nothing else, adds nothing over its trend. That matters, because it is how most posts and screeners present candlesticks. It says nothing about a candle used as the last step of a plan.
Alan Farley, in The Master Swing Trader, treats every setup as a candidate, and warns that “Lazy participants will lose money if they just take candidates and enter blind positions”.
That is close to how I use them. In my own bounce setup, the candle is the last thing I check. The stock first has to fall sharply into a level where at least 2 kinds of support meet, such as a prior swing low and the 50-day or 200-day average. Only then does a hammer count, and the entry waits for the close above it.
Does that add an edge? That needs its own test, written down before it runs. The limitations of candlestick patterns covers the other ways a candle misleads.
How should you read a win rate you find online?
Run the random-day test, which comes down to 3 questions.
- What did a random day in the same trend do? A bullish pattern at 56% means little if a random dip day won 55%.
- How many signals is it built on? On 633 signals, three white soldiers had a 99.8% range of −10.4 to +10.6 points. On 10,322, the bullish engulfing’s ran −2.7 to +3.9. That is the law of large numbers at work.
- Is it after costs, with a fixed exit? Every win in my table is after 0.08% costs and a set holding period. A rate without either cannot be compared with it.
The free checklist in the box below builds the first question into a 15-minute daily routine, so the trend gets checked before any candle does.
So the next time you see a pattern with a 60% win rate, ask what a random day did. Which pattern do you trust most right now? Have you ever checked it against the days it did not print? And if the gap came out at zero, would you still take the trade?
FAQ
What is the win rate of a candlestick pattern?
In this test on S&P 500 stocks from 2010 to 2019, bullish patterns won 53.6% to 55.8% over 5 days and bearish ones 40.2% to 44.8%. None beat a random day in the same trend beyond noise.
Which candlestick pattern has the highest win rate?
The bullish engulfing, at 55.8% over 5 days on 10,322 signals. A random day after a dip won 55.0%, so its real advantage was 0.8 points, well inside the noise.
Are candlestick patterns reliable?
Taken on their own every time they print, this test found no edge over the trend they appear in. It did not test them with confirmation, volume or a stop.
What is the hammer candlestick success rate?
53.9% over 5 days on 8,507 signals, against 55.0% for any day after a dip.
About the author. Spencer Li is The 15-Minute Trader and the founder of Synapse Trading. He is a Certified Financial Technician (CFTe) with 15+ years of trading, run from 70+ countries. He holds a B.Acc and B.BM from SMU. Every trade he takes is public, dated, losses left in. He teaches rules-based swing trading in 15 minutes a day, one system for any market.
Educational content only, not personalised financial advice. Trading carries risk, including loss of capital. Past performance is not indicative of future results. Synapse Trading is not licensed or regulated by MAS.
Want the daily routine? Enter your email for the free 15-Minute Swing Trader's Checklist.
Free 5-page PDF, then occasional trading emails. Education only, not financial advice. Unsubscribe anytime. Kit stores your email in the US: see our privacy policy.
Want to learn the full method? The Trading Mastery Program teaches the 4 strategies I have traded since 2011. It suits beginners and experienced traders.
Rather follow the trades as they happen? Daily Trading Signals is our Telegram channel: my trade ideas with entry, stop and exit, and every trade is public.
Questions about this post? Ask in the free Telegram channel →
Educational content only, not personalised financial advice. Trading carries risk, including loss of capital. Past performance is not indicative of future results. Synapse Trading is not licensed or regulated by MAS.
