• Link to Facebook
  • Link to X
  • Link to Instagram
  • Link to Youtube
  • Link to LinkedIn
  • Link to Mail
Synapse Trading
  • Home
  • About
    • My Background
    • My Trading Journey
    • My Travel Log
    • Media & Interviews
  • Mentoring
    • Trading Mastery Program
    • Results & Testimonials
  • Signals
    • Daily Trading Signals
    • Daily Trading Signals (Results)
  • Telegram (Free to join!)
  • Resources
    • Free Trading Guides
    • Tools & Resources
    • Blog & Infographics
  • Contact
    • Contact Us
    • Partnership Opportunities
  • Click to open the search input field Click to open the search input field Search
  • Menu Menu

Tag Archive for: technical analysis

Spencer Li

Technical Analysis (TA) vs. Fundamental Analysis (FA)

Beginner's Guide
Technical Analysis vs Fundamental Analysis


For many new traders, one of the most common question I get is regarding the method of analysis to use, and it usually boils down to technical analysis vs fundamental analysis.

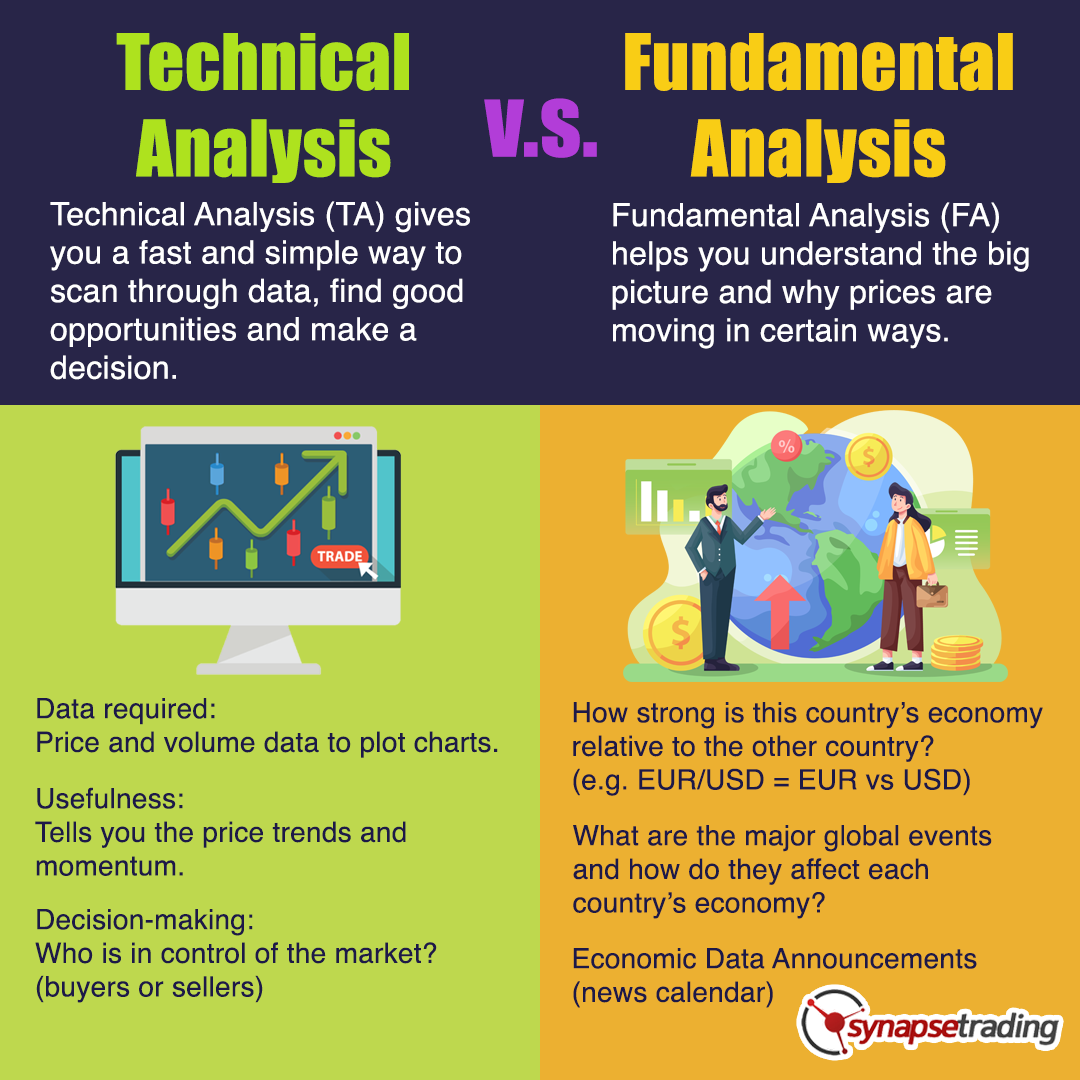
TA vs FA infographic

Technical Analysis (TA) gives you a fast and simple way to scan through data, find good opportunities, and make a trading decision.

Fundamental Analysis (FA) helps you understand the big picture and why prices are moving in certain ways.

Personally, I find that the best approach is to combine them to get the best of both worlds.


thumbnail beginner guide to trading and TA

If you would like to learn how to get started in trading, also check out: “The Beginner’s Guide to Trading & Technical Analysis”


0 Comments/by Spencer Li
https://synapsetrading.com/wp-content/uploads/2018/10/Technical-Analysis-vs-Fundamental-Analysis.jpg 720 1280 Spencer Li https://synapsetrading.com/wp-content/uploads/2019/10/logo.jpg Spencer Li2018-10-04 07:13:162022-07-24 18:59:22Technical Analysis (TA) vs. Fundamental Analysis (FA)
Spencer Li

Warning to Beginners: Avoid the Indicator Trap

Beginner's Guide
Warning to Beginners Avoid the Indicator Trap

It is easy to see why retail traders find indicators appealing because of their ease of use and clear-cut signals. In fact, many new traders think they know all about trading because they have learnt a few basic indicators that generate simplistic buy/sell signals. This kind of thinking is dangerous because it shuts them off from learning real trading skills like price action and behavioral analysis.


Indicator Trap


What are indicators and how are they derived?

There are only five pieces of information we can get from charts: the open, high, low, close and volume. A skilled trader can interpret this in terms of market behaviour of psychology instead of processing it as a bunch of numbers. Indicators, on the other hand, attempt to use shortcut calculations to give meaning to these numbers. As a result, they can never be faster than reading the actual raw data. Manipulating data may also mask its information quality and granularity, causing you to miss out essential essential details.

Do professionals use them?

The answer is minimally. If you go to any bank/fund or professional trading arcade, and observe the traders who trade there, you will notice that their charts are mostly blank. This is not coincidence, because such a chart setup is optimised for reading price action, with as little distractions as possible. If you don’t believe me, go check it out yourself. As said by the famous Leonardo Da Vinci, “Simplicity is the ultimate sophistication.”

The dangers of using indicators without real trading skills

Many traders, especially beginners, are drawn to indicators, hoping that an indicator will show them when to enter a trade. what they don’t realise it that the vast majority of indicators are based on simple price action. Oscillators tend to make traders look for reversals and divergences, and when the market is trending strongly (best chances to make money), they will be repeatly entering counter-trend and losing money. By the time they come to accept that the market is trending, it will be too late to get a good entry to recoup their losses. Instead, if you were simply looking at a blank chart, it would be obvious when a market is trending, and would not be tempted by indicators to keep looking for reversals.

Common heuristics such as “buy when this line crosses this line” or “sell when this is in the overbought region” are some overly simplistic ways of using indicators. Trading in this manner does not give you any understanding about the market. It does not answer the “why” question, such as why this line crossing that line generates a buy signal. Quite often, one may also get conflicting signals from different indicators, and without an understanding of price action, one has no way of resolving the conflict.

Are indicators really needed for your decision-making?

Some pundits recommend a combination of time frames, indicators, wave counting, and Fibonacci retracements and extensions, but when it comes time to place the trade, they will only do it if there is a good price action setup. Also, when they see a good price action setup, they start looking for indicators that show divergences or different time frames for moving average tests or wave counts or Fibonacci setups to confirm what is in front of them.

In reality, they are price action traders who are trading exclusively off price action but don’t feel comfortable admitting it. They are complicating their trading to the point that they certainly are missing many, many trades because their over-analysis takes too much time, and they are forced to wait for the next setup. The logic just isn’t there for making the simple so complicated.

So… Should I be using indicators at all?

The best solution for the retail investor would be to first master a firm foundation of price action and behavioral analysis, and subsequently, should he choose to use indicators, should remember that as their name suggests, they are not “entry/exit signallers”, but merely “indicators”.

Therefore, it is a matter of how you use indicators, and one should always keep in mind that indicators are there to aid you in reading the price action, and not act as a substitute for it. You can think of indicators as the training wheels of a bicycle – you will want to remove them once you learn how to ride properly.

Trading always involves uncertainty, and trying to find comfort in the certainty of indicators will lead to constant indecision, second-guessing and parameters-tweaking.


thumbnail beginner guide to trading and TA

If you would like to learn how to get started in trading, also check out: “The Beginner’s Guide to Trading & Technical Analysis”

1 Comment/by Spencer Li
https://synapsetrading.com/wp-content/uploads/2011/04/Warning-to-Beginners-Avoid-the-Indicator-Trap.png 720 1280 Spencer Li https://synapsetrading.com/wp-content/uploads/2019/10/logo.jpg Spencer Li2011-04-07 01:45:322022-03-07 12:35:11Warning to Beginners: Avoid the Indicator Trap
Spencer Li

What Moves Prices in the Financial Markets?

Beginner's Guide
What Moves Prices in the Financial Markets

Despite what people may otherwise tell you or any preconceived ideas you may have, there are only two things that move stock prices.

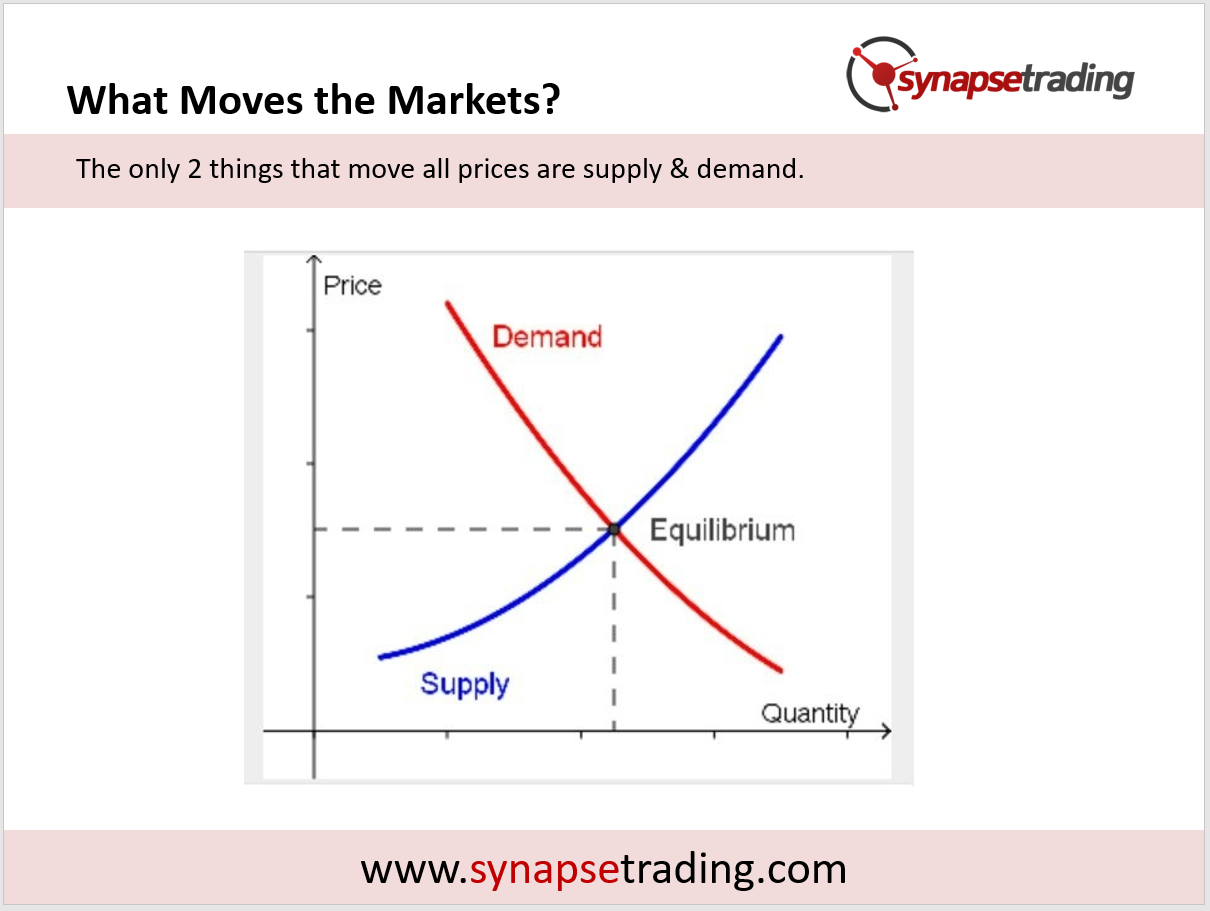
They are supply and demand – nothing more and nothing less. This is the foundation of basic economics as shown in the graph below.

Since quantity remains the same, price is what fluctuates as a results of supply and demand.

If there is more demand than supply for a stock, then the price shall rise.

Conversely, if there is more supply than demand for something, then the price shall fall.

This is absolutely true in any market.

what moves market prices supply demand


The next question is what affects the supply and demand for a particular security or traded instrument.

Is it the profits in the financial statements? The upcoming expansion plans? The new product? Is it dividend payments?

No one can be absolutely sure at any point why people may be buying and selling shares.

That’s where technical analysis comes into play.

At no time does technical analysis attempt to determine why there might be supply and demand, only that there are certain levels of supply and demand.

By studying actual movements in the price and volume, we can go a long way to determining what the present demand and supply is and therefore predicting the future direction price will take.

All fundamental and economic influences on a share price are already taken into consideration in the market, which is reflected in the price.

As a trader, what you are buying and selling is the actual price, not financial statements or ratios like the P/E ratio or ROE figures.

Ultimately, it is the price that ultimately determines whether you make money or not, and what you think the price should be has NO influence whatsoever on the price.

The next big revelation is that the bulk of supply and demand does not come from retail traders or retail investors.

They come from the big boys (BB) and smart money (SM) like traders and fund managers in banks, funds and other institutions.

They are the ones who move the market.

Learning to interpret price action and volume is our window to tap into their psyche and profit from their actions.

who controls market bulls bears

Supply refers to the sellers (bears) who are looking to sell (which pushes prices down), whereas demand refers to the buyers (bulls) who are looking to buy (which pushes prices up).

The constant battle between the buyers and sellers creates fluctuations in prices, which can be as short as a few seconds, or create trends which can last for years.

As a trader, finding the sweet spot where there is an imbalance in the forces (such a a huge build-up of buyers or sellers on either side) can give you an edge in the market, so that you can enter the market just as a big move is about to occur.


thumbnail beginner guide to trading and TA

If you would like to learn how to get started in trading, also check out: “The Beginner’s Guide to Trading & Technical Analysis”

0 Comments/by Spencer Li
https://synapsetrading.com/wp-content/uploads/2010/04/What-Moves-Prices-in-the-Financial-Markets.png 720 1280 Spencer Li https://synapsetrading.com/wp-content/uploads/2019/10/logo.jpg Spencer Li2010-04-22 17:08:512022-07-24 18:52:11What Moves Prices in the Financial Markets?

Free Trading Guides

Free Trading Guides

Blog Categories

  • Beginner's Guide
  • Blockchain & Crypto
  • Book Summaries
  • Economics & News Trading
  • Investing & Portfolio Management
  • Living Your Best Life
  • Market Analysis
  • Markets & Products
  • News & Events
  • Promotions
  • Risk & Money Management
  • Stock Trading
  • Technical Analysis & Price Action
  • Testimonials
  • Tools & Resources
  • Trading Psychology
  • Trading Strategies
  • Trading Tips
  • Travel & Lifestyle

Free Trading Guides

Free Trading Guides

Contact Us

Synapse Trading Pte Ltd
Registration No. 201316168H

Whatsapp: +65-8897-1204
Telegram: @iamrecneps
Email: info@synapsetrading.com

Links

Disclaimer
Privacy policy
Terms & Conditions
Contact us
Partnerships

© 2012-2024 Synapse Trading | All rights reserved | - powered by Enfold WordPress Theme
  • Link to Facebook
  • Link to X
  • Link to Instagram
  • Link to Youtube
  • Link to LinkedIn
  • Link to Mail
Scroll to top Scroll to top Scroll to top