

Avoid the Indicator Trap: How to Use Trading Indicators Without Letting Them Trade for You
Want the daily routine? Get the free 15-Minute Swing Trader’s Checklist. Get it free →
By Spencer Li, CFTe · Last updated: 26 October 2026
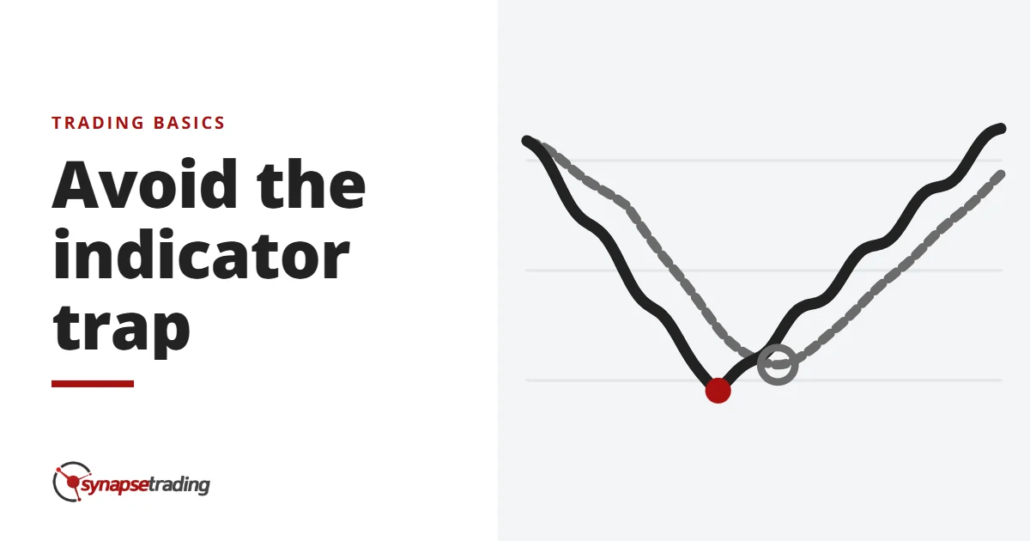
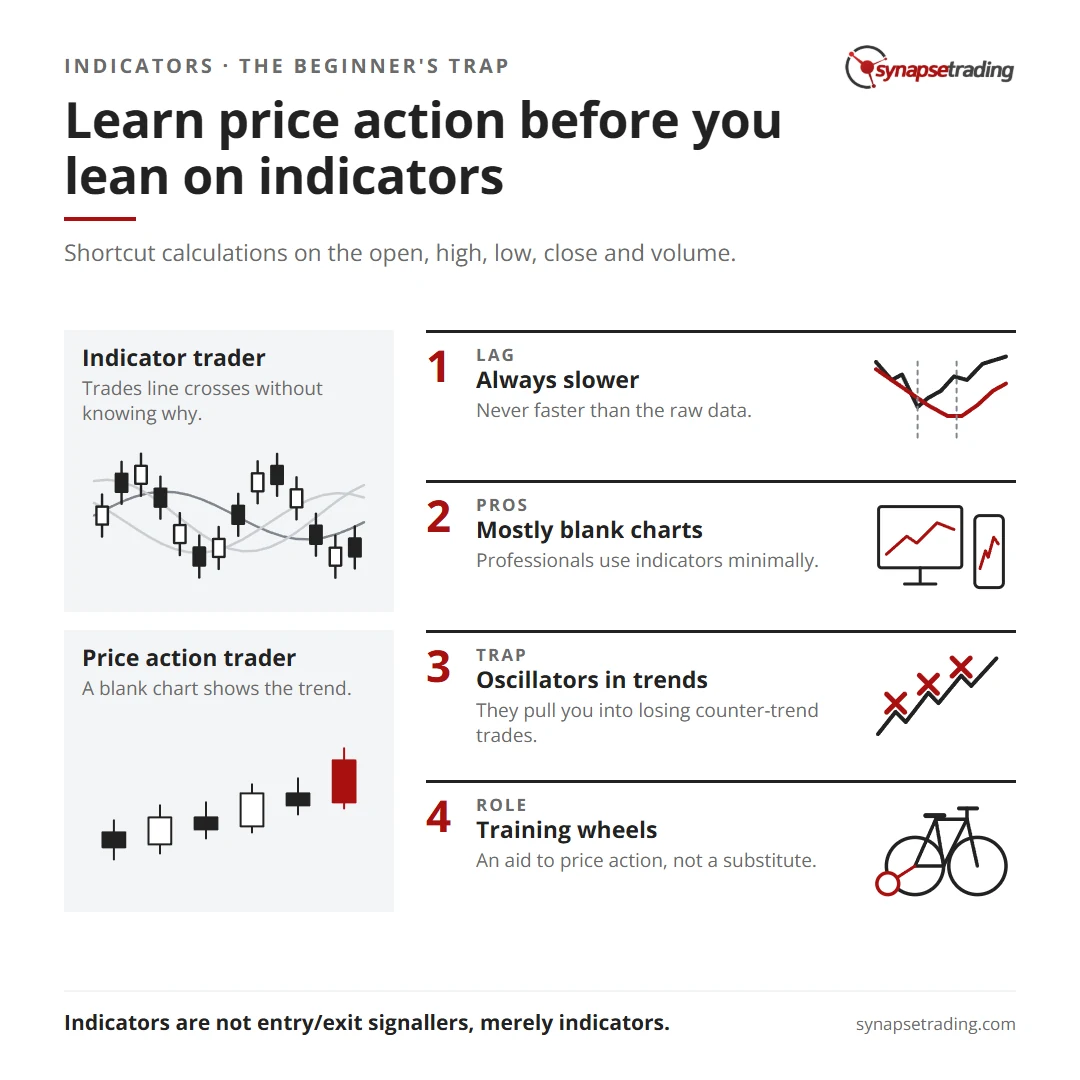
You do not need indicators to trade well, and the trap most beginners fall into is treating one as a signal that tells them when to buy or sell. Every indicator is a calculation made from the same five numbers already on your chart, which are the open, the high, the low, the close and the volume. So an indicator can never know more than the price it was built from, and it always arrives a little after it. Learn to read price first, and then, if you still want indicators, use them as an aid to that reading rather than as a replacement for it.
I first wrote this warning on the blog in April 2011. Fifteen years later the indicators have better colours and the trap is exactly the same.
What is an indicator actually made of?
Every indicator on your chart was cooked from five ingredients. A candle or a bar gives you the open, the high, the low and the close for the period, and the volume tells you how much changed hands. That is the entire menu.
A skilled trader reads those five numbers as behaviour. A long tail below a candle says sellers pushed hard and buyers pushed back harder, and a close near the high on heavy volume says someone was keen to own it by the end of the day. An indicator takes the same five numbers and runs a shortcut calculation over them, so that the result fits on one tidy line.
That shortcut has two costs. First, the line can never be faster than the raw data, because it is made from the raw data. A moving average, for example, is just the average of the last so many closing prices, so by design it turns after price has already turned. Second, the smoothing that makes the line look tidy also throws away detail, and some of that detail was the most useful thing on the chart.
So when people complain that an indicator “lags”, nothing is broken. It is sitting downstream of the price, which is exactly where it was built to sit.
Why are professional traders’ charts so empty?
Back in 2011 I wrote that if you walk into any bank, fund or professional trading arcade and look over the traders’ shoulders, most of their charts are close to blank. A blank chart is set up for reading price with as few distractions as possible, and I told readers who doubted it to go and check for themselves.
I also ended that paragraph with a line credited to Leonardo da Vinci: “Simplicity is the ultimate sophistication.” While rewriting this post I went looking for where he said it, and the answer is quite funny. Wikiquote files it under “Disputed”. The exact phrase first turns up in a 1952 article about a dining room, Apple used it as an early slogan in 1977, and the earliest known book that pins it on Leonardo appeared in 2003, with no citation at all.
So the quote was itself a small lesson in trusting a label without checking what sits underneath it. The point it was making still holds, though. The traders whose job depends on reading the market fast tend to strip the screen down rather than pile things on.
Why do oscillators get beginners into trouble?
Most beginners come to indicators hoping one of them will tell them when to get in. What they rarely realise is that the indicator is built on the same simple price action they have not learned to read yet.
Take the oscillators. An oscillator is an indicator that swings between an “overbought” zone and an “oversold” zone, like the RSI or the stochastics, and it trains you to look for reversals. That sounds sensible until a market starts trending hard. In a strong trend the oscillator sits in the overbought zone for weeks, so it keeps inviting you to sell into strength, and every time you do, the trend shrugs and carries on.

Imagine doing that four or five times in one month. Each loss is small on its own, but the regret builds. By the time you finally accept that the market is trending, the good entries are long gone, and you are tempted to chase just to win some of it back. That is how a few small, polite losses turn into an account that gets wiped out. If you had been looking at a blank chart, the trend would have been obvious, and you would never have felt the urge to keep fading it.
There is a quieter problem as well. Rules like “buy when this line crosses that line” never tell you why. Why should a crossover mean buy? And when two indicators disagree, which happens all the time, you have no way of settling the argument, because you never learned the price action underneath both of them.
If you would rather build the price-reading habit in a few minutes a day, my free 15-minute swing trader checklist is the daily routine I use myself.
Why does an indicator feel so comforting?
Most lifts have a “door close” button, and in many of them it does nothing at all. Rolf Dobelli, in The Art of Thinking Clearly, lists it with pedestrian crossing buttons and fake office thermostats as “placebo buttons”. They exist because pressing something makes us feel in control, even when we are not.
An indicator can play the same role on a trading screen. Trading always involves uncertainty, and uncertainty is uncomfortable, so a line that turns green feels like someone has finally given you permission. In 2011 I put it this way, and I still agree with myself: “Trading always involves uncertainty, and trying to find comfort in the certainty of indicators will lead to constant indecision, second-guessing and parameters-tweaking.”
The tweaking is the giveaway. When an indicator stops working, the instinct is to adjust its settings until the last few months look good again, and then the next few months fail in a new way. Van Tharp makes a related point in Trade Your Way to Financial Freedom. He warns that every indicator and filter you add to a system is one more thing that can be tuned to fit the past, and he says that two indicators and two filters are “probably all you can tolerate”.
Why do some traders stack five tools and still trade price?
Some pundits recommend stacking everything at once, with multiple time frames, several indicators, wave counts, and Fibonacci retracements and extensions. Watch what they actually do at the moment of the trade, though. They take it only when there is a good price action setup in front of them.
And once they see that setup, they go looking for something to confirm it, such as a divergence on an oscillator, a moving average on another time frame or a Fibonacci level. In reality they are price action traders who are not quite comfortable admitting it. The over-analysis also costs them, because by the time all five tools agree, the move has often left without them, and they wait for the next one.
Price action and indicators, side by side
| Price action | Indicators | |
|---|---|---|
| What it is | The raw open, high, low, close and volume | A calculation made from those same five numbers |
| Speed | The source itself, in real time | Always a step behind the source |
| Detail | Every bar, full detail | Smoothed, which can hide detail |
| Answers “why” | Yes, you read the behaviour behind the bars | Rarely, it gives a signal without a reason |
| Best role | The foundation you decide from | An aid that helps you read the foundation |
If you want to go deeper into reading the bars themselves, my guide to price action trading covers candles, levels and structure in order.
Is the “no indicators” crowd just being smug?
In August 2026 a trader on Reddit’s r/Daytrading put the opposite case bluntly: “The ‘no indicators’ cult is the most overrated thing in trading.” Their argument was that many famous traders built careers on technical tools, so refusing every indicator is closer to vanity than to skill.
They have a fair point, and I should concede it with a date on it. I still use indicators myself. In my weekly outlook on 7 May 2026, talking about IGV, a software ETF that had fallen a long way, I pointed out “a nice RSI divergence” for “those of you who are familiar with indicators”. In the very next breath I said that “basically just looking at the price action” you could see a false breakout to the downside, a quick recovery and a small double bottom starting to form.
That is the order I would defend. The price told the story, and the indicator was a second opinion for anyone who likes one. So the honest line is how you use an indicator, rather than whether you use one at all, and the danger only starts when the indicator moves from the passenger seat to the steering wheel.
If you want to see which indicators do which job, my guide to technical trading indicators sorts them into five families, and why trading indicators fail walks through their limits one by one.
So should you use indicators at all?
Think of indicators as the training wheels on a bicycle. They are useful while you are learning, and at some point you will want to take them off and ride properly.
Personally, I think the best order for a new trader is to build a firm foundation in price action and in the behaviour behind it first. After that, if you choose to use indicators, remember what the name says. They are indicators, and they were never meant to be entry and exit signallers. An indicator is there to help you read the price action, and it should never stand in for it.
Reading the chart well is a habit, and habits stick better with a short daily routine. The free 15-minute swing trader checklist is the one I run.

If you would like to learn how to get started in trading, also check out: “The Beginner’s Guide to Trading & Technical Analysis”
FAQ
Do you need indicators to trade?
No. Indicators are calculations made from price, so they cannot show you anything the price does not already show. Many professional traders use them sparingly or keep their charts close to blank.
What is the indicator trap?
It is using an indicator as an automatic buy and sell signal before you can read price action. It hands your decisions to a line you do not understand, and it often leaves you trading against strong trends.
Why do indicators lag?
Because they are built from past prices. A moving average, for example, averages closing prices that have already happened, so it turns after the price has turned.
Why do oscillators cause losses in trending markets?
Oscillators look for reversals. In a strong trend they stay in the overbought or oversold zone for a long time, which tempts you to trade against the trend again and again.
Are indicators useless, then?
No. Used after you can read price, an indicator can be a useful second opinion. The problem is letting it make the decision for you.
What should a beginner learn before indicators?
Price action and the behaviour behind it: what the open, high, low, close and volume say about buyers and sellers. Once that is in place, an indicator becomes an option rather than a crutch.
Which indicator did you lean on hardest when you started, and how long did it take before you noticed what it was doing to your trades? Let me know in the comments.
If you are building your foundation from scratch, my free trading guides put the basics in order.
And if you want a routine that reads price instead of a wall of lines, grab the free 15-minute swing trader checklist.
About the author. Spencer Li is The 15-Minute Trader and the founder of Synapse Trading. He is a Certified Financial Technician (CFTe) with 15+ years of trading, run from 70+ countries. He holds a B.Acc and B.BM from SMU. Every trade he takes is public, dated, losses left in. He teaches rules-based swing trading in 15 minutes a day, one system for any market.
Education, not financial advice. Synapse Trading is not licensed by MAS to advise on investment products. Trading carries risk of loss, and past performance is not indicative of future results.
Want the daily routine? Enter your email for the free 15-Minute Swing Trader's Checklist.
Free 5-page PDF, then occasional trading emails. Education only, not financial advice. Unsubscribe anytime. Kit stores your email in the US: see our privacy policy.
Want to learn the full method? The Trading Mastery Program teaches the 4 strategies I have traded since 2011. It suits beginners and experienced traders.
Rather follow the trades as they happen? Daily Trading Signals is our Telegram channel: my trade ideas with entry, stop and exit, and every trade is public.
Questions about this post? Ask in the free Telegram channel →
Educational content only, not personalised financial advice. Trading carries risk, including loss of capital. Past performance is not indicative of future results. Synapse Trading is not licensed or regulated by MAS.


Comments are closed.