Ascending Triangle & Descending Triangle Pattern Strategy Guide (Updated 2025)
Join our Telegram channel for more market analysis & trading tips: t.me/synapsetrading
The triangle price pattern is a type of continuation price pattern, where prices get compressed and converge over time, until price breaks out in either direction.
There are 3 different types of triangle patterns – the symmetrical triangle, the ascending triangle, and the descending triangle, each with different trading strategies.
In this post, I will show you how to take advantage of the triangle pattern to trade breakouts, how to avoid false breakouts, and the best trading strategies for this price pattern.
Table of Contents
What are Triangle Price Patterns?
A triangle pattern, as its name suggests, is a triangular consolidation range in which prices moves about.
The triangle pattern generally represents a medium-term consolidation of prices, and is usually found in the mid/late stages of a trend.
Since it is a medium-term pattern, the triangle pattern usually consists of 50-100 bars, and most of the time results in prices breaking out in either direction as prices get compressed.
As prices get squeezed towards the tip of the triangle, prices will be forced to break out of the pattern, and the direction is takes will depend on the type of triangle.
There are 3 main varieties of triangles – namely the ascending triangle, the descending triangle, and the symmetrical triangle, and we will be going through each one in more detail later on.
Triangle Pattern Psychology
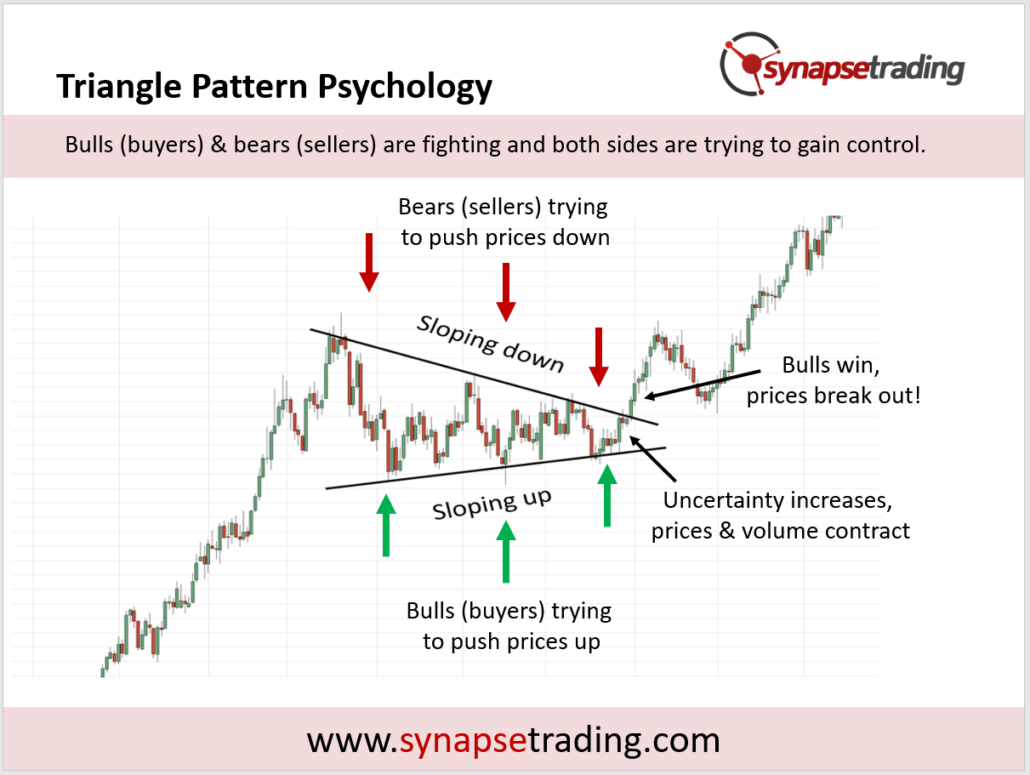
In the triangle pattern, bulls (buyers) & bears (sellers) are fighting and both sides are trying to gain control. Bulls want higher highs and higher lows, while bears want lower highs and lower lows.
As the fight intensifies, uncertainty increases and volume decreases, as the range of prices start narrowing, so both bulls and bears choose to wait on the sidelines until the direction becomes clear before jumping in again.
That is why once a breakout occurs, price and volume tends to spike, as all the buyers or sellers waiting on the sidelines start making their move.
How to Tackle Each Type of Triangle Pattern
As we have seen, all triangles consist of 2 sloping lines which converge, but the main difference lies in the gradient for each pairs of lines.
- Symmetrical triangle – both lines are sloping inwards (top line slopes down and bottom line slopes up)
- Ascending triangle – top line is flat, while bottom lines slopes up
- Descending triangle – bottom line is flat, while top line slopes down
The slope of these lines have a great significance, which I will cover in greater detail by going through each triangle pattern.
a) Symmetrical Triangle Price Pattern
The symmetrical triangle with its converging lines show that both sides (buyers and sellers) are equally matched, which makes it hard to predict which side the breakout is going to happen.
Since it is a continuation pattern, the odds will tend to favour direction of the existing trend, but it is still much harder to trade compared to the next 2 triangle patterns.
b) Ascending Triangle Price Pattern
The ascending triangle, with its bottom line sloping up, shows a bullish bias, as this indicates a series of higher lows.
Recap: A series of higher lows and higher highs is an uptrend.
The flat line on top, which now serves as resistance, becomes a clear level for price to attack and break, and if it succeeds, will lead to higher highs.
Hence, there is a higher probability of an upside breakout for the ascending triangle, especially if it forms in the middle of an existing long-term uptrend.
c) Descending Triangle Price Pattern
The descending triangle, with its top line sloping down, shows a bearish bias, as this indicates a series of lower highs.
Recap: A series of lower highs and lower lows is a downtrend.
The flat line at the bottom, which now serves as support, becomes a clear level for price to attack and break, and if it succeeds, will lead to lower lows.
Hence, there is a higher probability of a downside breakout for the descending triangle, especially if it forms in the middle of an existing long-term downtrend.
Triangle Pattern Trading Strategies
There are 2 main strategies, which focus on the directional triangles (ascending triangle and descending triangle), and the difference lies in how early to enter the breakout when it happens.
- Breakout Entry: Enter immediately
- Pullback Entry: Wait for a pullback after the breakout
Something to take note of, breakouts usually occur when prices are around 2/3 to 3/4 of the pattern length, and if prices go past the 3/4 mark, there is a possibility that prices may just continue to meander sideways without breaking out. This would mean a failed pattern.
Now, let’s go through each strategy in greater detail.
Trading Strategy #1: Breakout Entry
Our first strategy for the triangle price pattern is to enter on the breakout of an ascending triangle or descending triangle pattern.
As mentioned previously, a triangle is a compression of prices while buyers and sellers wait on the sidelines for a breakout. For this setup, we will be looking to enter just as the breakout happens.
In the example above, we see a prior uptrend, so we know the odds for an upside breakout are higher.
As the ascending triangle forms, we see a series of higher lows (and similar highs) forming, showing a gradual build-up of bullish pressure. We also see prices pushing against the resistance level formed by the similar highs.
Finally, the resistance gives way, and prices through.
For trading, we would look to enter near the point of breakout, keeping an eye for strong price action and volume to support the breakout. We can also use the breakout bar(s) to place a stoploss.
Note that this strategy works just as well with a descending triangle, you’ll just have to flip the pattern around for a downside breakout.
This strategy works best if the prior trend (before forming the triangle pattern) is strong, and has a higher chance of success if the triangle is smaller, in terms of height and duration.
Trading Strategy #2: Pullback Entry
Our next strategy for the triangle price pattern is to enter on a pullback after the initial breakout.
As covered in the previous setup, one of the ways to trade an ascending triangle or descending triangle is to enter the moment price breaks out of pattern.
However, sometimes the odds of a successful breakout might be lower, for example if the triangle pattern is large (more uncertainty), or the pattern goes against the prior trend (bullish ascending triangle in a downtrend, or bearish descending triangle in an uptrend).
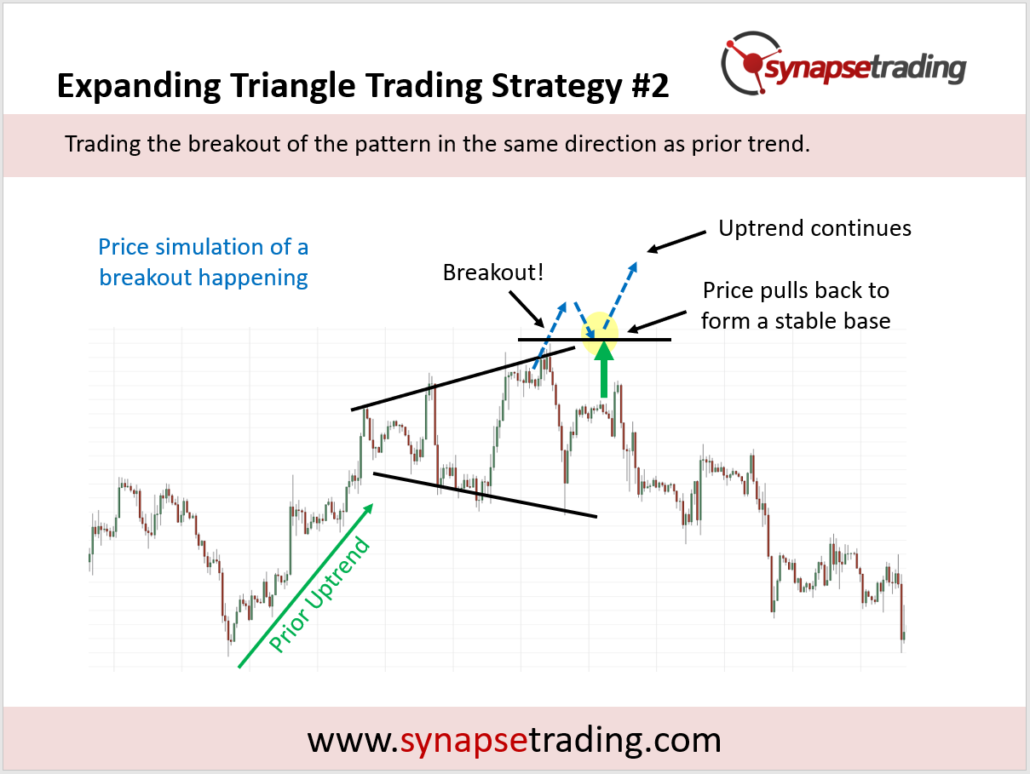
In the example above, we see a prior uptrend, followed by a bearish descending triangle. This sets up up a little contradiction, which suggests that the breakout might not be as strong or as clear-cut.
Therefore, when the breakout happens, instead of entering the trade immediately, we wait to see if there is a pullback to test the support-turned-resistance level (which was the flat line of the descending triangle).
For trading, we would look to enter once the pullback is completed, and prices start to head back down. The end of the pullback would also be a good place to put your stoploss.
Note that this strategy works just as well with an ascending triangle, you’ll just have to flip the pattern around for an upside breakout.
Which Triangle Pattern to Avoid?
You might have noticed that I left out the symmetrical triangle in both the strategies mentioned earlier.
The reason is that I find the symmetrical triangle the least reliable pattern of the 3 triangle patterns.
This is because it is hard to confirm a successful breakout of this pattern, and even harder to determine a good entry point.
In the example above, prices have broken out to the upside of the symmetrical triangle pattern.
However, because of the nature of the pattern, there will still be another high (or low, if it broke to the downside) which prices have to surpass, and it becomes a resistance level.
As a result, even after the breakout, we are not sure if prices have starting trending, or whether prices are still within a wider range.
We can only be sure after prices have broken the new resistance level and continues climbing, in which case the original symmetrical triangle breakout did not really have much significance or trading opportunity.
Hence, I would prefer to focus on those patterns which have a more predictable outcome.
Profit Target for the Triangle Pattern
Once a triangle pattern is completed, one of the most useful things about it is its ability to provide a price projection, which can be used to estimate a minimum profit target for your trade.
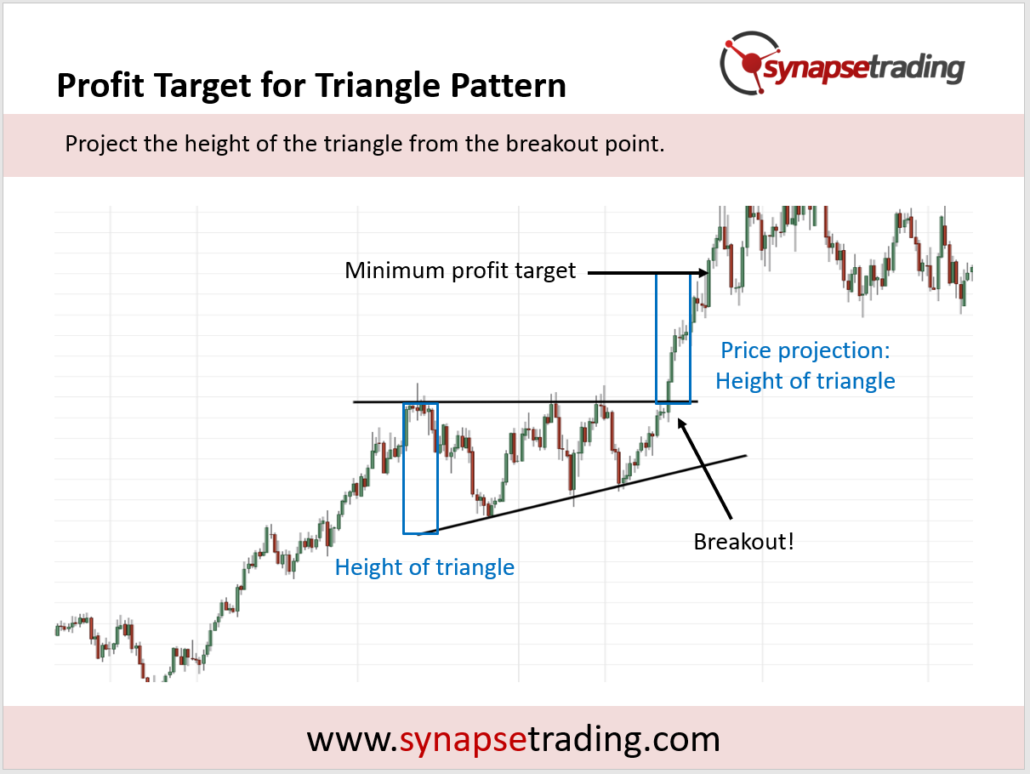
This can be done by taking the maximum height of the triangle, and projecting that distance from the breakout point.
In the chart above, the maximum height of the triangle is indicated by the blue rectangular box, which is then used as a price projection at the breakout point.
The black horizontal arrow indicates the price level which serves as the minimum profit target for the triangle pattern breakout.
This price projection technique can be used in conjunction with other methods, such as support and resistance levels, and if there is any confluence, gives an added layer of confirmation.
Tips from the Trading Desk
- Trade with the larger trend, as breakouts are more likely to happen in the same direction as the prior trend
- Watch out for triangles that are themselves a part of a larger price pattern
- Look out for major support and resistance levels
As you can see from the chart above, this is an example of trend trading using the triangle pattern, because the triangle formed is actually a consolidation pattern within the major trend, so this whole triangle is actually a pullback opportunity to enter the underlying trend.
Although we generally do not like trading symmetrical triangles, the odds in this case are better than 50-50 because there us a higher chance of an upside breakout due to the context (triangle pattern pullback in major uptrend).
Besides strong trends, triangle patterns can also form near the edges of support or resistance levels, when prices are trying to push through that price level, so you might see them near the necklines of other patterns, such as the double top/bottom, or head and shoulders pattern.
In a sense, the triangle pattern becomes part of these larger patterns depending on the context.
Now that I have shared all about the triangle pattern, what is your favourite triangle pattern strategy for trading?
Let me know in the comments below.

If you would like to learn all the different price chart patterns, also check out: “The Definitive Guide to Trading Price Chart Patterns”
 Our flagship mentoring program is suitable for both beginners and advanced traders, covering the 4 strategies which I used over the past 15 years to build up my 7-figure personal trading portfolio.
 If you're looking for a reputable brokerage that covers all products (SG stocks, US stocks, global stocks, bonds, ETFs, REITs, forex, futures, crypto) and has one of the lowest commissions, this is what I currently use.
After trading for 18 years, reading 1500+ books, and mentoring 1000+ traders, I specialise in helping people improve their trading results, by using tested trading strategies, and making better decisions via decision science.


Do you think that these patterns are more accurate on a short term or long term charts?
Actually, they work for all timeframes, including long-term and short-term. On the shorter-term, you will see them appear more frequently, so you filter them out to pick the best ones. On the other hand, om the longer-term, there will be less noise and less chance of a false pattern.
Thanks for the reply!
You’re welcome, love to help!
“This price projection technique can be used in conjunction with other methods, such as support and resistance levels, and if there is any confluence, gives an added layer of confirmation”, I also understand there are other recommendations that the risk to reward ratio is 1:3, is it advisable?
The price projection actually has nothing to do with the reward to risk ratio (RRR). The price projection gives you a potential target price based on the pattern, whereas the RRR is the ratio of your potential gain (difference between target and entry price) to the potential loss (difference between entry price and stoploss).
Thanks for getting back. So what are methods do you use personally?
You’re welcome! I use a combination of indicators, classical TA, and price action. Mostly price action I would say.
Looks like you are not a day trader… I don’t like to clutter my charts with too many things as I cannot determine when is the next best course of action with the action moving quickly in the background.
Thanks for sharing this info! Appreciated!
You’re welcome!
Hello. I usually use the breakout and pullback method myself.
That’s great, keep it up!
I like to see breakouts. The signs are more obvious and easier to analyze.
Just starting out here! Learning these cute little patterns 😀
Slow and steady!
How long it took you to study before you make your first actual trade?
How do you identify false breakouts or pullbacks?
You need to look at the overall context of where the breakout or pullback is happening, then study the price action (and volume). Every piece of information is an important clue.
How do you determine in real time when is the bottom of a bear run? As it could be a descending triangle or a falling wedge.
The context is very important. If it is in the middle of a downtrend, or near the start of one, then you would more likely see continuation patterns such as the descending triangle. If the trend is already in the late stage, then there is more chance of reversal patterns, such as the falling wedge.
Thanks for the clearer picture!
After the breakout, how much do we aim for profit? Example, I know the pattern is breakout, what is the “ideal” target price to take profit?
You can use the measuring objective of the pattern as a profit target.
I’m trying out this strategy, using a multiple of ATR above and below the top line on ascending triangle to determine entry / stop loss.
Regarding profit target, how do you determine where the start of the triangle is? In your example above, looks like if you extended the trend line to the left it would be perfect for some lower candles.
The start of the triangle can be determined by the first point you use in drawing the lines for the triangle.
Thank you for the lesson
I found this kind of pattern powerful to get profit and easy to identify. I typically trade Spy & Spx tickers, however if I decided to be a triangle pattern “hunter”, are any way or kind of screening that I can use to find this kind of opportunity/pattern or its is just a matter of “visual” screening on the ticker of interest? Btw, very nice and helpful article. Thx in advance!
Personally I prefer to screen visually, because I have not come across any reliable automated screeners.
Thx x your response!
hello i am so appriciated from this website
Good experience shared Spencer. Thank you and following yr posts!