Stalled Pattern (Deliberate Pattern)
Join our Telegram channel for more market analysis & trading tips: t.me/synapsetrading
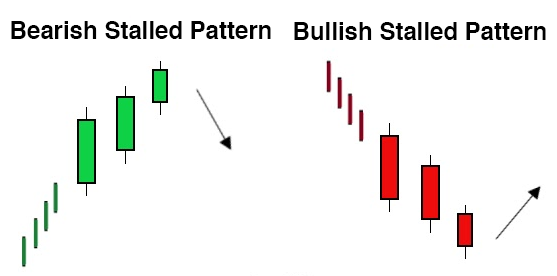
A stalled pattern is a candlestick chart pattern that occurs during an uptrend but signals a potential bearish reversal.
It is also referred to as a deliberation pattern.
Candlestick charts display the open and closing prices of a security, along with their highs and lows for a specific period.
These charts are named after the way the illustrations resemble candles and their wicks.
A stalled pattern suggests indecision in the market and may indicate a limited potential for traders to turn a quick profit through short-term trades.
Table of Contents
Understanding Stalled Patterns
A stalled pattern does not always result in a bearish reversal.
However, if the candle following the stalled pattern moves below the midpoint of the second candle’s real body, a bearish reversal becomes more likely.
Traders often interpret this as a signal to consider cutting their losses.
Reversals can occur rapidly, sometimes within a single day.
However, market analysts often look for reversals that unfold over longer periods, such as weeks.
Technical analysts scan for reversal patterns throughout the day to inform their trading strategies.
Intraday reversals are usually triggered by events like company announcements or news reports that can quickly alter investor sentiment.
A bearish trend, or downward trend, is characterized by a series of lower highs and lower lows.
Once bearish, a market can reverse into an uptrend when both the highs and lows begin to rise.
Understanding Candlestick Charts
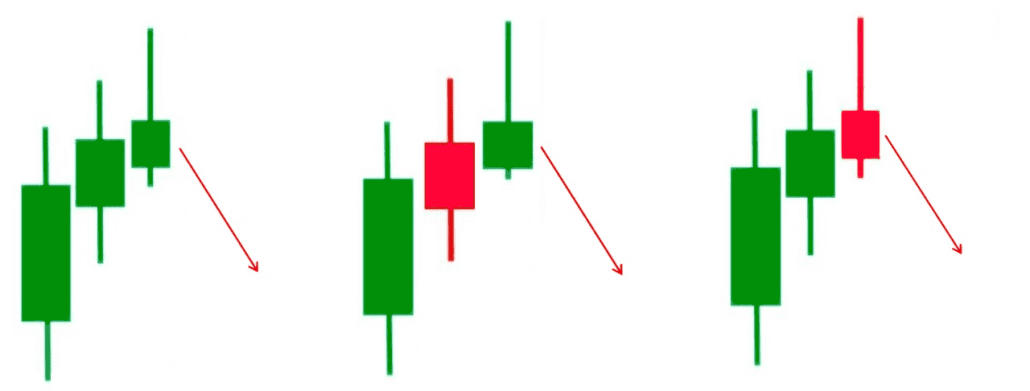
A stalled pattern chart consists of three white candles and must meet specific criteria.
First, each candle’s open and close must be higher than that of the previous candle in the pattern.
Second, the third candle must have a shorter real body than the other two candles.
Finally, the third candle should have a tall upper shadow, with an open that is near the close of the second candle.
The wide part of the candle on the chart is known as the real body.
It represents the range between the opening and closing prices of a security over a given time period.
If the real body is black or red, it indicates that the stock closed lower than it opened.
If it is white or green, the stock closed higher.
Investors and market observers can also look for reversals in subsequent candles that follow the stalled pattern.
One indicator of such a reversal is the bearish engulfing pattern.
Concluding Thoughts
The stalled pattern is an important candlestick formation that can signal a potential shift in market sentiment.
While it does not always lead to a bearish reversal, traders should be cautious when they spot this pattern, especially if subsequent price action confirms the reversal.
Understanding the nuances of candlestick charts, including patterns like the stalled pattern, can provide traders with valuable insights into market movements and help inform their trading decisions.
 Our flagship mentoring program is suitable for both beginners and advanced traders, covering the 4 strategies which I used over the past 15 years to build up my 7-figure personal trading portfolio.
 If you're looking for a reputable brokerage that covers all products (SG stocks, US stocks, global stocks, bonds, ETFs, REITs, forex, futures, crypto) and has one of the lowest commissions, this is what I currently use.
The Synapse Network is our dedicated global support team, including event managers, research teams, trainers, contributors, as well as the graduates and alumni from all our previous training program intakes.


Leave a Reply
Want to join the discussion?Feel free to contribute!