Market analysis, insights and trading ideas on various markets and products!

Long-term refinancing operations (LTROs) involve the central bank lending money at a very low interest rates to eurozone banks, which has led to the term “free money.”

The injection of this cheap money means that banks can use it to buy higher-yielding assets and make profits, or to lend more money to businesses and consumers – which could help the real economy return to growth as well as potentially yielding returns.

Banks can use assets such as sovereign bonds as collateral for the loans – although they can no longer use Greece’s bonds as collateral after the country was downgraded to a default rating by Standard & Poor’s. This has helped to boost some of the more troubled sovereign bonds, in peripheral countries such as Spain and Italy, as their yields have fallen because they are being used as collateral for the operations.

This can help out the entire country. Spanish and Italian banks, the biggest buyers in the last operation, used their holdings of their own sovereign bonds as collateral for the LTROs. This helped reduce sovereign bond yields, which were threatening to stay at unsustainable levels that would make debt repayments impossible.

In previous auctions, the money usually had to be paid back within three months, six months or 1 year. The ECB’s launch of three-year LTROs in December meant that this time scale was extended, which helped cause a much greater takeup than usual.

– references: CNBC


The question is, what happens after 3 years?

Unless the Euro zone countries can miraculously turn their economies around in 3 years, the problem has just been delayed by 3 years. If the banks choose not to loan out the cash, they can simply use the money to increase their returns via investments, which does not benefit the economy at all. Also, where does the ECB get this cash from? It will need to pay back the cash one day, or risk the devaluation of the Euro, similar to what the US is facing now. The collateral used are the sovereign bonds (which no one wants to buy in the first place), and should the countries decide to default, the ECB will be left with a lot of useless junk on their hands.

Global Market Highlights

China Cuts Bank Reserve Ratios
Greece Identifies $427M in Budget Cuts
Higher Prices Pinch Shoppers, Constrain Fed’s Options
Obama Urges Congress to Reward Technology Companies That Keep Jobs in U.S.
Germany drawing up plans for Greece to leave the euro
Dow nears psychological milestone: 13,000
S&P 500 nears 3-year high amid Greece bailout optimism

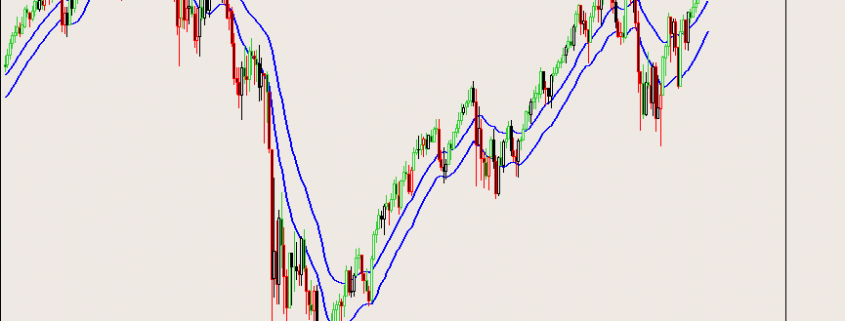
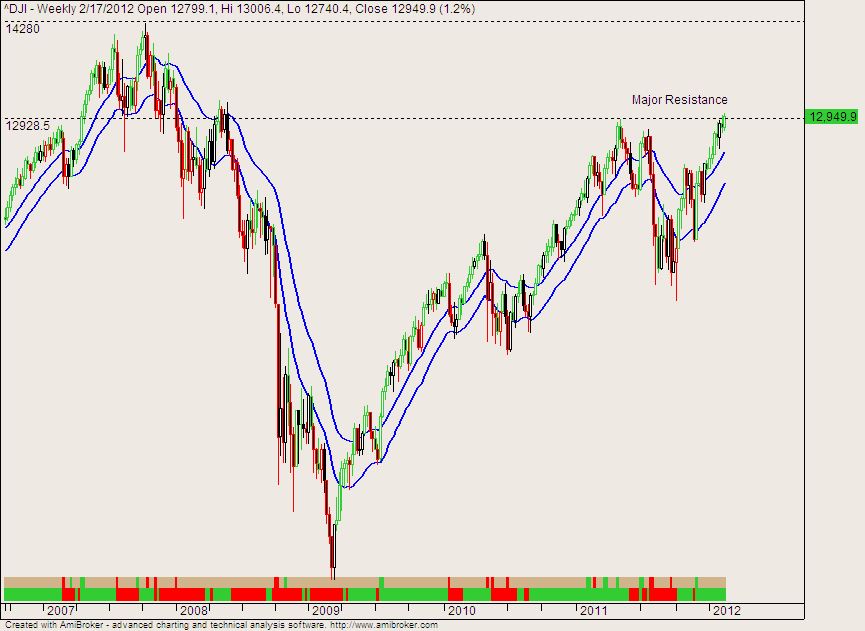
Global Stock Indices (Dow Jones Index) Weekly Chart

^dji-021912

On the weekly chart, the Dow is nearing major resistance, which coincides with the psychological level of 13,000. Get ready to short on signs of weakness, or wait for a breakout pullback setup.

Forex Markets (EUR/USD) Daily Chart

eurusd-021912

Currently, for the Euro, the major trend is down, although the minor trend for the past month or so has been up. After breaking above the support-turned-resistance, the breakout has failed and prices have pulled back below that level. It is now preferable to go short, unless the failed breakout fails and becomes a breakout pullback, in which case be prepared to go long.

Singapore Stocks (Straits Times Index)

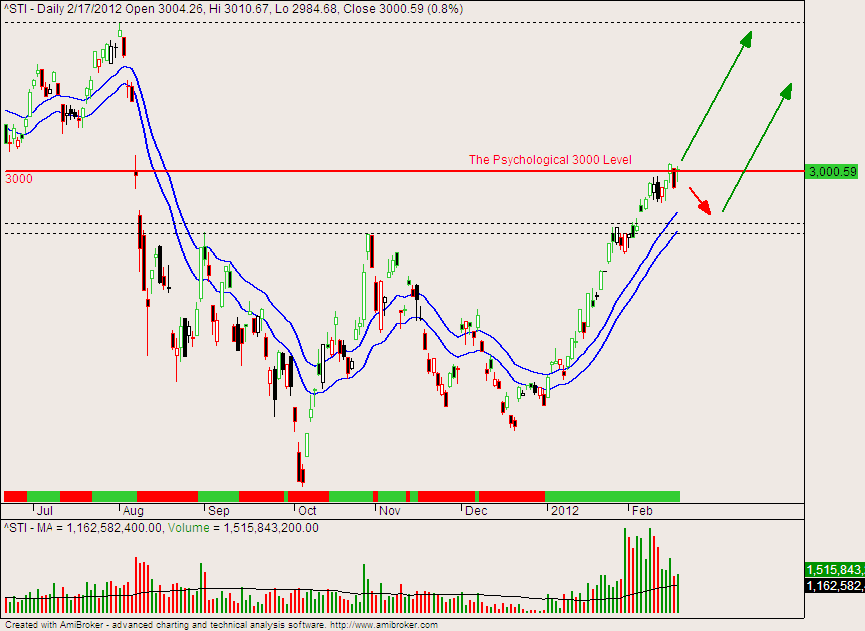
^sti-021912

After clearing the key support-turned-resistance level, the STI has surged up to test the psychological round number of 3,000. Since there has been no significant pullback, this could be a chance for the STI to pullback before it resumes climbing up. On the other hand, prices have closed above 3,000 on Friday, and if it holds above that level, we could see higher prices.

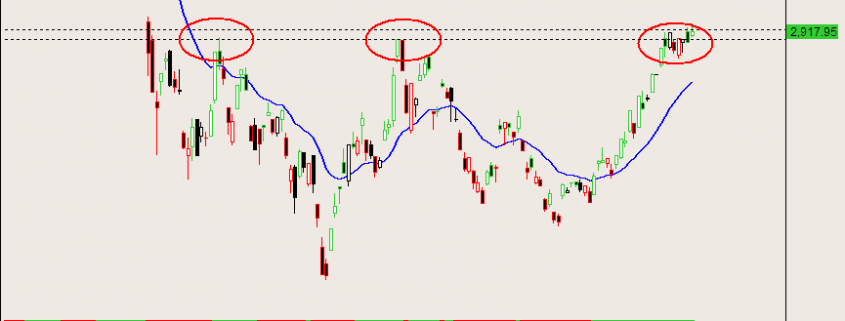
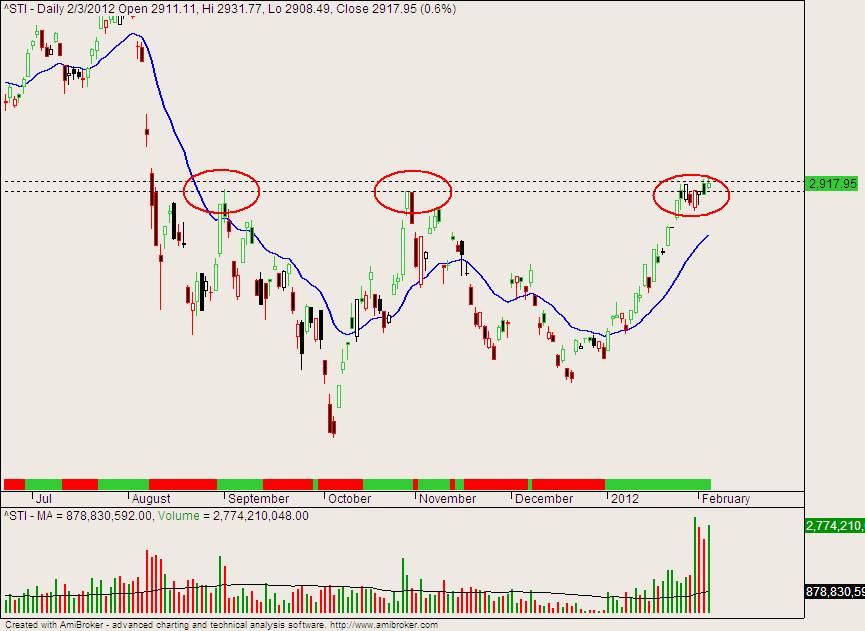
Straits Time Index (STI)

Last week, the price action was clustered around the resistance level, forming a small pullback that may be interpreted as a flag. However, we have not seen a strong breakout or follow-through from the flag, which we should be looking out for this coming week. Given the strong close on the US front after the positive jobs report on Friday, we should see the STI gap up on the open. Do not be tempted to chase the market, and wait for a good setup for entry. If you want to take a long position, go in with 1/2 or 1/3 your usual size, and trail your stops. Based on weekly swing counts, the trend is still down.

For those who have no positions, do not be sore about missing out. Trading is about making calculated risks, and part of the challenge is accepting the reality that you will be wrong 30-40% of the time. Be skeptical when people claim to consistently pick the tops and bottoms with “special” methods. If their method works so well, they would be working for a fund trading millions of dollars instead of selling their “special” methods for a quick buck. Stick to the core principles, and trust yourself. Self-proclaimed gurus come and go, but the core tools of technical analysis have stood the test of time.

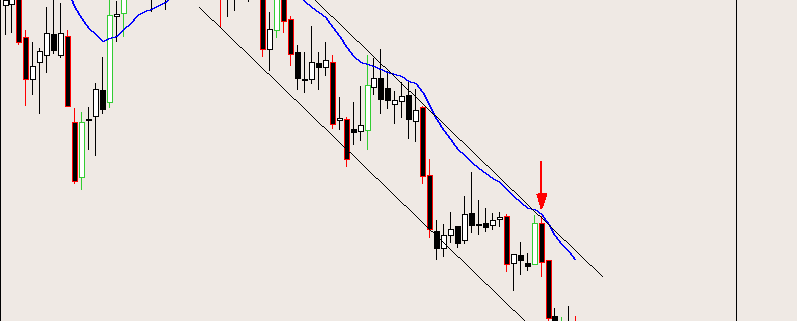
downtrend channel

As expected, there was a strong selldown within the channel. Prices may rebound or consolidate, now that they are near the channel bottom.

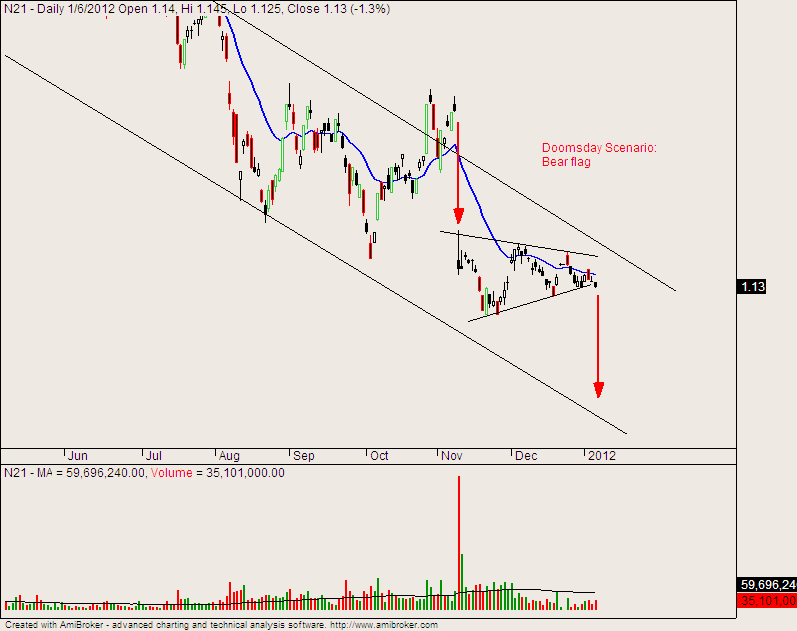
n21-010912

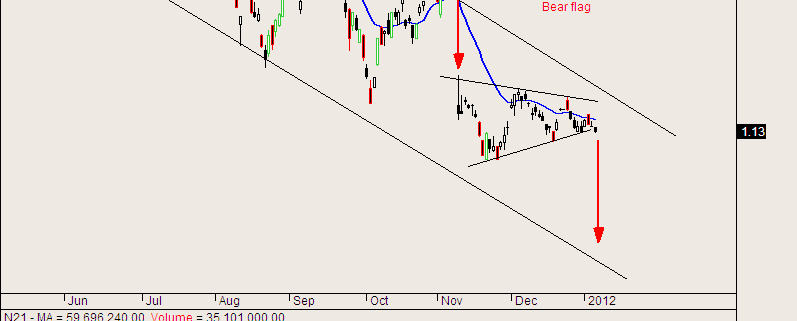
Many people have been asking me about Noble, and to me it looks bearish. After gapping down, it has never really reboubded or recovered, instead merely consolidating sideways. This is typical of weak stocks. If we use the gap down as a flagpole, we can measure a doomsday scenario estimation for Noble. Do note that this is just a best guess estimate.