Market analysis, insights and trading ideas on various markets and products!

november market wrap

Macroeconomic Indicators and Central Bank Policy

The U.S. Federal Reserve entered November on pause but firmly tilted toward easing. With key data releases disrupted by a federal funding shutdown (the longest in history at 43 days), Fed officials increasingly signaled a readiness to cut rates. By late month, markets were pricing in roughly 85 percent odds of a 25 bps Fed rate cut in December.

New York Fed President John Williams hinted that the time for policy easing was nearing, helping convince forecasters like J.P. Morgan to pull forward their cut expectations from 2026 into December 2025. The shutdown’s impact was evident: October’s jobs and inflation reports were canceled or delayed, leaving policymakers flying blind on recent data.

When government offices reopened mid-November, a backlog of reports showed a mixed picture. For instance, consumer confidence for November plunged to 88.7, a post-pandemic low, and retail sales in September (finally reported in late November) rose just 0.2 percent, undershooting forecasts.

On the inflation front, producer prices were tame (0.3 percent in September, with core PPI only 0.1 percent), and the absence of an official CPI release suggested price pressures remained contained. Meanwhile, labor market signals weakened slightly: a private ADP report indicated U.S. employers shed jobs through late October, and weekly jobless claims crept up – subtle signs that the once-hot job market is cooling.

Treasury yields responded dramatically to the shifting outlook: the 10-year yield, which had been above 5 percent earlier in the fall, fell to around 4.0 percent by late November, reflecting investors’ expectations of imminent Fed easing. In fact, the entire yield curve eased and started to re-steepen (the 2-year yield slid under 3.6 percent while longer yields held around 4.0 to 4.6 percent), a bullish signal for future growth. The prospect of the Fed pivoting to rate cuts, combined with the restoration of government operations, helped brighten market sentiment in the latter half of the month.

Other major central banks also positioned themselves more dovishly as inflation showed signs of peaking. The European Central Bank (ECB) held interest rates unchanged again at its late-October meeting, keeping the deposit rate at 2 percent. ECB President Christine Lagarde stated policy is in a good place with the euro-zone economy proving resilient despite past rate hikes. Indeed, euro-area Q3 GDP grew a modest 0.2 percent, better than expected, and headline inflation continued to ease toward the 2 percent target.

With risks to growth abating helped by improved trade relations and a calmer geopolitical backdrop, officials saw no urgency to cut rates immediately. However, with internal forecasts likely to show sub-target inflation in coming years, discussion of future rate cuts is expected to heat up at the December ECB meeting. Financial markets are already pricing in at least one ECB rate reduction by mid-2026, reflecting confidence that the tightening cycle is over.

Over in the UK, the Bank of England (BoE) similarly stood pat but with greater debate. At its early November meeting, the BoE voted 5 to 4 to keep Bank Rate at 4.00 percent, as four MPC members dissented in favor of an immediate 25 bps cut. This razor-thin decision underscores that British monetary policy may have reached a turning point: inflation in the UK is finally trending down (CPI about 3.8 percent by autumn) and prior rate hikes have cooled wage growth.

The BoE noted that underlying inflation is easing amid subdued economic growth and slackening labor markets. Having already begun a gentle cutting cycle (the BoE has reduced rates five times since mid-2024), officials indicated that further cuts will depend on continued disinflation progress. In short, the BoE’s stance has shifted toward cautiously easing, provided inflation stays on track to hit 2 percent in the medium term.

In Asia, policymakers faced a somewhat different backdrop. The Bank of Japan (BOJ) which had finally exited its ultra-loose stance earlier in 2025 moved closer to raising rates again. Japan’s core CPI in Tokyo rose 2.8 percent YoY in November, holding well above the BOJ’s 2 percent goal. Price pressures in Japan have proven more durable than expected, driven by surging food costs and a tight labor market, and inflation excluding food and energy is running around 3 percent.

BOJ officials, including Governor Ueda, signaled that if these trends persist, a rate hike could come as soon as December. The benchmark policy rate has been at 0.50 percent since January (when the BOJ hiked for the first time in 17 years), and many on the Board believe conditions now merit another increase.

A major concern is the yen’s weakness – the yen slid to around 155 per USD, a 9 to 10 month low, during November. This yen slump, partly a result of U.S.–Japan rate differentials, is pushing up import costs and stoking inflation further. Japanese authorities ramped up verbal warnings about possible FX intervention if yen declines continue.

The government in Tokyo is also grappling with softer economic momentum; Japan’s economy shrank in Q3 2025, and consumer spending remains lukewarm. This puts the BOJ in a bind: raise rates to support the yen and rein in prices, or hold to support growth. As of late November, the consensus is that a near-term BOJ rate hike is likely – if only to reinforce the message that the era of zero rates and yield-curve control is truly over.

In China, by contrast, the central bank (PBoC) maintained an accommodative bias. China’s one-year Loan Prime Rate stayed at 3.45 percent for the fifth consecutive month in November, and policymakers hinted at potential RRR or rate cuts in early 2026 if needed. China’s economy is sending mixed signals: manufacturing PMIs remain under 50 (contractionary), and services growth slipped to a 5-month low in November, pointing to an uneven post-pandemic recovery.

With inflation near zero and credit growth sluggish, Chinese authorities have rolled out targeted support measures (such as modest fiscal stimulus and property market easing) rather than broad rate cuts. Still, markets anticipate the PBoC could resume easing in coming months to spur demand, especially if global conditions worsen.

Crucially, global bond yields retreated in November on the evolving monetary policy outlook. The U.S. 10-year Treasury yield fell under 4.1 percent, down from around 5 percent just a month prior, as investors priced in the Fed’s impending rate cuts. German 10-year Bund yields similarly declined (to around 2.2 percent) as euro-area inflation waned and the ECB struck a neutral tone. In the UK, gilt yields oscillated around 4.3 percent, off their highs, amid the BoE’s divided decision.

Notably, yield curves began steepening in several markets: the U.S. 2 to 10 year spread became less inverted as short rates dropped on Fed pivot bets. Lower yields and the prospect of cheaper credit ahead provided a tailwind to equities and other risk assets (particularly benefiting rate-sensitive sectors like housing and utilities). Even corporate credit spreads tightened to historically low levels, reflecting investors’ comfort with the economic outlook and search for yield.

In currency markets, the U.S. dollar index drifted weaker, falling below 100 for the first time in over a year. The dollar lost ground against the euro (EUR/USD up to about 1.16) as the Fed pivot narrative gained traction. However, the dollar strengthened versus the yen given expectations of only a minor BOJ hike (USD/JPY hit 154 to 155 before month-end). Overall, November saw a macro regime shift: investors began looking past the most aggressive tightening cycle in decades and embracing the dawn of rate cuts, underpinning a broad improvement in financial conditions.

Major Political and Geopolitical Developments

U.S. Fiscal Policy and Government: The month began under the cloud of a U.S. government shutdown, which had started in early October and dragged on for 43 days, the longest federal shutdown on record. This funding lapse furloughed hundreds of thousands of workers and halted key economic reports, injecting uncertainty into markets. By mid-November, however, Congress passed legislation to reopen the government, bringing a sigh of relief to investors and businesses. The resolution (a stopgap spending bill brokered in the House and Senate) ended the standoff and restored normal federal operations.

One quirk of the prolonged shutdown was that several data releases (including the October employment report and CPI) were omitted entirely, which was confirmed by the White House – those data might never be released officially. The shutdown’s end meant delayed figures (like retail sales and producer prices) were finally published, and agencies like the BLS and BEA resumed work. The market impact of the shutdown proved limited in the end; while it did shave some GDP growth due to lost government output, the primary effect was to muddle the economic picture for a time. Once resolved, attention turned back to fundamentals, and the removal of this political overhang provided a modest boost to market sentiment.

In Washington, monetary politics also made headlines. With Fed Chair Jerome Powell’s term ending in early 2026, President Donald Trump began vetting candidates to lead the central bank. Treasury Secretary Scott Bessent indicated an announcement of the next Fed Chair is likely before Christmas 2025. Markets widely expect Trump to not reappoint Powell, but instead choose a more dovish figure aligned with his growth-friendly, low-rate preferences. This comes amid Trump’s ongoing public pressure on the Fed – he has repeatedly urged deeper rate cuts and even mused about restarting quantitative easing.

One Fed official already in focus is Atlanta Fed President Raphael Bostic, who announced he will retire in February 2026. Bostic has been a relatively hawkish voice concerned about inflation, so his departure and eventual replacement by a Trump nominee is seen as potentially tilting the Fed more dovish. These political developments – an incumbent president actively trying to reshape the Fed – are unusual and added a layer of uncertainty. However, for now investors reacted positively, assuming a Trump-picked Fed leadership in 2026 would likely mean earlier rate cuts or easier policy than otherwise, reinforcing the Fed pivot narrative.

Trade and International Relations: On the global stage, November actually brought some easing of tensions in critical areas. Notably, the U.S. and China made incremental progress on trade issues. In late October, President Trump and President Xi Jinping reached an agreement to trim tariffs on each other’s goods. This marked a significant de-escalation in the trade war that has simmered since 2018. Details of the deal suggested that both sides would roll back certain tariffs implemented in recent years, a move which Lagarde cited as having mitigated downside risks to growth in Europe and globally. Indeed, the prospect of lower U.S.–China tariffs improved business confidence, especially in export-focused economies like Germany and South Korea.

Furthermore, the U.S. and EU finalized the outlines of a trade deal of their own, heading off a threatened new round of U.S. auto tariffs on European cars (which had loomed for late 2025). The Trump administration postponed those tariffs indefinitely as talks yielded a framework on other trade issues. Combined, these developments suggest a pivot from protectionism to negotiation, reassuring markets that trade frictions were easing at the margin.

That said, some sticking points remain – for example, the U.S. continued enforcing high-tech export controls on China (especially around semiconductors and AI technology), and China’s economy is still contending with weak external demand partly due to prior tariff regimes. But on balance, November’s news on trade was the most encouraging in years, and stocks in sectors like industrials and materials (sensitive to trade) got a boost from this détente.

Geopolitical events saw mixed turns, with one major conflict entering a quieter phase. In the Middle East, the war between Israel and Hamas (which had erupted in Gaza in late 2024) saw a ceasefire agreement take hold in November. This ceasefire – brokered by international mediators – paused hostilities long enough for humanitarian aid to flow and hostage negotiations to progress. The respite calmed fears of a broader regional escalation that might disrupt oil supplies. In fact, the de-escalation in Gaza, alongside diplomatic efforts with other regional players, contributed to a sharp drop in oil prices.

Another positive note was struck in Eastern Europe: rumors swirled of potential peace talks in the Ukraine war, as both Russia and Ukraine faced war fatigue by late 2025. While no formal peace had been achieved, even the hint of a roadmap (such as a temporary truce or negotiations around the new year) was enough to spur peace hopes in markets. These hopes helped strengthen the euro and lift European investor sentiment, given Europe’s heavy stake in an end to the conflict. It’s worth noting that gold prices – often a geopolitical risk barometer – initially surged to record highs in early November, but then pulled back slightly as some of these international risks abated.

On the other hand, political risks did not vanish entirely. In the U.S., partisan divides over government spending and debt remain unresolved – the November funding bill was a temporary measure, meaning a potential return of shutdown threats in 2026. Additionally, the approaching presidential election year is expected to bring policy uncertainty (though at this point, markets are assuming a continuation of Trump’s pro-business, tax-cutting stance).

In global politics, U.S.–China strategic rivalry persisted despite the trade truce. A notable flare-up came when President Trump signed a Taiwan relations act in early December, bolstering U.S. support for Taiwan. China’s government angrily condemned this move, and while it did not derail the trade agreement, it underscored ongoing geopolitical tension between the two superpowers. Meanwhile, Japan found itself under U.S. trade pressure earlier in the year (with tariffs on Japanese goods impacting its exports), and those issues remained only partly resolved. Japanese officials in November raised concerns about higher U.S. tariffs on certain goods and their drag on Japan’s industrial output. This indicates that while the U.S. eased up on China and Europe, it has taken a harder line on trade with some allies, an unconventional approach that could have longer-term repercussions.

Lastly, domestic unrest in China (stemming from a property sector crisis and youth unemployment) and in some emerging markets (over high food prices) remained under the radar but could resurface as flashpoints. None of these reached a boiling point in November, but investors are keeping an eye on them as latent risks.

Overall, November saw a reduction in acute political threats to markets. The U.S. government shutdown ended without major damage, trade winds turned more favorable, and even geopolitical conflicts saw tentative improvements (a Gaza ceasefire, hints at Ukraine talks). These developments, collectively, removed some of the tail-risk that had weighed on sentiment earlier in the autumn. They also complemented the macro narrative of lower inflation and easier central banks, giving investors a double dose of relief.

It is telling that the VIX volatility index fell to multi-month lows in late November, and global risk premia compressed – a sign that markets perceived the geopolitical and fiscal backdrop to be improving. Still, as noted, new challenges could emerge (from U.S. election politics to unresolved trade issues), so the landscape remains fluid. But heading into year-end 2025, the major political headwinds were significantly calmed compared to just a month or two prior.

Equity Markets Performance

U.S. equities managed to extend their gains in November, though the advance was minor and marked by significant internal rotation. The S&P 500 index finished the month essentially flat, up roughly 0.1 percent. This tepid result masked a bifurcated market: high-flying technology stocks stumbled after months of outperformance, while previously lagging sectors like financials and industrials took the lead. Indeed, the tech-heavy Nasdaq Composite posted a small loss in November (around minus 0.5 to 1 percent), its first down month since early 2025, as the AI-driven rally in mega-cap tech stocks paused.

In contrast, the Dow Jones Industrial Average, which is weighted more toward cyclical and value stocks, climbed about 1 percent and notched new record highs during the month. On November 12, the Dow closed above 48,250 (a record) even as the Nasdaq slipped, highlighting this divergence. Investors essentially rotated out of richly valued tech and into other areas of the market that stood to benefit from lower interest rates and economic reopening. The S&P 500 Value Index gained 0.4 percent in November, outperforming the Growth Index, which fell 0.2 percent.

Sector-wise, Information Technology was the clear laggard, dropping roughly 4 percent for the month, its worst monthly showing since March 2025. After an extraordinary year-to-date run, tech stocks were hit by a wave of profit-taking and a few stock-specific disappointments. For instance, some of the high momentum AI trade names saw sharp pullbacks: Nvidia shares, despite stellar earnings, seesawed and ended November below their peak; Palantir (an AI software favorite) tumbled more than 15 percent from its highs; and the broader Philadelphia Semiconductor Index fell about 5 percent in November.

This AI wobble in early November was a stark reminder of the market’s heavy reliance on tech. At one point, the S&P 500 and Nasdaq suffered their largest one-day drops in months due to a sharp tech sell-off. As Reuters noted, technology’s weight in the S&P 500 had swelled to approximately 36 percent – higher than even during the dot-com bubble – leaving the index vulnerable to negative developments in that sector. Thus, when tech faltered in November, it restrained the entire market’s advance.

On the flip side, more cyclical sectors rallied. Financials were strong, with bank stocks surging as Treasury yields fell, improving the outlook for interest margins. The S&P 500 Banks index jumped about 6 percent for the month, and heavyweight bank JPMorgan Chase hit a 52-week high. Industrials and transportation stocks also outperformed: the Dow Jones Transportation Average rose 0.8 percent in one mid-month session to its best level in over a year, boosted by airline and railroad shares. Companies like Delta Air Lines and Union Pacific benefited from hopes that, with the government shutdown resolved, operations such as air traffic control staffing would normalize and travel demand would remain robust. Energy stocks were mixed – oil prices plunged, which hurt oil producers’ stocks but helped industries for whom oil is an input, like airlines and chemicals. Utilities and Real Estate sectors got a belated lift from the decline in long-term interest rates, as investors sought high dividend payers once yields on bonds fell.

Market leadership broadened in November: instead of just a handful of tech giants driving index gains (as was the case much of 2025), other groups like small-caps and international stocks saw renewed investor interest. The Russell 2000 (small cap) index, for example, rose about 3 percent for the month, outpacing the S&P, as easier financial conditions tend to aid smaller companies. This rotation is a healthy sign, indicating improving breadth in the equity rally even as the marquee tech names take a breather.

European equity markets had an upbeat November, with many indices climbing to all-time highs. The overall MSCI Europe index (which covers developed European markets) was up 1.49 percent in November and an impressive 31 percent year-to-date through November, outperforming the U.S. market’s YTD gains. Investor sentiment in Europe benefited from the same themes as in the U.S.: declining inflation and the prospect of stable or lower interest rates. Additionally, the reduction in transatlantic trade tensions (with the U.S. delaying auto tariffs and an improving U.S.–China trade climate) buoyed Europe’s export-heavy industries.

Germany’s DAX index and France’s CAC 40 both reached record territory during the month, reflecting optimism that the euro-zone might avoid a severe downturn. In the UK, the FTSE 100 index lagged somewhat (UK stocks were flat to slightly down in November), hampered by a strong pound and weakness in commodity-linked shares. But even there, domestically focused mid-cap stocks rose on hopes that BoE rate cuts in 2026 would revive the British economy.

Asian markets were a tale of two regions. Japan’s Nikkei 225 index continued to climb and at one point breached the 50,000 level, nearing its highest values since the early 1990s. In fact, the Nikkei touched an intra-month peak above 52,000 – marking a new multi-decade record. Japanese equities have been buoyed by robust corporate profits, ongoing share buybacks, and the yen’s weakness, which boosts exporters’ earnings. Automakers like Toyota and tech firms like Sony saw stock gains on anticipation that a modest BOJ rate hike (if it happens) would not derail growth. However, toward the very end of November, the Nikkei did pull back slightly as yen strengthened off its lows on those BOJ hike rumors.

Elsewhere in Asia, emerging market stocks faced headwinds. The MSCI Emerging Markets Asia index fell about 3.2 percent in November, underperforming global markets. A big drag was South Korea, where the KOSPI index dropped 7.9 percent in the month. Korean markets are heavily weighted to semiconductor and electronics names (for example Samsung, SK Hynix), which slumped in tandem with U.S. tech and on concerns of peaking chip demand. Taiwan’s market was similarly down (5.0 percent in November), as its dominant semiconductor firms saw profit-taking after strong runs.

In China, equity performance was mixed. Mainland Chinese indexes (Shanghai and Shenzhen) were roughly flat amid ongoing worries about the property sector and mediocre economic data. However, Hong Kong’s Hang Seng Index managed to rise about 2.5 percent in November, aided by a late-month rally. Hong Kong and China-exposed stocks got a lift from some better news on China’s economy – for example, Chinese GDP growth for Q3 came in a bit above forecasts thanks to government stimulus, and November saw rumors of further policy support for real estate developers. Additionally, the U.S.–China tariff rollback news in late October helped sentiment for Chinese export-oriented companies.

Volatility stayed low; the VIX averaged in the low teens. One notable milestone: the Dow Jones Industrial Average entered December having gained for eight consecutive weeks, its longest weekly winning streak in over four years. This underscores how steadily bullish the late-2025 environment became after the autumn pullback. Still, some caution signs flashed: market breadth, while better than early 2025, was not extremely strong – a handful of megacaps still accounted for an outsized share of YTD gains. And valuations remained elevated, with the S&P 500 forward P/E around 22 to 23x, well above its 10-year average of about 18.8x. Even after the November dip, the tech sector’s forward P/E, approximately 32x, was lofty, prompting some analysts to warn of potential correction if earnings growth doesn’t materialize.

Indeed, strategists from major banks cautioned during the month that U.S. equities might be due for a drawdown, citing those stretched valuations and the market’s heavy reliance on one sector. Thus, while November ended on a broadly positive note for stocks, investors remained mindful of risks from AI bubble concerns to uncertain 2026 economic growth that could introduce volatility down the line.

Notable Corporate Earnings and Stock Moves

U.S. Mega-Cap Tech Earnings: November saw the tail end of the Q3 earnings season, with several mega-cap tech companies reporting results that significantly moved their stocks. Apple, the world’s largest company, announced its fiscal Q4 (September quarter) earnings on October 30. Apple delivered record revenue of 102.5 billion dollars, up 8 percent year-over-year, driven by strong iPhone 17 sales, and quarterly EPS of 1.85 dollars, up 13 percent year-over-year.

These better-than-expected results (especially the iPhone revenue record) propelled Apple’s stock to new all-time highs in early November. Apple briefly traded above 250 dollars, reflecting investors’ enthusiasm for the company’s resilient demand and expanding services business. Apple’s report showed that consumer spending on premium smartphones and wearables remained robust despite a soft macro environment. The company did issue cautious guidance, noting some impact from foreign exchange and the late launch of certain new products, but the market largely looked through it.

In a rare corporate move, Apple also announced layoffs of a few hundred sales staff in November to streamline operations. While any layoffs at Apple are notable (given it had avoided job cuts earlier when peers were downsizing), the affected roles were limited and related to government and enterprise sales teams, some of whom were constrained during the shutdown. This minor cost-cutting was taken as a positive sign of discipline. Overall, Apple’s earnings underscored the strength of its ecosystem, and its stock finished November with roughly a 5 percent gain for the month, adding to its impressive year-to-date rise.

Perhaps the most anticipated report was from Nvidia, the poster child of the 2023 to 2025 AI boom. Nvidia announced blowout Q3 FY2026 earnings on November 19, smashing expectations yet again. Revenue came in at 57.0 billion dollars for the quarter, up 62 percent year-over-year, a new record, with data center sales (AI chips) surging to 51.2 billion dollars. Both revenue and EPS handily beat analyst estimates, and the company raised guidance for the next quarter, projecting an unheard-of 65 billion dollars in Q4 revenue. These numbers illustrated extraordinary demand for Nvidia’s AI accelerators (Blackwell GPU chips), which CEO Jensen Huang said are sold out as compute needs keep accelerating and compounding in the AI era.

Upon the earnings release, Nvidia’s stock initially spiked around 5 percent in after-hours and the following morning, briefly pushing Nvidia’s market cap near 1.7 trillion dollars. This upbeat reaction buoyed the tech sector broadly for a short time. However, in the days after the report, Nvidia’s stock surrendered those gains and turned negative, as some traders took profits and worried that even fantastic results might not propel the stock much higher given its rich valuation. Furthermore, a separate development weighed on Nvidia and its peers: reports emerged that Meta (Facebook) was considering sourcing some AI chips from Alphabet’s Google, which has started designing its own AI semiconductors. This news on November 25 sent Nvidia’s shares down about 2.6 percent and hit other chipmakers like AMD, which dropped 4.1 percent that day, as investors mulled rising competition in the AI hardware space.

In any case, Nvidia’s year-to-date stock gain remained enormous (well over 200 percent), and it continued to be the top-performing S&P 500 component of 2025. But November showed that even Nvidia is not immune to profit-taking and that expectations have risen incredibly high – any hint of a plateau in its AI dominance could jolt its stock and the market.

Alphabet (Google’s parent company) had an eventful month as well. While Google’s Q3 earnings (released in late October) were solid – driven by a rebound in advertising and steady cloud growth – the bigger buzz came from its advancements in Artificial Intelligence. On November 18, Google launched Gemini 3, its latest AI model, and notably integrated it directly into Google Search from day one. CEO Sundar Pichai touted Gemini 3 as Google’s most intelligent model yet, capable of handling text, images, and complex reasoning tasks. The immediate embedding of this AI into core products like Search and Gmail signaled Google’s aggressive push to compete with OpenAI’s ChatGPT and Microsoft’s AI offerings.

Alphabet’s stock jumped over 6 percent in the two days around the Gemini 3 announcement. In fact, on November 24, Google shares rose 6.3 percent – their biggest one-day gain in years – after the company demoed Gemini’s capabilities and some Wall Street analysts upgraded the stock. Google’s rally made it one of November’s best-performing megacaps and briefly lifted its market cap above 2 trillion dollars again. The AI war is clearly heating up: Google’s moves put pressure on OpenAI and Microsoft, and as noted, Meta and others are seeking alternate AI chip suppliers to reduce reliance on Nvidia. This dynamic introduced new competitive threads in the tech industry that investors are now parsing. For example, could Google’s Tensor Processing Units challenge Nvidia’s GPUs in the long run? Will Amazon or others follow suit in chip design? So far, it’s early stages, but Google’s strong execution in AI in November reassured investors that it remains a formidable player in the space.

Other U.S. tech giants mostly reported in late October, but their stock moves carried into November. Microsoft delivered better-than-expected earnings, with Azure cloud growth re-accelerating to around 29 percent, and issued optimistic guidance on AI services demand. Its stock hovered near record highs around 400 dollars through most of November, though it dipped slightly when the tech sector sold off mid-month. Meta Platforms had surged in October after an earnings beat (driven by a rebound in ad spending and promising VR and AI developments), but Meta shares gave back some gains in November, down approximately 4 percent, amid the broader tech pullback and the aforementioned news that its data center strategy might involve third-party AI chips, potentially favoring Google over Nvidia.

Amazon surprised the street with a big revenue beat and margin improvement in Q3, announced in late October, propelling its stock up around 10 percent. In November, Amazon largely held those gains, trading strong on the back of record-setting holiday shopping forecasts. Early reports suggested Black Friday and Cyber Monday sales were robust, and AWS cloud continued to grow. Toward month-end, Amazon did face an EU antitrust complaint related to marketplace practices, but this had limited stock impact.

Tesla was relatively quiet news-wise in November, but its stock rebounded about 5 percent during the month after a steep drop earlier in the fall. Investors weighed Tesla’s challenges – declining profit margins due to price cuts and rising EV competition globally – against upcoming catalysts. The long-awaited Cybertruck delivery event took place in late November, with Elon Musk handing over the first few Cybertrucks to customers. Reception of the Cybertruck was mixed, but it kept Tesla in headlines. Additionally, speculation grew that Tesla might announce a share buyback or other shareholder-friendly moves as its cash pile grows – another factor that lent support to the stock. Still, Tesla remained roughly 25 percent below its 2025 highs, showing that not all big-cap stocks have been market darlings equally.

Stepping outside the mega-cap universe, corporate earnings in other sectors produced some eye-popping stock moves in November, reflecting a very selective environment for winners versus losers.

Consumer and Retail: Several mid-sized retail companies delivered huge surprises that sent their stocks soaring. Department store chain Kohl’s reported Q3 earnings on November 21 that smashed expectations – notably, Kohl’s showed growth in sales and improved its profitability outlook as new marketing initiatives paid off. The result: Kohl’s stock exploded 42 percent in one day after earnings, one of its largest single-day gains ever. Similarly, apparel retailer Abercrombie and Fitch astonished the market with a massive earnings beat and raised guidance, fueled by a successful brand turnaround and inventory management. ANF shares surged 37 percent on November 21, reaching their highest level in over a decade. These dramatic jumps underscore that pockets of consumer spending (especially among younger shoppers, in ANF’s case) are strong, and that some retailers have navigated the post-pandemic shifts adeptly.

On the other hand, not all was well in retail. Discount chain Burlington Stores issued a weak report and cautious holiday outlook, causing its stock to plunge 12 percent. Burlington struggled with tightening consumer budgets at the low end and inventory snafus, reminding investors that the retail landscape is bifurcated. Macy’s and Foot Locker also fell on lackluster results. Meanwhile, big-box leaders Walmart and Target (which reported earlier) showed diverging trends – Walmart had strong grocery sales and lifted forecasts, whereas Target cited soft discretionary spending. These outcomes collectively hint at a U.S. consumer that is becoming more value-conscious, with strength in essentials and selective splurges but weakness in more discretionary or lower-end segments.

Transportation and Travel: The easing of the shutdown and generally solid travel demand aided names like Delta, American Airlines, and Southwest, which all saw their stocks up high-single-digit percentages in November. There was some turbulence mid-month when a few airlines guided that Q4 revenue might be at the lower end of estimates, citing higher fuel costs earlier and Middle East conflict impacting certain routes. But by end-month, with oil prices collapsing, airline stocks were rallying on the improved profit margin outlook. The Dow Transports index reaching new highs was largely thanks to airlines bouncing off their autumn lows and FedEx continuing to execute cost cuts.

In autos, aside from Tesla, the traditional Big Three automakers (GM, Ford, Stellantis) finally resolved the UAW labor strikes by early November, resulting in new contracts with significant wage increases. Initially, those higher labor costs sparked concern, but auto stocks actually rose in November as investors were relieved that production could normalize and because sales remained healthy. Ford stock gained approximately 10 percent in November, helped also by reports it’s reaccelerating EV development with Chinese partnerships.

Financials: Big banks (JPMorgan, Bank of America, Citi) generally drifted higher as mentioned, benefiting from the yield curve steepening. On the investment banking side, Goldman Sachs and Morgan Stanley got a lift late in the month when deal activity showed signs of life. November saw a few large IPO filings and M&A deals. Additionally, there was speculation that with the Fed cutting soon, capital markets and trading revenues would pick up. One noteworthy development: Berkshire Hathaway disclosed significant stock buybacks and new investments in its Q3 report, which investors read as a bullish signal on value stocks. Berkshire’s stock hit all-time highs, contributing to the financial sector’s strength.

Energy and Industrials: The energy sector was a mixed bag. Despite the plunge in oil prices, many refiners and petrochemical firms saw margin improvement due to cheaper crude feedstock, so names like Valero and Dow Inc. rose. However, pure E and P (exploration and production) companies fell with oil. In industrials, defense contractors like Lockheed and Northrop had been rallying due to global tensions, but the Gaza ceasefire and talk of Ukraine peace led to some cooling off in defense stocks in late November. Instead, infrastructure and construction plays like Caterpillar, which gained around 8 percent, took the baton, as investors bet on U.S. fiscal spending on infrastructure and the housing sector stabilizing with lower rates.

Healthcare: Pharma giants Merck and Pfizer underperformed as they grapple with patent cliffs and, in Pfizer’s case, declining COVID vaccine sales. But biotech staged a small comeback in November after a brutal year, aided by a couple of positive drug trial results at the American Heart Association conference. One example was a new cholesterol-lowering drug. CVS Health jumped after announcing a CEO change and cost cuts. Healthcare was overall not a focus in November’s market narrative, as its defensive nature was less in demand during a risk-on, rate-cut-anticipation phase.

Notable Tech and Media Moves: One standout gainer was Zoom Video. The pandemic-era videoconferencing star reported earnings that beat estimates, with stable user trends and improved profitability as it upsells enterprise products. Its stock popped nearly 10 percent post-earnings, a welcome rebound for a stock that had been heavily sold off earlier in the year. This suggests some of the stay-at-home tech names have found a bottom and can grow again from a smaller base.

In media, Netflix traded volatilely. Early in the month it surged on speculation of strong viewership for new content and rumors of an acquisition (later debunked) of a legacy studio. But by month-end Netflix gave back gains as some hit shows were delayed by the Hollywood actors’ strike, which finally ended around Thanksgiving.

One common theme in Q3 earnings was better-than-feared results. According to FactSet, S&P 500 aggregate earnings grew modestly in Q3, ending the earnings recession of the past year. Profit margins showed resilience even as revenue growth was meager. Many companies cited cost efficiencies and still-solid demand. As a result, about 80 percent of S&P companies beat EPS expectations, a higher share than usual. However, guidance for Q4 was often cautious – firms mentioned macro uncertainties, the delayed impact of high rates, and in some cases, higher labor costs (post union deals) as reasons to be conservative.

Still, the market’s reaction function in November was clear: reward the positive surprises generously, as seen with Kohl’s and Abercrombie, and punish any disappointments swiftly, such as Burlington. This led to outsized single-day moves, reflecting the currently liquid and momentum-driven trading environment.

Overall, the corporate earnings picture in November added fuel to the market by confirming that many companies are navigating the high-rate environment well. Top-line growth has slowed in many industries, but margins are not cratering – indicating resilience. Moreover, sectors that were under pressure like retail and industrials showed that with the right strategy, strong results are achievable. With the Fed expected to ease, many companies also struck a more optimistic tone about 2026.

That said, the stark contrast between winners and losers grew more pronounced: investors have little patience for underperformance when ample alternatives exist, so dispersion in stock returns is high. The months ahead will test whether the market’s lofty valuations for the winners (especially in tech) are justified by continued growth, or whether a broader re-rating might occur if the economy slows.

For now, November’s takeaway was that earnings are good enough to keep the bull case intact, especially if interest rates indeed head lower soon.

Bitcoin and Ethereum

The cryptocurrency market extended its remarkable resurgence in November, led by record-shattering moves in the two largest digital assets, Bitcoin and Ethereum. Bitcoin in particular had a milestone month: prices exploded to new all-time highs, driven by a potent mix of favorable market momentum and growing institutional acceptance. After consolidating around 70,000 dollars in October, Bitcoin surged rapidly in early November.

It blew past its previous peak (around 69,000 dollars from late 2021) and kept climbing, reaching approximately 89,000 dollars at one point. Around Thanksgiving, BTC was trading in the high 80,000s, representing about a 30 percent gain in November alone. By month-end it settled near 87,000 dollars, still up significantly from the start of the month. This rally solidified Bitcoin’s status as one of 2025’s top-performing assets, up over 130 percent year-to-date.

Several factors fueled the run. First, the anticipation and subsequent arrival of spot Bitcoin ETFs unleashed a wave of institutional demand. U.S. regulators had approved the first spot BTC ETFs earlier in 2025, and by November, those funds were accumulating coins. The very existence of easily accessible Bitcoin ETFs increased mainstream legitimacy for crypto. Second, the macro backdrop of falling real interest rates and a peaking U.S. dollar provided a favorable environment for alternative assets like gold and Bitcoin. Indeed, Bitcoin’s rally coincided with gold’s surge, both seen as hedges in a world of abundant liquidity and geopolitical uncertainty.

Third, crypto-specific dynamics, such as the upcoming Bitcoin halving (expected in spring 2026, which will halve BTC’s mining issuance rate), historically tend to boost prices in anticipation. And finally, a general risk-on mood in markets and FOMO likely played a part – as BTC broke to new highs, more buyers piled in, including retail investors, leading to a parabolic move.

That said, November wasn’t entirely one-way traffic: toward month-end, volatility spiked, with Bitcoin briefly dipping from about 89,000 dollars to 80,000 dollars before rebounding, demonstrating its continued price swings. News of regulatory actions or large whale sales occasionally caused sharp intraday moves. For example, when some early Bitcoin ETF filings showed smaller-than-expected initial inflows, BTC had a quick pullback. Nonetheless, the overarching trend remained bullish.

Ethereum, the second-largest crypto, also rallied in November, though it lagged Bitcoin in magnitude. Ether began the month around the mid 2,000s and climbed steadily, crossing the 3,000 dollar threshold by late November. It touched highs around 3,100 dollars during the month, which is the highest level Ether had seen since early 2024. By November 30, ETH was hovering near 3,000 to 3,050 dollars, up roughly 20 percent for November.

Unlike Bitcoin, Ethereum did not break its all-time high (which was around 4,950 dollars in November 2021), but the trajectory was positive and investors are optimistic about upcoming catalysts. A major one is the Ethereum Fusaka network upgrade scheduled for December 2025, which is expected to improve the network’s throughput and efficiency. Anticipation of this upgrade has coincided with increased accumulation by large Ether holders (whales), signaling confidence in Ethereum’s technical roadmap.

Additionally, speculation grew that the SEC could approve a spot Ethereum ETF in 2026, following on the heels of the Bitcoin ETF approvals. Such an ETF would open ETH to a wave of institutional capital. For now, institutional participation in Ethereum is seen via futures ETFs and trusts, but a spot product would be a game-changer.

Like Bitcoin, Ethereum benefited from the macro tailwind of potential Fed easing – lower yields make non-yielding assets like crypto relatively more attractive. Ethereum’s fundamentals also showed strength: network activity in terms of fees generated and transactions picked up in November, partly thanks to a boom in tokenized real-world assets and continued interest in DeFi protocols.

The broader crypto ecosystem reflected these gains. The total cryptocurrency market cap surpassed 3.2 trillion dollars in November, nearing its all-time high. Other altcoins rallied, though with significant variance. Bitcoin’s market dominance rose above 55 percent, as BTC drew disproportionate interest, a typical pattern during the early stages of a crypto bull market. Some popular altcoins like Solana and Ripple saw double-digit percentage gains in November, buoyed by positive project developments and, in Solana’s case, a resurgence of developer activity.

Regulatory news was mixed but did not derail the rally. In the U.S., the SEC delayed some decisions on smaller crypto ETFs, but a U.S. judge also dismissed a high-profile lawsuit against a crypto exchange, which the market took as a legal victory. In Europe, new MiCA regulations (Markets in Crypto-Assets) were being finalized, which actually created more clarity for crypto firms operating in the EU. These regulatory steps, while increasing compliance costs, ultimately legitimize the crypto industry and were thus welcomed by many investors.

One cannot mention crypto in late 2025 without noting gold’s performance in parallel. Gold prices hit fresh records above 4,100 dollars per ounce in November, which is striking as gold and Bitcoin often draw comparisons as alternative stores of value. In November they both rose strongly – a sign that investors were hedging fiat currency debasement and geopolitical risks through multiple avenues. However, gold’s climb was more about real-world uncertainties and perhaps central banks buying gold at record pace, whereas Bitcoin’s surge had a heavier speculative fervor element.

There were moments when Bitcoin’s rapid ascent showed signs of excess – for example, funding rates in crypto futures turned highly positive, meaning many traders were leveraged long, and anecdotal reports of retail frenzy emerged. Yet, unlike the 2017 or 2021 episodes, this time there is a belief that institutional support via ETFs and major asset managers endorsing crypto could make the cycle more durable.

By the end of November, some analysts warned of a potential short-term pullback or consolidation in crypto, given such a rapid run-up. Indeed, early December saw Bitcoin dipping slightly as some profit-taking occurred. But the overall sentiment in the crypto market was bullish entering the final month of 2025. The successful resolution of key uncertainties such as regulatory approvals and macro turning point has re-energized the space. If Ethereum’s Fusaka upgrade goes smoothly and if the Fed indeed cuts rates, crypto proponents argue there could be further upside as liquidity conditions improve. Skeptics, on the other hand, caution that crypto remains highly volatile and macro-sensitive. For instance, if the Fed were to delay cuts or if the economy fell into recession, crypto could retrace.

For now, November will be remembered as a breakout month that cemented crypto’s resurgence, with Bitcoin making history by reaching new heights and reclaiming the mantle of digital gold in spectacular fashion.

Commodities and Other Assets

Oil markets experienced a dramatic downturn in November, flipping from a concern of scarcity to an outlook of oversupply. The price of crude oil plunged to its lowest levels in over two years. U.S. benchmark WTI crude fell roughly 17 percent in November, sliding from the mid 70s per barrel at the start of the month to around 58 dollars by month-end. International Brent crude likewise dropped from approximately 80 dollars to about 62 dollars.

Multiple factors drove this steep decline. On the supply side, there were growing signs of ample supply and even glut potential heading into 2026. The U.S. Energy Information Administration raised its domestic output forecasts, projecting U.S. oil production will hit record highs thanks to shale drilling efficiencies. Similarly, non OPEC producers like Brazil and Guyana have been ramping up output. OPEC Plus itself maintained production cuts during November, but rumors swirled that some members were cheating on quotas given the high prices earlier – leading traders to suspect actual supply was higher than official figures.

Additionally, concerns about Iranian oil returning to markets grew as diplomatic negotiations over Iran’s nuclear program made headway including a U.S.–Iran prisoner deal in October that some saw as a thaw. If sanctions on Iran were eased, that could unleash hundreds of thousands of barrels per day, further boosting supply.

On the demand side, a few developments pointed to softness. Global economic growth forecasts were revised down slightly, with Europe barely skirting recession and China’s recovery weaker than hoped, meaning lower oil demand growth. U.S. demand showed mixed signals. Gasoline consumption was decent, but distillate demand – a proxy for industrial activity – was lackluster. Moreover, November is a seasonally weaker period for crude demand as refinery maintenance season in the U.S. curtails crude buying.

Together, these supply demand shifts created a sentiment that the 2024 oil market might be oversupplied. Once oil prices broke key technical levels (WTI breaking below 65 dollars in mid-month), momentum selling kicked in. By late November, traders were focused on the possibility of peace deals in conflict areas reducing geopolitical risk premiums. The Israel–Hamas ceasefire eased fears of Middle East supply disruptions, and tentative Ukraine peace chatter suggested Russian oil flows – which had been ongoing but under sanctions – would remain stable or even increase. In fact, Russian Urals crude has been trading well below the G7 price cap, indicating plentiful Russian exports despite the war. JP Morgan even published a forecast citing Brent at 57 dollars in 2027 due to structural forces, underscoring the bearish long-term sentiment that took hold.

By end of month, oil analysts’ narrative shifted from 100 dollar oil back to lower for longer. OPEC Plus was set to meet in late November or early December, and many expected the cartel to announce new production cuts to try to floor prices. The swift collapse in oil prices was a boon for global inflation, aiding central banks’ fight, but it raised concerns for oil-exporting nations and the energy industry’s capital expenditure plans.

Natural gas markets diverged regionally. U.S. Henry Hub gas prices actually rose modestly in November (from around 3 to 3.25 dollars per MMBtu) as early winter cold spells in parts of the U.S. boosted heating demand. European natural gas, in contrast, fell amid unusually warm late-fall weather and high storage levels. Dutch TTF gas futures dropped approximately 10 percent to around 30 euros per MWh, far below crisis levels of 2022. The ample European gas storage near 95 percent full entering winter and steady LNG inflows have calmed fears of a winter crunch, even with the Israel–Hamas conflict initially raising concerns about Middle East LNG supply.

The metals sector saw some striking moves, particularly in precious metals. Gold prices soared to all-time highs during November, hitting 4,135 dollars per ounce at one point. This is more than double gold’s price just 3 to 4 years ago, and reflects a confluence of bullish drivers: falling real interest rates as nominal yields drop and inflation, while lower, remains above 2 percent in many places, a weaker dollar which makes gold cheaper in other currencies, and robust safe-haven demand. Geopolitical uncertainties – from wars to trade tensions – and central banks’ voracious gold buying, particularly by China, Russia, and Middle East countries diversifying reserves, have provided strong support for gold.

In November specifically, the anticipation of Fed rate cuts was a catalyst. When weak U.S. data emerged like soft consumer confidence and signs of labor market cooling, markets assumed a December Fed cut was a done deal, which fueled gold’s rally.

Some observers also pointed to hedging against equity volatility – with stocks near highs, savvy investors increased gold allocations as a hedge. Notably, gold’s surge came even as immediate crisis fears such as a U.S. default or a broad war receded, implying structural demand beyond just panic buying. By the end of November, gold had settled slightly below the peak, around 4,050 dollars, as profit-taking set in and the dollar bounced off lows.

Silver followed gold’s lead, jumping to about 55 dollars per ounce, its highest since 2011, given silver’s dual role as precious and industrial metal – benefiting from both safe-haven flows and optimism around solar panel demand.

Industrial metals like copper and aluminum had a more muted month. Copper traded roughly flat around 4.00 dollars per pound. Economic data from China, which consumes half the world’s copper, was mixed, and while U.S. construction and EV demand are supportive, the market is fairly balanced. Some excitement came from reports of low exchange inventories and predictions that 2026 could see a copper deficit due to surging electric vehicle and grid investments – but those are longer-term factors. For now, copper seems range-bound as traders await a clearer global growth trend.

Aluminum prices eased slightly on improved supply, as China ramped up smelter output as power costs fell, and moderate demand. Lithium, the battery metal, continued its downward correction; lithium carbonate prices in China fell again in November, nearly 70 percent off their 2022 peak, as a wave of new mining supply especially from Australia and Africa alleviated the once-insatiable EV battery demand crunch. This has been a relief for EV producers like Tesla, who noted lower battery input costs, but a challenge for lithium miners whose share prices have slumped.

In currencies, aside from the dollar softening broadly (DXY near 99 to 100), some specific moves stood out. The Japanese yen hit around 155 per USD, then firmed to approximately 150 as BOJ hike expectations grew – still far weaker than 130 at the start of 2025. The British pound rose to 1.27 dollars, a multi-month high, on bets the BoE would eventually ease less aggressively than the Fed given U.K. inflation still a bit higher.

Emerging market currencies generally strengthened as global risk appetite improved – for example, the Brazilian real gained 3 percent versus USD, and the Indian rupee recovered slightly from record lows after the RBI intervened. One exception was the Turkish lira, which hit new record lows (TRY 30 per USD) as Turkey’s central bank, despite huge rate hikes this year, struggled to rein in inflation – a reminder that not all EMs are out of the woods on inflation.

Lastly, bond markets had notable moves beyond sovereign yields. Corporate bonds rallied as spreads tightened, and even some distressed debt saw buyers. The U.S. 10-year TIPS inflation-protected yield fell under 2 percent again, after nearing 2.5 percent earlier – a boon to many asset valuations. Global bonds enjoyed their best month of 2025, with major aggregate bond indices up over 2 to 3 percent in November as prices rose. One headline in fixed income: Italy’s 10-year yield dropped from 5 percent to 4.3 percent after the ECB’s no-hurry-to-cut stance reassured investors about policy stability. Italian bonds had been hit in October on deficit worries, but recovered in November.

Another was Chinese government bonds rallying when the PBoC cut banks’ reserve ratio in an attempt to stimulate growth – the 10-year Chinese yield fell to 2.5 percent, a multi-year low, highlighting China’s distinct easing cycle.

Final Summary and Key Takeaways

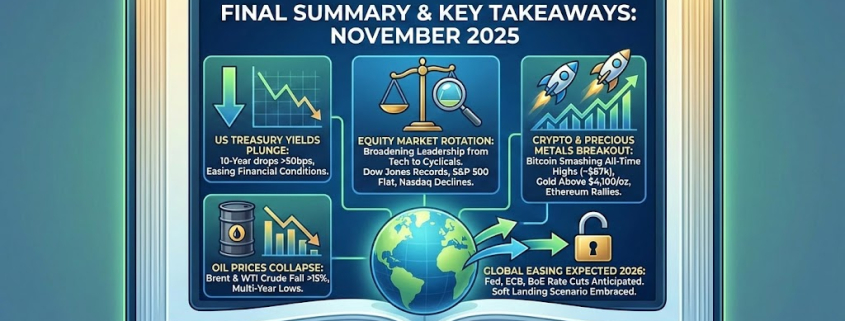
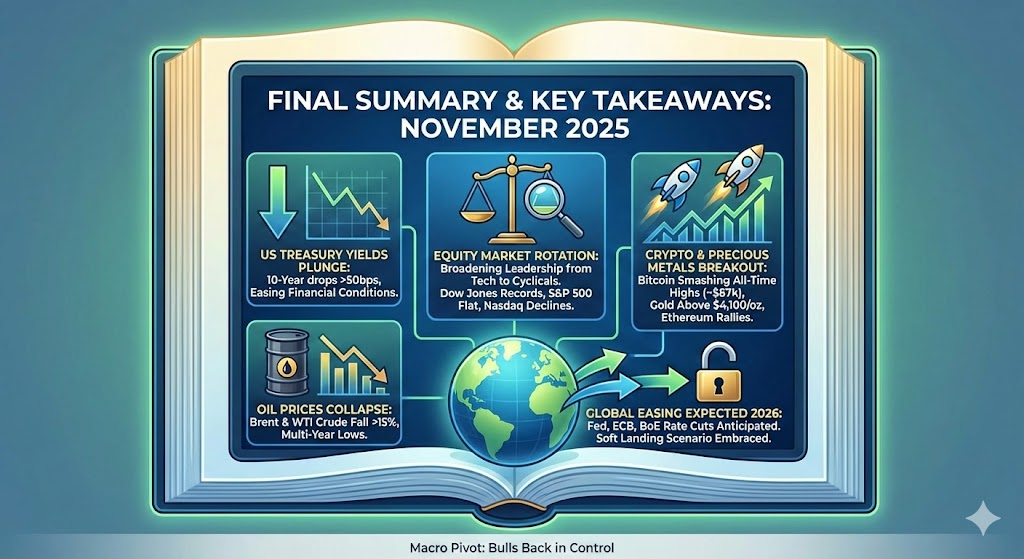
November 2025 marked a pivotal month across financial markets, characterized by a sharp pivot in macro expectations, a widening of equity market leadership, and breakout moves in crypto and precious metals. The dominant theme was the market’s conviction that the global monetary tightening cycle is effectively over.

Inflation continued to cool in the U.S. and Europe, prompting bond markets to price in multiple rate cuts starting in early 2026. U.S. Treasury yields plunged across the curve, with the 10-year yield falling over 50 basis points during the month, easing financial conditions and reigniting risk appetite.

Equity markets responded with resilience, though the path was not uniform. The S&P 500 ended November nearly flat, but under the surface there was a clear rotation out of mega-cap tech and into cyclicals like financials, industrials, and small caps. This shift suggested healthier market breadth and reflected expectations that rate relief would benefit economically sensitive stocks. Notably, the Dow Jones Industrial Average outperformed, hitting record highs, while the Nasdaq saw its first monthly decline in several months. International markets also performed well — European indices reached new all-time highs, Japan’s Nikkei tested 52,000, and Latin America rallied strongly. China remained a laggard, though Hong Kong equities rebounded slightly.

Earnings season was mostly encouraging. Major tech players like Apple, Nvidia, Google, and Microsoft posted strong results, with AI and cloud themes driving momentum. Retail and industrials produced some of the month’s biggest single-day stock gains on surprising earnings beats, showing that pockets of the real economy remain robust. However, stock market gains were not evenly distributed. Valuations for tech giants remained elevated, prompting profit-taking even on good news, while stocks that missed expectations saw steep drawdowns. Market participants rewarded execution and forward visibility, while punishing weak guidance.

Crypto markets stole the spotlight. Bitcoin smashed its previous all-time highs, rising over 30 percent in November to trade near 87,000 dollars. Ethereum followed with a 20 percent rally, breaking above 3,000 dollars. Institutional interest, spot ETF flows, the upcoming halving, and favorable macro conditions drove this surge. Crypto’s strong performance coincided with gold’s breakout to record highs above 4,100 dollars per ounce — a sign that alternative assets are in demand as investors hedge against inflation, currency debasement, and central bank policy shifts.

Oil prices, in contrast, collapsed. Brent and WTI crude both fell over 15 percent, hitting multi-year lows amid supply surpluses, soft demand, and fading geopolitical risk premiums. This decline in energy prices helped support the disinflation narrative and added fuel to the bond rally. Industrial metals were mixed, while silver tracked gold higher. Currency markets saw the dollar weaken broadly, lifting many emerging market and developed currencies.

The macro narrative now revolves around a synchronized global easing cycle in 2026. Markets are expecting the Fed, ECB, and even the BoE to begin cutting rates in Q1 or Q2. Whether this rate optimism proves premature will be the key risk heading into December and early 2026. For now, markets are embracing a soft landing scenario — one where inflation continues to recede, growth remains positive, and central banks start to ease without triggering instability.

In conclusion, November delivered a broad-based risk rally driven by falling yields, optimism on policy, and investor willingness to look beyond short-term headwinds. Stocks, crypto, gold, and bonds all rallied in concert, suggesting a macro pivot. The challenge going forward will be whether this optimism is matched by economic and earnings data in the new year. But for now, bulls are back in control.

915b3099 3551 4ab7 8dbc 92ca20d97e6d

Global Stock Market Trends

U.S. equity markets bucked the usual September weakness, posting strong gains and even notching new records. The S&P 500 surged around 3.5% for the month, the Nasdaq Composite jumped roughly 5.6%, and the small-cap Russell 2000 climbed nearly 3%, making this the best September for stocks since 2010. All three major indices set fresh all-time closing highs mid-month as investors cheered supportive policy news.

The rally, which had previously been led by mega-cap tech, broadened further. Tech and AI-focused stocks still powered higher, but other sectors and smaller caps participated, reflecting improving market breadth. Seven of the S&P’s eleven sectors rose on the month, with technology leading while energy lagged due to falling oil prices.

Overseas, global stocks followed Wall Street’s lead. Major European indices advanced and some even broke records. Notably, London’s FTSE 100 hit a new record high by the end of the month, capping a 7% quarterly gain as defensive sectors like healthcare surged. Germany’s DAX and France’s CAC 40 hovered near multi-year highs, shrugging off a French credit rating downgrade.

In Asia, Japan’s market continued its stellar run. The Nikkei 225 briefly crossed the 44,000 mark for the first time ever before some profit-taking, underscoring how Japanese equities remain at their highest levels in over three decades. On the other hand, Chinese stocks lagged the global rally. China’s economy showed signs of strain, and only cautious stimulus from Beijing left the Shanghai and Shenzhen indexes relatively flat to modestly higher, underperforming Western peers. Overall, September 2025 delivered robust equity gains worldwide, with optimism about policy easing and economic resilience outweighing persistent pockets of risk.

Macroeconomic and Central Bank Developments

In the United States, economic indicators painted a mixed picture of a cooling yet still stable economy. The labor market showed clear signs of slowdown. Private payrolls unexpectedly declined in September for the first time in over two years, with ADP reporting a 32,000 drop in jobs, versus expectations of a gain. This came on top of very anemic job growth in August (which was revised to a slight decline as well). The unemployment rate edged up toward the mid-4% range, reflecting a labor market that, while not collapsing, is losing momentum.

Meanwhile, inflation ticked slightly higher but remained near the Federal Reserve’s target. The August Consumer Price Index came in around 2.9% year-on-year, up from 2.7% in July, due largely to base effects and rising energy costs over the summer. Importantly, underlying price pressures stayed moderate. The Fed’s preferred core PCE inflation measure held around 2.9% annualized, just a touch above 2%. In short, price growth is a far cry from the peaks of recent years, even as it bears watching.

All eyes were on the Federal Reserve, which at its mid-September FOMC meeting finally delivered the widely anticipated interest rate cut. The Fed lowered its benchmark federal funds rate by 25 basis points to a target range of 4.00% to 4.25%, marking the first rate reduction of 2025. This pivot to easing came after the Fed had kept rates unchanged for over half a year. Chair Jerome Powell cited the weakening job market and accumulating evidence of slowing economic activity as justification for injecting some stimulus. Notably, the Fed also updated its forecasts (dot plot), which indicated policymakers expect further rate cuts over the coming year as long as inflation continues to trend toward 2%.

Markets overwhelmingly priced in this policy shift. Futures had assigned nearly a 100% probability of the September cut following Powell’s dovish hints at August’s Jackson Hole symposium. In the aftermath, short-term Treasury yields tumbled, reflecting expectations of additional easing, and financial conditions loosened. By late September, the 2-year Treasury yield had fallen to about 3.6% (down sharply from ~5% earlier in the year), while the 10-year yield hovered around 4.2%. This rapidly steepening yield curve, now its least inverted in over two years, signaled that bond investors see the Fed firmly in easing mode.

Other central banks were also generally tilting dovish or holding steady. The Bank of England, which had enacted a surprise cut in August, kept its policy rate at 4.0% in September as UK inflation continued to recede from double digits toward the mid-single digits. The European Central Bank similarly held rates unchanged after a year of aggressive monetary easing brought Eurozone inflation down near 2%. European policymakers adopted a wait-and-see stance, monitoring risks like energy prices and the U.S. outlook. Over the summer the ECB had signaled the end of its cutting cycle, and September’s data gave little cause to restart cuts immediately. Japan’s ultra-loose policy remained in place. The Bank of Japan did not change its negative interest rate or yield-curve control settings, although there was continued speculation about a possible tweak later in the year if Japan’s inflation (around 3% recently) stays above target.

In China, the central bank (PBOC) took a more cautious approach despite the country’s economic slowdown. Chinese authorities left key interest rates unchanged in September, opting not to follow the Fed’s cut. Officials noted that parts of China’s economy showed resilience, for instance exports had perked up, and there was concern that too much easy money could inflate asset bubbles. Instead, the PBOC used more modest tools: injecting liquidity into the banking system and indicating willingness to cut reserve requirements or trim rates later in the year if necessary.

China’s leadership appears focused on meeting the ~5% GDP growth goal without unleashing excessive stimulus. Nonetheless, economic headwinds persist in China. Consumer spending is sluggish, the property sector is still in a downturn, and even deflationary pressures have appeared (consumer prices were slightly negative year-on-year over the summer). Beijing’s restrained policy in September suggests a preference to save ammunition and deploy targeted support rather than a broad rate slash, at least until conditions worsen or markets falter.

Trade War and Political Developments

Geopolitics and domestic politics provided plenty of market-moving headlines in September. On the international front, there were tentative signs of easing trade tensions, particularly between the U.S. and China. In mid-September, U.S. President Donald Trump and China’s President Xi Jinping held their first direct call in months, reportedly making progress on trade issues. This outreach raised hopes that the two economic superpowers might dial back some of the tit-for-tat tariffs and tech restrictions that have weighed on global growth. The Trump administration had earlier implemented a limited 90-day tariff reduction on select Chinese imports, and by late month officials hinted at the possibility of renewed trade negotiations. While no comprehensive deal is in place, markets viewed the revived dialogue as a positive step that reduces the risk of a new trade war escalation.

Separately, the U.S. also smoothed over trade frictions with key allies. A long-standing issue with Japan saw resolution as tariffs on Japanese auto imports were lowered effective mid-September as part of a prior bilateral agreement. However, not all trade news was sanguine. For example, China launched a probe into U.S. chip export policies earlier in the month, a move seen as retaliation in the ongoing tech and trade spat. Still, investors largely focused on the thawing U.S.-China tone as a bullish development.

A major political shock hit the U.S. at month’s end. The federal government entered a partial shutdown for the first time since 2023. With Congress deadlocked along partisan lines and failing to pass a budget or even a temporary funding bill by the September 30 deadline, large parts of the U.S. government ceased operations starting October 1. This shutdown immediately injected uncertainty into markets. Beyond the direct economic impact of furloughed workers and halted services, it also threatened to delay key economic data releases like the Labor Department’s September jobs report.

Indeed, investors and the Fed suddenly faced the prospect of making decisions in the dark without fresh government statistics, depending instead on private data. Equity markets wobbled a bit on the news of the shutdown, though the impact was relatively contained as traders assumed a short-lived impasse. The political brinksmanship in Washington did, however, dent the U.S. dollar and consumer sentiment slightly. At the time of this writing, the duration of the shutdown remains uncertain, and it has become a new risk factor to monitor as Q4 begins.

In Europe, one notable development was credit rating agency Fitch downgrading France’s sovereign debt rating by one notch (from AA- to A+) in September, citing concerns over France’s fiscal outlook and debt levels. Surprisingly, markets largely shrugged off the downgrade. French bond yields barely moved and the CAC 40 stock index actually jumped to a multi-week high afterward. Analysts suggested that with the European Central Bank still accommodating and France’s situation long known, this downgrade did not materially alter investors’ view. Elsewhere in European politics, no major elections or crises disrupted markets during the month, though ongoing negotiations over EU budgets and energy policy remained background points of contention.

Geopolitical conflicts saw mixed turns. The war in Ukraine ground on with no decisive breakthroughs. However, Russia’s oil infrastructure came under periodic attack (Ukrainian drone strikes on Russian refineries), which kept a modest risk premium in energy markets. In the Middle East, there was a surprising glimmer of potential progress. The U.S. reportedly brokered a tentative Gaza peace proposal that even won the backing of Israel’s Prime Minister Netanyahu.

While the response from other parties remained uncertain, the mere hint of a peace deal in the Israel-Palestinian conflict was enough for oil analysts to speculate about normalizing Middle East trade flows such as through the Suez Canal and easing geopolitical risk. Overall, September saw a slight reduction in global political risk, with trade wars thawing and a potential Middle East peace gesture, even as new uncertainties like the U.S. shutdown emerged. Markets, for the most part, took these events in stride, with the dominant narrative being one of policy support overcoming political noise.

Corporate Earnings and Stock Market Movers

Between earnings reports and corporate news, several notable U.S. companies saw big stock moves in September. Though this was not a core earnings season for most (with the bulk of Q3 results due in October), a few early reporters and off-cycle firms grabbed headlines. In the transportation sector, FedEx delivered an upbeat surprise. The delivery giant announced quarterly profits and revenues that beat analyst estimates, thanks to aggressive cost-cutting and resilient U.S. package volumes. FedEx’s stock popped about 2 to 3% on the news, and its optimistic outlook provided a positive read-through for the broader economy, suggesting consumer demand and supply chains remain healthy.

On the flip side, homebuilder Lennar signaled continued housing sector challenges. It reported weaker earnings and a soft outlook, including forecasting lower home deliveries than expected, sending its shares down over 4%. The U.S. housing market has been cooling under higher mortgage rates, and Lennar’s results underscored that trend, though with the Fed now cutting rates, some hope for relief is on the horizon.

The technology sector, a stalwart of 2025’s market rally, saw major corporate developments that excited investors. Nvidia announced it will take a 5 billion dollar stake in Intel, forging a new partnership with the struggling chipmaker. Nvidia’s move, coming just weeks after the U.S. government itself had taken a large stake in Intel, provides a lifeline to Intel’s turnaround efforts. The deal will see the two companies collaborate on certain chip technologies, particularly for AI and data centers, though Nvidia stopped short of committing to use Intel’s foundry for its own GPUs.

Markets reacted swiftly. Intel’s stock skyrocketed 23% on the announcement, its biggest one-day gain in decades, as investors saw Nvidia’s backing as a vote of confidence. Nvidia’s shares also rose around 3.8%, as the tie-up potentially opens new avenues for growth without compromising its supply chain flexibility. This unprecedented alliance was a highlight of the month, reflecting the massive strategic shifts underway in the semiconductor industry driven by the AI boom.

Other tech names also pushed markets higher. Apple’s stock jumped over 3% in one trading session after a major brokerage raised its price target, citing optimism around Apple’s latest iPhone launch and services growth. Oracle was another winner as its stock climbed after strong cloud sales and AI-focused partnerships boosted earnings. Meanwhile, Palantir Technologies saw its stock surge during the month amid buzz around its AI offerings and some large government contracts. By contrast, energy sector stocks lagged in September as oil prices declined. Integrated oil companies and shale producers saw their shares pull back from recent highs.

In the consumer sector, one standout was Nike. Nike reported fiscal Q1 results and managed a surprise increase in revenue of 1%, defying expectations of a decline. The company also beat earnings estimates comfortably, indicating its turnaround strategy is beginning to bear fruit even as challenges remain. Nike noted it was successfully clearing excess inventory and saw a return to growth in its wholesale segment. However, executives warned that tariffs and weakness in China are still drags. Higher U.S. import tariffs are expected to cost Nike 1.5 billion dollars this year, more than previously anticipated. Nike’s stock jumped about 3 to 4% in after-hours trading on the earnings beat, providing a boost to retail and apparel stocks. The results were a hopeful sign that U.S. consumer spending is not falling off a cliff and that big brands can navigate the choppy demand environment.

Overall, U.S. corporate news in September was dominated by tech sector moves and a few early earnings beats. The Nvidia-Intel deal underscored the seismic shifts in tech and gave a jolt of excitement to the market. The successful FedEx and Nike reports suggested parts of the economy are holding up better than feared, while some companies like Lennar reminded of pockets of softness. The overall tone from corporate America was cautiously optimistic heading into Q4.

Commodities, Bonds, and Other Assets

Commodity markets experienced notable price swings in September, often in opposite direction to risk assets. The standout story was crude oil’s sharp pullback. Oil prices tumbled after a summer rally as traders braced for a potential wave of new supply. By late September, Brent crude had fallen to around 66 to 67 dollars per barrel, and U.S. WTI crude dropped into the low 60s. For the month, oil was down roughly 5 to 6%, a significant reversal. Several factors drove this decline: reports emerged that OPEC+ might accelerate its output increases, effectively ending production cuts earlier than planned.

Saudi Arabia and allies were said to be considering a 500,000 barrel per day supply hike in November. Those rumors sent oil prices skidding. Compounding the pressure, Iraq’s northern oil exports resumed in September after a long halt, adding supply to markets. On the demand side, concerns about weakening global growth and the U.S. government shutdown weighed on the outlook. The result was a bearishly tilting oil market. Energy equities reflected this weakness, underperforming the broader market.

Precious metals soared. Gold prices rocketed to all-time highs in late September, fueled by safe-haven demand, falling real yields, and a softer dollar. The yellow metal broke its previous record and hit 3,895 dollars per ounce at one point. By the end of the month, spot gold was holding around the 3,850 to 3,880 range, up about 10 to 12% in September alone, marking its best month in 16 years. Investors flocked to gold as the Fed’s dovish turn ignited fears of currency debasement and as U.S. political drama injected uncertainty.

A weaker U.S. dollar contributed as well. The dollar index fell roughly 2% over the month, its lowest in several months, which mechanically makes gold cheaper in other currencies. Additionally, the plunge in short-term Treasury yields made non-yielding assets like gold more attractive. Silver also spiked to about 47 dollars per ounce, a level not seen in 14 years. The ferocity of the rally suggested investors are hedging against potential turbulence. With the Fed expected to continue cutting, gold bugs are optimistic the uptrend has more room, with talk of 4,000 dollars per ounce on the horizon.

In bonds, the story was one of rallying prices and falling yields, at least on the short end. The Fed’s policy shift led to a significant drop in short-term rates. The 2-year Treasury yield plunged into the mid-3% range, down from over 5% in the spring. The 10-year yield ended around 4.2%. The very long end rose slightly to 4.7%. This steepening of the yield curve can be interpreted as bond investors pricing in easier Fed policy and a bit more long-term inflation or deficit risk. Notably, the spread between 10-year and 2-year yields turned positive for the first time since 2022. In corporate bonds, credit spreads remained relatively tight. With equity markets at highs, there was little sign of credit stress, except perhaps in high-yield energy bonds if oil continues to weaken.

Currencies reflected these moves. The U.S. dollar finally lost some of its strength as the Fed’s rate advantage shrank. The euro and yen both gained modestly versus the dollar. The yen’s move was noteworthy as it rallied back into the mid-140s from multi-decade lows earlier, amid speculation the Bank of Japan might tweak policy and as U.S. yields fell. Emerging market currencies broadly benefited from the weaker dollar. The Chinese yuan stabilized around 7.1 per USD after the PBOC took steps to support it.

Industrial metals were mixed, with copper roughly flat on the month. Agricultural commodities had no singular trend. Some crop prices fell on improved harvests, while others like sugar spiked to multi-year highs due to weather-related output hits.

Overall, September saw a rotation in the multi-asset landscape. What was good for stocks proved bad for oil but great for gold. Bonds embraced the Fed’s turn, and the dollar slipped. This reflects a market positioning for the next phase of the cycle, one where growth is slowing but monetary support is rising.

Cryptocurrency Highlights

Cryptocurrencies extended their upward momentum in September, with the focus squarely on Bitcoin and Ethereum. Bitcoin had a historic month, surging to roughly 110,000 to 115,000 dollars at its peak, establishing a new all-time high well above its previous 2021 record. It finished the month around 112,000. Ethereum also rallied, though more modestly, ending the month above 4,100 dollars per coin, its highest level in over a year. Bitcoin’s dominance in the crypto market increased as its rise outpaced many altcoins, suggesting investors were concentrating on the most established digital assets.

Several factors drove the bullish sentiment in crypto. The general risk-on environment, with stocks at highs and the Fed easing, spilled over into speculative assets like crypto. Bitcoin is often seen trading like a high-beta risk asset, so lower interest rates and abundant liquidity boost its appeal. Growing optimism about regulatory approval of Bitcoin investment vehicles gave a tangible catalyst. The U.S. Securities and Exchange Commission is reviewing applications for spot Bitcoin ETFs, and the market increasingly expects a favorable outcome. By late September, analysts put very high odds on multiple spot crypto ETFs being approved in the coming weeks.

The SEC also adopted new standards to streamline ETF approvals, meaning many products could launch without case-by-case greenlights. This regulatory progress opens the door for mainstream investors and institutions to gain exposure to crypto through traditional brokerage accounts. Traders bid up Bitcoin and Ethereum in anticipation of fresh inflows once these ETFs go live. Some analysts even suggested Solana and XRP ETFs could debut as soon as October.

Beyond the ETF narrative, network fundamentals remained strong. Bitcoin’s hash rate and active addresses hovered at record levels. Ethereum’s Shanghai upgrade, completed earlier in 2025, improved staking and liquidity. Ethereum continues to anchor DeFi and NFTs, which saw renewed activity amid the broader crypto rally. Volatility persisted, with Bitcoin briefly pulling back below 110,000 mid-month on profit-taking. But dips were quickly bought by investors demonstrating fear of missing out.

Institutional adoption also advanced. More traditional financial firms explored crypto offerings, and some major tech companies hinted at integrating blockchain services. Macro investors also viewed Bitcoin as a potential hedge, much like gold, given fiat currency uncertainty. With both gold and Bitcoin hitting records in the same month, the debate over Bitcoin as digital gold intensified.

In summary, crypto markets were exuberant in September 2025. Bitcoin’s climb past 110,000 and Ethereum’s solid advance reflected both macro tailwinds and crypto-specific breakthroughs. As Q4 begins, crypto traders are keenly awaiting the SEC’s final ETF decisions and any further central bank easing, both of which could further propel this strong uptrend.

Concluding Thoughts

September 2025 capped an exceptional third quarter for financial markets. Equities rallied broadly to record or near-record levels, supported by cooling inflation and the long-awaited pivot by central banks toward easing. The U.S. Federal Reserve’s first rate cut, in particular, marked a key inflection point. Policymakers are now prioritizing growth risks after a long battle with inflation. This policy U-turn provided a green light for risk assets, even as it came in response to signs of economic fatigue. Markets are celebrating the prospect of Goldilocks: inflation is back near target, interest rates are set to fall, and while growth is slowing, it is not collapsing.

That said, investors are not without challenges heading into the final quarter of the year. The U.S. government shutdown introduces uncertainty and could dent confidence if it drags on. Global growth remains a question mark, with China’s recovery fragile and Europe facing fiscal headwinds. U.S. consumer strength will be tested in the holiday season. Corporate earnings in Q4 will be crucial to justify valuations. Additionally, geopolitical wildcards linger, though September showed some risks can surprise to the upside.

For now, the dominant market theme is cautious optimism. Bonds are signaling easier days ahead, commodities are not flashing inflation alarms, and equities are buoyed by the Fed’s readiness to support growth. The balance of data suggests the soft landing scenario remains possible. Risk assets could continue to perform well if this holds, though vigilance is needed if inflation resurges or growth falters.

In summary, September’s wrap reveals a financial world in transition. From tight policy to accommodative policy, from fear of inflation to concerns about growth, and from narrow leadership to broader participation. Investors have reason to be encouraged by the trends, but the final quarter will determine if 2025 truly ends as a standout year across asset classes.

august market wrap

Global Stock Market Trends

August 2025 extended the equity rally, with U.S. stocks posting a fourth consecutive monthly gain. The S&P 500 rose roughly 2.2% for the month, reaching new all-time highs by late August. The Nasdaq Composite also climbed (about 3%), powered by continued enthusiasm for tech and AI-focused names. Notably, the market’s leadership began to broaden beyond the “Magnificent Seven” mega-cap tech giants.

While companies like Nvidia, Microsoft, and Meta Platforms hit record valuations, smaller-cap and cyclical stocks played catch-up. The Russell 2000 small-cap index surged to its highest level of 2025, outperforming large-caps as investors rotated into beaten-down sectors. This “great rebalancing” saw strong rallies in financials, industrials, and consumer discretionary stocks, areas that had lagged earlier in the year.

Overseas markets mostly followed Wall Street’s lead. Major European indices notched modest gains, supported by easing policy uncertainty and a weaker dollar. Germany’s DAX and France’s CAC hovered near multi-year highs as recession fears ebbed.

In Asia, Japan’s Nikkei continued its stellar run, buoyed by corporate reforms and yen weakness, and remained near 30-year highs. In contrast, Chinese stocks lagged. China’s CSI 300 index was flat to down amid signs of economic strain and only cautious stimulus measures from Beijing. China’s economy grew about 5.2% in Q2 (on target), but persistent property sector woes and deflationary pressures weighed on investor sentiment. Overall, global equities in August showed resilience, with the U.S. leading and other regions advancing more selectively.

Macroeconomic & Central Bank Developments

United States: Economic data painted a picture of a slowing but still-growing economy. The labor market showed clear signs of cooling. The July nonfarm payrolls increase (reported in early August) was one of the weakest in years (well under 50,000 jobs), and the unemployment rate edged up to about 4.2%. Inflation continued to moderate despite new import tariffs pushing up certain prices.

The Fed’s preferred core PCE inflation held around 2.9% annualized, near target but still slightly above. Critically, the U.S. Federal Reserve held its benchmark interest rate steady at 4.25% to 4.50% during its late-July meeting, the fifth consecutive hold. Fed Chair Jerome Powell initially struck a cautious tone, emphasizing that inflation, while down from its peak, was “somewhat elevated” and that the Fed needed to see more evidence of cooling prices and wage pressures. This hawkish stance earlier in the summer had dampened expectations of any quick rate cuts.

However, by late August the script flipped. At the Fed’s annual Jackson Hole symposium on Aug 22, Powell opened the door to a possible interest rate cut at the upcoming September FOMC meeting. He noted that downside risks to employment were rising and said the Fed would “proceed carefully” given a shifting balance between inflation and growth risks. While stopping short of an explicit promise, Powell’s dovish hints caused markets to rapidly price in a September rate reduction.

Futures implied roughly an 85 to 90 percent chance of a quarter-point cut in September, up from about 75 percent before his speech. Fed officials echoed this tilt. Even traditionally hawkish Governor Waller stated he fully expects multiple rate cuts to begin soon to guard against a sharper slowdown. In response, U.S. Treasury yields fell in late August, the 10-year yield dipped toward about 4.2% after having hit 4.4% earlier, and the dollar weakened notably. The dollar index ended August down about 2% for the month, reflecting anticipated Fed easing. By month’s end, an interest rate cut on Sept. 17 was widely seen as imminent, which would mark the Fed’s first cut of the cycle after holding rates steady all year.

International: Other central banks were also in cautious mode. The European Central Bank, which had aggressively eased policy over the past year, kept its key interest rate unchanged at 2.00% at the July 24 meeting. With Eurozone inflation back near the 2% target and growth holding up, the ECB opted to pause and assess, marking the end of a string of rate cuts. ECB officials signaled a meeting-by-meeting approach going forward, monitoring risks from the U.S. trade conflict and energy prices.

Late-August data showed mixed inflation across Europe. For example, France’s CPI came in a tad lower than expected at 4.8% year on year, while Spain’s was steady around 2.7%. The Bank of England similarly left rates unchanged (at 4.50%) as UK inflation continued to recede from double-digits to mid-single digits. In Japan, the Bank of Japan maintained its ultra-easy stance, though speculation grew about a tweak to yield-curve control later in the year if inflation, now around 3%, stayed above target.

China’s economic momentum, meanwhile, faltered further, prompting hints of stimulus. August data indicated sluggish consumer spending, falling exports, and outright deflation in consumer prices (China’s CPI was about –0.3% year-on-year). The People’s Bank of China injected liquidity but surprisingly kept its benchmark 1-year Loan Prime Rate at 3.0% in the August fixing, the third straight month unchanged. Policymakers favored targeted support such as bank loan relief and modest fiscal measures over across-the-board rate cuts, wary of capital outflows and yuan depreciation. Nonetheless, Beijing signaled readiness to ease more if needed.

For example, state banks cut mortgage rates for existing borrowers and regulators reduced some trading fees to prop up equity markets. Markets are now anticipating a possible 10 to 20 bps PBoC rate cut by fall if China’s housing slump and deflation persist. In sum, globally the stage is set for a more accommodative turn in monetary policy, led by the Fed’s pivot toward rate reductions as inflation comes under control.

Trade War and Political Developments

Geopolitical and policy news once again had outsized market impact in August. Foremost was the implementation of sweeping U.S. tariffs that President Donald Trump had threatened earlier in the summer. On August 1, the U.S. allowed a temporary tariff reduction deal to expire, ushering in a new “universal” tariff regime on imports. As of early August, countries without a bilateral trade pact with the U.S. face steep reciprocal tariffs, a minimum 15% duty on goods from countries with which the U.S. runs a trade deficit, and 10% on those with a surplus, with many nations subject to much higher rates.

A chart of the finalized tariff schedule showed U.S. import duties jumping to levels unseen in decades. For example, imports from the EU are now generally hit with 15% tariffs, up from low-single digits before. Canada faces a 35% tariff on non-USMCA-compliant goods, and Brazil a massive 50% tariff on most products. Other countries from Asia to Africa saw tariff rates ranging from 19% to 30% or more. These tariffs took effect throughout early August, most by Aug 7, sending shockwaves through supply chains and raising fears of stagflation, higher prices and slower growth.

That said, intensive last-minute negotiations helped soften some blows. The White House secured framework trade deals or temporary exemptions with several partners just before the deadline. Notably, China received an extension of its tariff truce. The 10% duty on Chinese imports was temporarily extended past Aug 12 instead of jumping to a higher rate. This signaled ongoing U.S.–China talks and likely reflected Beijing’s commitment to purchase U.S. goods.

Likewise, the U.S. and European Union reached an in-principle understanding to avoid the harshest tariffs. While EU exports now see that flat 15% tariff, this was considered preferable to the 30 to 50 percent blanket tariffs threatened earlier. Mexico and a few others were granted short extensions or special terms as deals neared completion. These developments eased some investor anxiety that the trade war would spiral further. By mid-month, markets had largely priced in the new tariff reality, though companies exposed to import costs warned of margin pressures ahead.

On the domestic political front, an extraordinary battle over Federal Reserve independence made headlines. In late August, President Trump attempted to fire Fed Governor Lisa Cook, a Fed official who had opposed his calls for immediate rate cuts. This unprecedented move, the President has no clear authority to remove a Fed governor without cause, sparked a legal showdown. Cook sought a court injunction to block her ouster.

A federal judge expedited hearings on the case, which raised constitutional questions and rattled markets. Investors worried that politicizing the Fed could undermine confidence in U.S. monetary policy. The episode, alongside Trump’s persistent public attacks on Fed Chair Powell, underscored an unusual degree of political interference in central banking. While the Fed’s independence so far remains intact, the specter of Trump reshaping the Fed Board added a layer of uncertainty.

Geopolitically, the Russia–Ukraine war escalated in late August. In the pre-dawn hours of Aug 28, Russia launched one of the most intense missile and drone barrages on Kyiv of the year, killing at least 21 civilians. Ukraine retaliated with drone strikes on targets inside Russia, including two oil refineries. The White House said President Trump was “not happy” about the Russian attack and promised a response. He publicly weighed “very serious” new sanctions on Moscow and privately pressed NATO allies to tighten the economic noose.

The U.S. also doubled tariffs on imports from India (to 50% on certain goods) as punishment for New Delhi’s continued purchases of Russian oil. These actions highlight how trade policy is being used as a geopolitical tool. The market impact of the war flare-up was most visible in energy prices, but overall stock indexes showed only brief jitters. Elsewhere, the Middle East remained comparatively quiet, a welcomed change after the Iran-Israel conflict that flared in June. OPEC kept a low profile aside from its scheduled output decisions. And in U.S. domestic politics, early jockeying for the 2026 presidential race began, but with no major policy shifts yet, markets focused more on the trade war and Fed developments.

Corporate Earnings and Stock Market Movers

August saw the tail end of the Q2 corporate earnings season, with a mix of standout beats and notable misses affecting individual stocks. Broadly, earnings were better than feared, helping drive equity gains. By late August, over 85% of S&P 500 companies had reported, with roughly 80% beating analysts’ estimates, reflecting resilient profitability even amid higher costs. However, investors rewarded and punished companies in dramatic fashion based on forward outlooks:

  • Nvidia (NVDA): The AI-chip titan delivered another strong quarterly report in late August. Revenue for the quarter (May to July) surged over 50% year-on-year, handily topping expectations. Nvidia cited booming demand for its GPUs in data centers and AI applications. The stock, which had already skyrocketed in 2025, initially jumped to new highs above $600 after earnings. Yet, in a sign of lofty expectations, NVDA shares fluctuated after the results and ended the next day down about 2% as some investors took profits. Even so, Nvidia remains up about 35% year-to-date and is the world’s most valuable company by market cap, about 8% of the entire S&P 500. Its report was seen as a barometer for the sustainability of the AI-driven tech rally.

  • Retail Giants (Walmart & Target): U.S. consumer spending trends were in focus with big retailers reporting. Walmart (WMT) announced a solid Q2, with revenue up about 5% to $161 billion and improved full-year guidance. However, its earnings per share came in a few cents below consensus. Walmart cited slight margin pressure from shoplifting and higher labor costs. The stock had rallied into the report and then slipped about 3 to 4 percent afterward. Investors seemed to have expected an even stronger showing given Walmart’s position to benefit from consumers trading down to discounters.

    Target (TGT), on the other hand, continued to struggle. It reported a 0.9% drop in Q2 sales amid weak traffic and lingering consumer backlash to earlier controversies. Target’s EPS of $2.05 beat a low bar by a penny, but its cautious outlook (and a leadership transition underway) spooked the market. Target shares initially plunged 7 to 10% on the release, though they later recovered some losses. Year-to-date, TGT remains deep in the red as the retailer works to regain momentum.

  • Tech & Growth: With most Big Tech having reported in July, August’s notable movers were in software and internet. Salesforce (CRM) beat estimates and raised guidance, capitalizing on enterprise demand for AI-related offerings. Its stock jumped about 6% post-earnings to 52-week highs. A major highlight was MongoDB (MDB), the cloud database company, which skyrocketed 38% in one day after massively hiking its profit forecast. This double-digit surge made MongoDB one of the month’s top gainers in the NASDAQ 100.

    Similarly, Snowflake (SNOW) and other high-growth software names rallied on results indicating steady customer growth despite macro headwinds. On the flip side, some tech high-fliers stumbled. Intel (INTC) gave back about 8% over August as its outlook disappointed (PC demand remains soft), and Apple (AAPL) traded choppily. Its stock was flat for the month as investors await the fall product launch cycle.

  • Industrials & Energy: Old-economy sectors saw significant stock-specific action. Boeing (BA) climbed to a 1-year high after announcing an uptick in aircraft deliveries and positive free cash flow, suggesting its turnaround is taking hold. Caterpillar (CAT) shares jumped about 9% in August, buoyed by strong construction equipment sales and China stimulus hopes.

    In energy, ExxonMobil (XOM) popped mid-month on rumors it is exploring a mega-acquisition of a shale producer, part of a wave of consolidation in oil and gas. Meanwhile, European oil major BP saw its U.S.-listed shares retreat a bit after June’s takeover speculation cooled. No deal materialized in August, and BP gave a somewhat cautious outlook. One notable loser was Occidental Petroleum (OXY), down about 6%, after earnings missed and it disclosed a pause in buybacks. Even Warren Buffett’s continued buying of OXY shares could not buoy the stock this month.

  • Notable Collapses: August had a few collapsing stocks that served as cautionary tales. Dollar Tree (DLTR), a discount retailer, plunged 12% in a day after slashing its profit forecast due to rising theft (shrink) and the need to cut prices. Hawaiian Electric (HE) shares lost nearly half their value (and were halted multiple times) amid allegations that its equipment sparked Maui’s devastating wildfires, a potential PG&E-like liability scenario. Also, troubled regional bank PacWest saw its stock dive about 20% early in the month before a planned acquisition by Banc of California stabilized its fate. These episodes underline that even in a rising market, idiosyncratic risks such as legal, regulatory or execution issues can trump broader trends.

In aggregate, Q2 earnings growth for the S&P 500 turned slightly positive, snapping the earnings recession of prior quarters. Profit margins have proven durable, and sectors like tech and consumer discretionary delivered particularly robust results. The earnings-fueled optimism helped the S&P 500 overcome macro worries in August. Still, traders remain discriminating. Blowout results led to outsized one-day pops of 10% or more, while any misses or weak guidance were severely punished, with double-digit drops common. This high dispersion environment created rich trading opportunities over the month.

Commodities, Bonds, and Other Assets

The macro cross currents in August drove significant moves in commodities and fixed income markets:

  • Oil: Crude oil prices swung on geopolitical news and OPEC plus supply decisions. In the first half of August, oil was under pressure. Brent dipped into the low 70s and WTI into the low 60s per barrel amid concerns of softer demand, a late summer U.S. inventory build, and the announcement that OPEC plus would raise output by 547,000 barrels per day in September. However, the end of month flare up in Russia Ukraine fighting sent oil sharply higher. After Russia’s late August missile strikes on Ukraine and talk of new sanctions, Brent spiked back up to about 69 dollars and WTI to about 65 dollars by August 28. The weaker U.S. dollar provided a tailwind to oil prices in the final days. Overall, Brent and WTI each ended August roughly 3 to 4 percent higher for the month. Energy equities responded accordingly, with the S&P 500 Energy sector up about 9 percent, making it the top performing sector in August.

  • Gold and Precious Metals: Gold continued to shine as a safe haven and inflation hedge. The price of spot gold hovered near all time highs in August, trading around 3,300 to 3,400 dollars per ounce. That is roughly a 25 percent gain year to date. Factors lifting gold included expectations of Fed rate cuts and persistent central bank buying. By mid month, gold briefly tested the 3,400 level, and some analysts see 3,500 and above on the horizon if the dollar slides further. Silver also rallied, ending around 37 dollars per ounce, its highest in several years. Notably, despite the risk on mood in equities, gold’s strong performance suggests a subset of investors is still hedging against potential turbulence.

  • Bonds: Bond markets were whipsawed by shifting rate expectations. Early in August, yields ticked higher. The 10 year U.S. Treasury yield approached 4.4 percent, a level last seen in late 2024, amid heavy Treasury issuance and no concrete Fed easing yet. The curve remained steeply inverted, the 2 year vs 10 year spread around minus 50 basis points, for much of the month, signaling growth concerns. However, once Powell indicated a likely rate cut, yields fell markedly. The 10 year yield ended around 4.25 percent, about 15 basis points lower than late July. The more Fed sensitive 2 year yield dropped even more, sliding toward 3.7 percent, its lowest since early spring. This caused a modest steepening of the yield curve by month end as short rates fell on easing bets. In credit markets, investment grade and high yield credit spreads tightened to multi month lows, reflecting investors’ risk appetite. Companies rushed to issue debt ahead of potential Fed cuts, resulting in one of the busiest Augusts for U.S. corporate bond issuance in over a decade.

  • Foreign Exchange: Currency movements in August were dominated by the weakening U.S. dollar. The dollar index fell about 2 percent in August, its fourth straight monthly decline. The prospect of Fed rate cuts reduced the dollar’s yield appeal. The euro gained roughly 2.3 percent against USD, hitting about 1.17 dollars. The British pound climbed to about 1.35 dollars. Emerging market currencies enjoyed a breather thanks to the dollar’s retreat. Notably, the Japanese yen was an outlier. It weakened beyond 147 per dollar at one point, a 2.5 percent monthly loss for the yen, prompting speculation of possible intervention. The Chinese yuan also remained soft around 7.3 per USD, though measures by the PBoC slowed its decline.

  • Other commodities: Industrial metals saw mixed trends. Copper traded range bound around 4.00 dollars per pound. Hopes of Chinese stimulus gave it a mid month pop above 4.10, but lackluster China PMI data later pulled it back. Aluminum rose about 5 percent on supply curbs in China due to power shortages. Agricultural commodities had an eventful month. Grain prices spiked after Russia exited the Black Sea grain deal and bombed Ukrainian ports, then partially retreated as Northern Hemisphere harvests came in strong. Chicago wheat still ended about 8 percent higher in August. Corn and soybeans were more subdued, with decent U.S. crop conditions balancing out weather concerns.

August’s broad theme was one of reduced pressure. Lower yields and a softer dollar provided relief across many asset classes. Commodities like oil and gold benefitted from the dollar weakness and specific geopolitical catalysts. Investors appear to be positioning for an inflection point in global monetary policy as we head into the fall.

Cryptocurrency Highlights

The cryptocurrency market built on its summer surge, with August bringing new milestones for the two largest digital assets:

  • Bitcoin (BTC): The flagship crypto extended its 2025 rally to fresh all time highs. Early in the month, Bitcoin confidently broke above the 120,000 dollar level for the first time. On August 14 it reached about 124,000 dollars, a record intraday high. At that price, BTC’s market capitalization around 2.4 trillion dollars exceeded the market cap of Alphabet, making Bitcoin one of the top four most valuable assets in the world. Drivers included continued inflows into U.S. spot Bitcoin ETFs and a weakening dollar with imminent Fed rate cuts. By late August, Bitcoin saw some profit taking and pulled back to the low 120Ks from its mid month peak. Dips were met with buying, and BTC held firmly above the psychological 115K level throughout the month. Its dominance in the overall crypto market rose to about 50 percent.

  • Ethereum (ETH): Ethereum had an outstanding August and in many ways outperformed Bitcoin. ETH started the month around 3,500 dollars and by mid August smashed through the 4,000 barrier for the first time since 2021. It continued to grind higher, hitting approximately 4,800 dollars at its peak late in the month. That price is just shy of Ethereum’s all time high near 4,865 set in late 2021. Strength came from a booming layer 2 ecosystem, anticipation of a possible Ethereum ETF approval with decisions expected in October 2025, and rotation by investors who felt ETH had been lagging BTC year to date. After trailing in the first half, ETH jumped roughly 55 percent in July and another 15 to 20 percent in August, far outpacing BTC over the summer. By end of August, ETH was trading near 4,700 dollars and was up roughly 35 percent for 2025 to date. One caveat: on chain metrics such as DeFi total value locked and NFT volumes, while improved, have not skyrocketed to new highs alongside price. Still, ETH’s resurgence narrowed Bitcoin’s performance gap.

Crypto market breadth was positive as well. The total crypto market cap rose above 4 trillion dollars for the first time in history. Several altcoins had strong months. XRP rallied more than 20 percent on optimism for regulatory clarity. Solana and other smart contract platform tokens jumped 15 to 25 percent as traders hunted catch up trades after ETH’s run.

Even meme coins saw renewed life. Dogecoin jumped back above 0.22 dollars at one point on speculation of a potential social media integration, and Pepe Coin more than doubled at one stage before volatile trading trimmed gains. The broad altcoin rally gave the market an alt season vibe by mid month, though by late August Bitcoin’s dominance crept up again as traders rotated back to the majors.

On the regulatory and infrastructure front, the SEC delayed decisions on several Ethereum ETF applications to October 2025. Traditional financial giants pushed further into crypto, with new custody offerings and stablecoin rollouts. Liquidity improved compared to earlier in the year, bid ask spreads tightened, and open interest in Bitcoin futures reached record highs. Volatility remained elevated, with brief but sharp squeezes reminding traders how quickly the asset class can move.

All told, August was one of the most bullish months for crypto in 2025. Bitcoin solidified its status above 100K, Ethereum closed in on its prior peak, and adoption signals kept building.

Concluding Thoughts

August 2025 capped off a strong summer for financial markets, characterized by a broadening stock rally, cooling inflation, and rising hopes that central banks will pivot to easing. U.S. equities hit record highs on the back of robust earnings and renewed risk appetite, and the rally spread beyond the mega cap tech darlings. Small caps and cyclical sectors came alive, indicating improving market breadth. The macroeconomic backdrop gave investors reason for optimism.

Price pressures continued to abate with U.S. inflation hovering near 3 percent even as growth, while slowing, remained positive. This mix of lower inflation and still decent growth has stoked speculation that the Fed can engineer a soft landing.

Fed Chair Powell’s acknowledgment of rising employment risks and openness to cutting rates marked a turning point in policy tone. Markets swiftly priced in a September rate cut, providing a tailwind to stocks, bonds, and other risk assets. A slew of global central banks are in a similar holding pattern, if not moving toward accommodation. The prospect of lower interest rates and cheaper liquidity is a key reason we saw cyclicals, housing related shares, and emerging markets bounce higher in August.

But risks still remain. The U.S. China trade war escalated to unprecedented tariff levels, which will start filtering through to corporate costs and consumer prices later in the year. Geopolitical tensions are an ever present wildcard that could rattle markets. The Russia Ukraine conflict’s twists continue to influence energy prices and investor sentiment. Additionally, while the Fed seems poised to ease, friction between the White House and the Fed raises uncertainty. Any perceived erosion of central bank independence or policy credibility could spook investors and strengthen safe havens like gold.

Moving into the autumn, investors will be watching for confirmation that inflation stays contained even as tariffs bite, and that growth does not slip too much as monetary policy shifts. If September brings the first Fed rate cut of the cycle, it will inaugurate a new phase for markets. August’s gains have priced in a lot of good news, so follow through will depend on data matching the rosier expectations.

For now, the bulls remain in control. The S&P 500 uptrend is intact, credit conditions are benign, and crypto enthusiasm is back. Caution is warranted given how far and fast risk assets have run, but after navigating a minefield of risks in prior months, markets in August demonstrated resilience and an appetite to ride the potential policy easing wave.

july 2025 market wrap

Global Stock Market Trends

July 2025 was broadly positive for equity markets. In the US, the S&P 500 and Nasdaq Composite notched their third consecutive month of gains, hitting multiple record highs during the month. The S&P 500 rose about 2.2% in July, while the tech-heavy Nasdaq jumped 3.7%, buoyed by strong corporate earnings and investor optimism. The Dow Jones Industrial Average lagged with a roughly flat month (0.1%), but even the Dow extended its winning streak to three months.

Major European and Asian stock indices also climbed amid the global rally, though to a lesser extent. Europe’s STOXX 600 and other regional indexes posted modest gains, supported by improving economic sentiment and easing policy uncertainty. Notably, mega-cap technology stocks, the “Magnificent Seven,” powered much of the US market’s strength, with a key tech index hitting all-time highs. This came as Microsoft briefly topped a $4 trillion market valuation and Meta surged to record share prices on stellar earnings. Overall, global equities proved resilient in July, advancing despite ongoing trade war tensions and other risks.

Macroeconomic & Central Bank Developments

Economic data in July painted a picture of solid growth with nascent signs of cooling. In the US, second-quarter GDP grew at an annualized 3% pace, stronger than expected and indicating continued economic expansion. The labor market remained robust but showed some slowing: June payrolls (reported in early July) rose by 147,000, the weakest gain since last fall, and the unemployment rate hovered just above 4%. Inflation data was mixed – consumer price inflation ticked up in June, influenced in part by new import tariffs driving up costs. Nonetheless, core price trends remained moderate, and consumer sentiment reached a five-month high on the back of the stock rally.

Central banks took a cautious pause in July. The US Federal Reserve left its benchmark interest rate unchanged in the 4.25% to 4.50% range, despite open pressure from President Trump for rate cuts. Two Fed governors dissented in favor of cutting rates, but Chair Jerome Powell emphasized that the Fed’s priority is taming inflation, which remains “somewhat elevated,” and that it needs more data on the impact of trade policies before easing. Powell’s hawkish tone dampened market hopes of any quick rate cuts, leading investors to drastically scale back expectations of a September policy easing.

Across the Atlantic, the European Central Bank (ECB) also held its key rate steady at 2.00%, pausing after a year of monetary easing. With eurozone inflation back at the 2% target and growth holding up, ECB policymakers opted to wait and assess incoming data, especially given uncertainty around Europe’s trade relations with the US. The ECB noted that domestic price pressures have eased and signaled a meeting-by-meeting approach as it monitors if US tariff conflicts will undercut European growth. Meanwhile, China’s economy grew about 5.2% year-on-year in Q2, roughly on target, but faces headwinds.

Chinese data showed persistent weakness in the property sector and cautious consumer spending, partly due to the overhang of US tariffs. Beijing’s leadership refrained from major new stimulus in July, opting for targeted support measures as long as growth stays near 5%. Notably, a temporary US–China trade truce (and firms rushing shipments before tariff deadlines) helped China avoid a sharper slowdown so far. Overall, global monetary policy was characterized by patience and vigilance, as central bankers balanced cooling inflation and growth against the uncertain impact of trade conflicts.

Trade War and Political Developments

Trade policy and geopolitics were major market factors in July. The US–China trade war entered a new phase as President Donald Trump threatened broad tariff hikes on countries lacking trade agreements with the US by summer’s end. Early in the month, the White House announced steep new duties (some exceeding 30% to 50%) on imports from dozens of nations including allies like Canada, Brazil, India, Switzerland, Thailand, and Taiwan to take effect if deals weren’t reached by an August deadline. These moves aimed to “reorder the global economy” and represented the highest US tariff rates since the 1930s, sending global markets tumbling at times as investors feared escalating protectionism.

However, intensive negotiations through July yielded some relief. The White House struck trade agreements in principle with many partners (and granted certain reprieves, such as a 90-day extension for Mexico) to avoid the harshest tariffs. For example, diplomats indicated the US and EU were moving toward a deal that might impose a simplified 15% tariff regime on European goods, an outcome worse for Europe than status quo, but better than earlier feared blanket hikes. These eleventh-hour deals and exemptions eased tariff anxieties in the latter part of the month, helping equity markets rebound from an April–May selloff that had been sparked by initial tariff announcements. By month-end, uncertainty remained (with a final tariff deadline looming on August 1), but the general tone shifted to cautious optimism that many trade partners would avert the most punitive duties.

On the domestic US front, political developments also impacted specific sectors. The Trump administration took aim at high drug prices, with the President sending letters to CEOs of 17 major pharmaceutical companies urging immediate price cuts. This unexpected intervention drove pharma stocks lower; the NYSE Pharma Index slumped nearly 3% in one day, its worst drop since May. Separately, President Trump continued his public pressure on the Fed via social media and speeches, demanding deep interest rate cuts to stimulate growth, an unprecedented campaign that raised concerns about Fed independence. Two Fed officials appointed by Trump even dissented at the July meeting in favor of cuts, highlighting this tension.

Abroad, geopolitical flashpoints simmered but did not severely jolt markets in July. The conflict between Israel and Iran (including unrest in the Persian Gulf) drove oil prices higher early in the month, but fears of a broader Middle East escalation faded as the situation stabilized. The ongoing war in Ukraine and other global risks continued in the background, but investors appeared more focused on trade and economic news. Overall, political news in July had a palpable market impact, with active US trade and industrial policies creating pockets of volatility even as broad investor sentiment improved once worst-case outcomes were averted.

Corporate Earnings and Stock Market Movers

July also kicked off the Q2 corporate earnings season, which delivered generally better-than-expected results, especially from US technology giants. Roughly 80% of S&P 500 companies beat earnings forecasts by the end of the month, a higher “beat rate” than recent averages, boosting confidence that corporate America remains resilient. Big Tech in particular posted standout numbers that drove major stock moves:

  • Microsoft (MSFT) reported strong quarterly earnings, fueled by growth in cloud and AI services. Its stock jumped about 3% to 4% on the results, briefly pushing Microsoft’s market capitalization above the historic $4 trillion threshold during trading. Microsoft became only the second company ever to reach that valuation (after earlier moves by Nvidia).

  • Meta Platforms (META) blew past expectations with surging advertising revenues and an upbeat forecast, crediting AI-driven improvements in ad targeting. Meta’s stock soared 11% in one day, hitting an all-time high above $770 per share. This double-digit gain in a mega-cap name was the standout move of the month, cementing Meta’s year-to-date leadership.

  • Alphabet/Google (GOOGL) also delivered solid results (boosted by cloud and search advertising), though its stock reaction was more muted. After a strong run-up prior to earnings, Alphabet shares seesawed and ended July roughly flat to slightly up, as investors rotated into other tech names.

  • Amazon (AMZN) posted a 13% jump in revenue (to $167.7 billion) and better-than-expected profits, with Amazon Web Services (AWS) growth of 18% beating forecasts. However, investors were underwhelmed by Amazon’s outlook and possibly expected even more in cloud business after Microsoft’s blowout. As a result, Amazon’s stock initially climbed in anticipation but then fell about 2% to 3% after earnings, trimming its gains. Essentially, Amazon’s strong quarter was viewed as “good, not great” relative to sky-high hopes.

  • Apple (AAPL), reporting at month-end, topped analyst estimates with a 10% rise in revenue (to $94 billion) and improved profits. iPhone sales jumped 13% and Services revenue hit a record, offsetting dips in iPad sales. Apple’s stock, which had been down approximately 17% for the year, popped about 3% in after-hours trading on the earnings beat. Investors were relieved by Apple’s return to growth and signs of strength in its ecosystem.

  • Among other notable tech names, Tesla (TSLA) had a more mixed showing. Tesla’s earnings indicated a squeeze on profit margins, revenue actually fell slightly amid aggressive EV price cuts, and Elon Musk warned of “rough quarters ahead” as the company transitions technologies. Tesla’s stock seesawed in July, rallying early in the month but slipping about 3% after the Q2 report and guidance to finish roughly flat. Similarly, Nvidia (NVDA), the year’s star performer on AI chip demand, took a breather; its shares edged down about 1% on the last day of July, as investors locked in some profits despite no new earnings from Nvidia during the month.

Outside of big tech, semiconductor stocks and other AI beneficiaries had a volatile month. While the AI boom remained a major theme, there was a bit of a rotation in late July: chipmakers like Broadcom (AVGO) and Qualcomm (QCOM) saw their stocks drop sharply. Broadcom slid approximately 3% on concerns of peaking chip demand, and Qualcomm plunged 8% in one day amid a soft outlook and news that Apple will soon use its own iPhone modems (threatening Qualcomm’s future revenue). Those declines dragged the Philadelphia Semiconductor Index down over 3% on July 31, its worst day since April. Meanwhile, enterprise tech and communications firms had some winners: for instance, Comcast (CMCSA) climbed on solid results, and IBM and AT&T posted steady performances that reassured investors in the beaten-down telecom sector.

Crucially, the earnings season also produced major moves in individual stocks beyond tech. Some companies delivered exceptionally strong results and outlooks, igniting huge rallies:

  • eBay (EBAY) surged 18% in a single day, leading the S&P 500, after the online marketplace beat sales and profit estimates and issued upbeat guidance for next quarter. EBay’s gross merchandise volumes rebounded more than expected, signaling a turnaround in e-commerce activity.

  • C.H. Robinson Worldwide (CHRW), a freight logistics company, similarly jumped 18% post-earnings. It reported better-than-expected revenue and profits thanks to aggressive cost-cutting (including layoffs) that expanded its margins. This was a dramatic rebound for a transportation stock that had struggled with freight downturns.

  • Carvana (CVNA), the online used-car seller and one-time meme stock, saw its shares soar 17% after it surprised Wall Street with improving finances and possibly some restructuring progress. Heavy short interest likely fueled this sharp rally as traders rushed to cover positions.

On the flip side, there were some big disappointments and collapses:

  • Align Technology (ALGN), maker of Invisalign dental aligners, suffered a disastrous report. Its earnings missed expectations and it announced layoffs and a restructuring. Align’s stock plunged a stunning 37% in one day, marking the worst S&P 500 performance of the month. The company’s outlook was hurt by slowing orthodontic demand and one-time charges for the restructuring.

  • Baxter International (BAX), a medical products firm, cut its 2025 forecast after a weak quarter (still reeling from supply disruptions and soft hospital demand). Baxter’s stock tumbled 22% to a 19-year low on the news, as investors were shocked by the magnitude of the miss and the reduced guidance.

  • Anheuser-Busch InBev (BUD), the global beer giant, saw shares drop about 13% after reporting declining North American sales. Lingering consumer boycotts in the US (related to earlier controversies) and overall volume declines hit its earnings. The steep fall erased much of BUD’s year-to-date gains and highlighted ongoing brand challenges.

  • International Paper (IP) fell nearly 13% as well, after the packaging manufacturer missed profit estimates due to weak European demand and maintenance outages. This underscored how industrial and materials companies exposed to Europe are feeling the pinch of a slowing global manufacturing cycle.

Overall, the earnings season narrative was positive, with strong aggregate growth, especially in tech. The S&P 500’s earnings beats, combined with easing macro fears, helped lift the index to new highs. Yet stock reactions were highly differentiated: investors rewarded clear winners with outsized one-day gains of 10% to 20% in some cases and punished any significant misses with 20% to 35% implosions. This environment created rich trading opportunities and underscored the importance of guidance and forward-looking commentary.

Commodities, Bonds, and Other Assets

July saw notable moves across other asset classes as well. In the oil market, prices swung on geopolitical and OPEC-related news. Early in the month, crude oil jumped (Brent and WTI climbed roughly 8% to 10%) amid Middle East tensions, after conflict flared between Israel and Iran and raised fears of supply disruptions. US WTI crude hit a five-week high around $70 per barrel. However, later in July, oil eased off highs as supply fears abated and rumors emerged that OPEC might boost production to stabilize prices. By month-end, WTI crude settled near $69 per barrel, up slightly on the month.

In contrast, gold prices spiked to all-time highs during July amid the backdrop of trade uncertainty and inflation hedging. Gold futures briefly traded above $3,300 an ounce, a record level, as investors sought safety. Late in the month, gold saw a sharp pullback (down about 0.3% on July 31) as real interest rates inched up, but it remained dramatically higher year-to-date, reflecting strong safe-haven demand.

In currency and bond markets, the US Dollar Index (DXY) strengthened significantly. The dollar had its best month of 2025, climbing to about 100.0 on the index (the highest since mid-May) bolstered by higher US yields and safe-haven flows on tariff worries. Notably, the Japanese yen weakened to multi-month lows (amid speculation of continued easy policy by the Bank of Japan), and the euro also softened slightly given Europe’s growth jitters.

US Treasury yields were relatively stable but finished at elevated levels. The 10-year Treasury yield hovered around 4.3% to 4.4% at the end of July, roughly unchanged from a month prior, as strong economic data offset hopes of any Fed rate cuts. Shorter-term yields stayed near the Fed’s policy rate, resulting in a continued inverted yield curve (a sign of future growth concerns). Credit markets were calm; US investment-grade and high-yield corporate bonds earned modest positive returns as investors chased yield with recession fears receding.

Cryptocurrency Highlights

The cryptocurrency market saw a major resurgence in July, led by the two largest digital assets. Bitcoin (BTC) extended its remarkable 2025 rally, trading above $115,000 by late July. In fact, Bitcoin briefly hit an intraday high near $119,000, a level unimaginable just a couple of years ago, before a bout of profit-taking pulled it back slightly. Even with some end-of-month volatility, Bitcoin’s price was up substantially over the month, reflecting both a broad crypto bull trend and its appeal as a hedge in an environment of persistent inflation and currency uncertainties.

Market analysts noted that over $600 million in bullish BTC bets were liquidated during a quick mid-week drop (when BTC fell from around $119K to $115K), but the coin swiftly recouped those losses, showcasing resilient demand. Interest in Bitcoin was fueled by factors like institutional adoption (such as renewed hopes for a Bitcoin ETF approval in the US), inflation hedge narratives, and even concerns about the Fed’s independence – some crypto investors speculated that political pressure on central banks could enhance Bitcoin’s long-term appeal as an alternative asset.

The standout crypto story, however, was Ethereum (ETH). Ethereum’s price skyrocketed over 50% in July, massively outperforming Bitcoin and most other assets. By late July, Ether crossed $3,800 (its highest in seven months) after starting the month around the mid-$2,000s. In percentage terms, Ethereum gained approximately 54.8% in one month, its best monthly performance in three years, as it led the crypto market.

Several factors drove this surge: Ethereum saw large capital inflows (around $2.8 billion net in July) amid renewed investor confidence. On-chain activity on Ethereum also hit record levels, with daily gas usage (a proxy for transaction and smart contract demand) reaching all-time highs. This suggests booming usage of Ethereum-based decentralized applications and possibly the impact of new Layer-2 scaling solutions attracting users. Moreover, July’s risk-on environment and some speculation around potential Ethereum ETF filings or upcoming network upgrades might have boosted sentiment. By month-end, ETH was trading near $3,800 to $3,900, firmly establishing itself as one of the top-performing major assets of 2025 so far. Traders noted that Ether’s rally was so rapid that it closed July at multi-month highs and logged its strongest July on record, prompting discussion of whether it might be overextended or entering a new adoption-driven phase.

The broader crypto ecosystem followed Bitcoin and Ether higher: total crypto market capitalization grew, and altcoins rallied (though with high volatility). Importantly, crypto markets showed resilience even when equities wobbled late in the month. When stocks pulled back on Fed concerns and tariff headlines, Bitcoin initially dipped (falling below $115K momentarily) but then stabilized and rebounded within 24 hours. Some analysts interpreted this as crypto decoupling slightly from traditional risk assets, possibly trading on its own fundamentals of network demand and as digital gold.

However, others cautioned that if tariffs drive inflation up in coming months, it could be a two-edged sword: initially hurting crypto as risk sentiment declines, but potentially helping Bitcoin later as inflation-hedge and hard-asset narratives strengthen. For now, July ended with crypto market optimism at a high, Bitcoin firmly above six figures and Ethereum’s momentum attracting both retail and institutional interest.

Concluding Thoughts

July 2025 saw a powerful rally in US equities, with the S&P 500 and Nasdaq reaching new all-time highs. The gains were driven primarily by strong earnings from Big Tech, as Microsoft, Meta, Apple, and Google all exceeded expectations, reinforcing confidence in the AI and cloud growth narrative. At the same time, the market showed little forgiveness for underperformance, as seen in the steep declines of companies like Align Technology and Baxter following disappointing results. This selective reaction suggests a high-stakes earnings environment where investors are quick to reward clear winners and equally quick to exit laggards. As such, the most effective strategy now is to ride strength in quality leaders while being disciplined with risk, especially around earnings. Tech and AI names with consistent growth remain strong candidates, but speculative positions without conviction should be avoided heading into earnings reports.

Macroeconomic data painted a picture of steady but slightly cooling growth. US GDP expanded at a solid 3% annualized pace, while unemployment remained low. Inflation ticked up modestly, partly due to new tariffs, but core trends stayed manageable. The Fed and ECB both paused on rate changes, opting for a wait-and-see approach. Fed Chair Powell emphasized caution and data dependence, pushing back against political pressure for immediate cuts. With monetary policy still on hold and inflation not yet low enough to prompt easing, markets are especially sensitive to economic data releases. In this environment, sectors that benefit from a soft landing such as technology and consumer discretionary are likely to outperform, while rate-sensitive sectors like REITs and utilities may struggle unless clearer dovish signals emerge.

Geopolitically, trade tensions re-emerged as a major market theme. The White House announced steep tariff threats on a broad range of US trading partners, initially triggering market anxiety. However, investor sentiment recovered later in the month as many nations reached temporary deals or received exemptions, easing fears of an immediate global trade war. Still, with key deadlines approaching in August, uncertainty lingers. Investors would be wise to stay agile. If trade tensions escalate again, defensive positioning in healthcare, consumer staples, or safe-haven assets like gold and the dollar may prove prudent. Conversely, if trade risks fade, there may be opportunities in oversold global cyclicals or exporters, particularly in Europe and Asia.

Commodities reflected the broader risk-on mood. Oil prices jumped early in the month due to Middle East tensions but stabilized as supply fears eased. Gold surged to a record high above $3,300 amid safe-haven demand and inflation concerns before pulling back slightly. Meanwhile, the US dollar had its best month of the year, and bond yields remained elevated around 4.3%, reflecting strong growth and reduced expectations for rate cuts. Investors holding gold should consider tightening stops or taking partial profits, as the rally could face resistance if real yields continue rising. In the bond market, duration risk remains high. Positioning in shorter-term or floating-rate bonds offers a safer approach until rate direction becomes clearer.

Crypto markets delivered the most explosive gains. Bitcoin continued its 2025 bull run, trading between $115K and $120K, while Ethereum posted a staggering 50% monthly gain, fueled by surging network usage and strong capital inflows. Ethereum’s outperformance makes it a standout trend candidate, though traders should wait for consolidation or pullbacks before adding exposure. Bitcoin, showing signs of steady institutional accumulation, may offer compelling reentry opportunities on dips toward the $100K to $105K range.

Overall, July ended on a note of cautious optimism. Strong earnings, stable central bank policy, and temporary relief on trade helped lift risk assets across the board. But with key macro data and tariff decisions looming in August, investors should stay focused on high-quality growth opportunities while managing risk with discipline. The tone remains constructive, but agility will be key in navigating the next leg of the market cycle.

monthly wrap banner june 2025

Macroeconomic Indicators and Central Bank Policy

The U.S. Federal Reserve held its benchmark interest rate steady at 4.25% to 4.50% during the June 2025 FOMC meeting, the fourth consecutive pause. However, the Fed’s latest projections signaled potential rate cuts later in the year. Policymakers penciled in two quarter-point cuts by year-end amid signs of moderating inflation and softer economic momentum. Other central banks were also closely watched; for example, the European Central Bank and Bank of England maintained a tightening bias given still elevated inflation (though no major surprise moves were reported in June).

U.S. inflation remained modest. The Consumer Price Index (CPI) for May (released in June) rose just +0.1% month on month and +2.4% year on year, slightly cooler than expected as cheaper gasoline offset rising rents. Core CPI (excluding food and energy) was up 2.8% YoY. While current inflation is near the Fed’s target range, tariffs imposed by the Trump administration are expected to push prices higher in coming months.

In fact, retailers like Walmart warned they would raise prices by June due to tariffs, and the Fed’s preferred core PCE index came in a bit hotter than anticipated. Nonetheless, the subdued May inflation data gave markets hope that price pressures were easing for now, and Treasury yields actually fell on the news.

The labor market remained relatively strong but showed hints of cooling. U.S. unemployment stayed near historically low levels (in the mid 3% to 4% range) as of June, and the Fed noted the jobless rate “remains low.” However, some softening signs emerged: a private payrolls report (ADP) showed only approximately 37,000 jobs added in May, and weekly jobless claims ticked up slightly.

The Fed actually revised up its year-end unemployment forecast to approximately 4.5%, anticipating a mild rise in joblessness ahead. Overall, employment is still robust but not as red-hot as before, which, alongside cooling inflation, bolsters the case for the Fed to hold or cut rates in coming months.

Globally, growth signals were mixed. China’s manufacturing PMI for June stayed below 50 (in contraction) for a third month, though new orders improved slightly, highlighting uneven recovery in the world’s second-largest economy. In Europe, inflation remained above target, keeping pressure on the ECB, but European economies showed resilience with strong equity performance (helped by a weaker USD and easing trade fears).

Commodity prices were volatile (see below), reflecting geopolitical risks. Overall, macroeconomic conditions in June featured cooling inflation and a still tight but slightly softening labor market, allowing central banks (notably the Fed) to stand pat and mull future easing, while tariff actions and overseas developments injected uncertainty.

Major Political and Geopolitical Developments

Trade policy was a key market driver in June. Early in the month, U.S. and China negotiators reached a framework to revive their trade truce from 2023, which helped improve sentiment. However, many U.S. import tariffs remained in place. The effective U.S. tariff rate had jumped to approximately 13% (from 3% in January) due to President Donald Trump’s new “Liberation Day” tariffs, and unresolved issues (like China’s export curbs on rare-earth metals) kept trade uncertainty alive.

The White House also worked on trade deals with other partners; for instance, a potential agreement with China was signed (pending implementation) and deals with 10 other countries were hinted at. Notably, Trump delayed a threatened 50% tariff on EU imports, pushing its implementation beyond the original July deadline, which gave European markets a boost. Trade headlines thus oscillated between progress and new threats.

In domestic politics, Congress advanced a sweeping package dubbed the “One Big Beautiful Bill.” In late June, the Senate moved forward with this bill, which aims to make the 2017 tax cuts permanent (locking in lower individual tax rates) and increase spending on border security, defense, and energy. To offset costs, certain social programs face cuts. The bill also proposes raising the debt ceiling by 5 trillion dollars (versus 4 trillion in a House version) to ensure the government’s borrowing needs are met.

While potentially supportive of economic growth (via tax relief and spending), the package could add an estimated 1 to 2 trillion dollars to deficits. Its progress was closely watched by markets, as it signaled the fiscal policy trajectory heading into 2026. Meanwhile, President Trump kept up pressure on the Federal Reserve, publicly urging a 1% rate cut and even musing about replacing Fed Chair Jerome Powell ahead of Powell’s 2026 term end. This unprecedented political pressure on the Fed raised some concerns about central bank independence and added a layer of uncertainty to interest rate expectations.

Geopolitics were front and center in June, impacting various asset classes. In the Middle East, tensions flared between Iran and Israel. Escalating conflict including a U.S. airstrike on Iran’s underground nuclear facilities on June 22 stoked fears of a broader confrontation. In response, oil prices spiked to around 75 dollars per barrel in mid-June on worries about supply disruptions. Fortunately, a cease-fire agreement was reached later in the month, easing those fears. Oil prices retreated to the mid 60s by month-end as the risk premium faded. Global markets, initially jolted by the conflict, rebounded once peace prospects improved.

Separately, U.S.–Canada trade friction briefly grabbed attention: after Canada imposed a digital-services tax on U.S. tech companies, President Trump declared an abrupt halt to trade talks and threatened retaliatory tariffs on Canada within a week. Although this Canada spat injected midday volatility, it did not escalate further by month’s close. Overall, June saw high-stakes geopolitical events from Middle East clashes to trade spats that caused short-term market swings but appeared to de-escalate by the end of the month.

Equity Markets Performance

Despite early-June volatility, U.S. equities powered higher in June. The S&P 500 and Nasdaq Composite hit new all-time closing highs by the end of the month. On June 27, both indices notched record closes (the S&P’s first since February, Nasdaq’s first since last December). The Dow Jones Industrial Average also climbed, aided by strong earnings in certain components (e.g. Nike’s surge).

Major indexes posted robust gains for a second straight month, with the S&P 500 up roughly 5% in June and about 11% for Q2, while the tech-heavy Nasdaq jumped about 18% over the quarter, capping its best quarter since 2023. In fact, Wall Street ended the first half of 2025 at record-high levels, recovering sharply from an April pullback.

Market leadership in June tilted towards technology and growth stocks. After a choppy start to 2025, the big “Magnificent Seven” mega-cap tech companies (like Apple, Amazon, Microsoft, Google, Meta, Nvidia, and Tesla) resumed driving the market higher, especially in Q2. The S&P 500’s information technology sector was the top performer, and investor enthusiasm around AI (artificial intelligence) and other innovations propelled names like Nvidia to new heights (Nvidia’s market cap even briefly surpassed all other companies). This narrow leadership sparked some concern, but there were signs of broadening: even the equal-weighted S&P 500 (which downplays mega-caps) was up nearly 4% year to date by early July.

Other sectors also participated in the rally. For example, industrials and cyclicals saw gains as trade news improved, and consumer discretionary got a boost from cooling inflation and wages. That said, defensive sectors (like consumer staples and utilities) lagged during risk-on episodes. Investor sentiment improved markedly compared to the spring, and volatility (VIX) stayed relatively subdued (in the teens), reflecting confidence that the economic “soft landing” might be in sight.

June’s rally was not confined to the U.S. Global equities climbed as well. Developed international stocks outperformed, with the MSCI EAFE index (Europe, Australasia, Far East) up about 11.8% for Q2. Emerging markets gained nearly 12% over the quarter, aided by easing geopolitical tensions and a pullback in the U.S. dollar (which boosts non-U.S. assets). Notably, European indices hit multi-year highs. For instance, optimism over a delayed EU–U.S. tariff helped lift European industrial and auto stocks. In the UK, a major corporate M&A rumor (oil giant Shell reportedly in talks to acquire rival BP) sent BP’s stock nearly 10% higher in late June, highlighting a potential consolidation in the energy sector.

Asian markets were mixed. Chinese stocks struggled amid soft economic data, whereas Japan’s Nikkei continued its strong 2025 run (buoyed by corporate reforms and yen weakness). Overall, equities globally shrugged off many of the prior quarter’s risks, ending June with strong gains across most regions.

Bond markets were relatively stable in June. U.S. Treasury yields oscillated with data and Fed expectations. The 10-year yield hovered around the mid 3% range, dipping slightly after tame CPI data and the Fed’s hold (reflecting hopes for possible rate cuts). Credit spreads narrowed a bit as investor risk appetite improved.

In commodities, oil was the standout mover due to the Middle East turmoil. Crude oil (WTI) surged into the mid 70s per barrel at the height of Iran-Israel tensions, then fell back to approximately 65 dollars as the situation calmed. Gold, often a safe haven, remained elevated. In fact, gold has quietly had a stellar year to date gain (approximately 26% in 2025 so far), reflecting earlier inflation hedging and perhaps some residual geopolitical worry.

Industrial metals like copper saw modest gains in June on hopes of Chinese stimulus, while agricultural commodities were mixed. Meanwhile, the U.S. dollar eased slightly in June against major currencies, partly due to reduced Fed hawkishness and improved trade outlook. This dollar softening provided an extra tailwind to commodity prices and emerging markets.

Notable Corporate Earnings and Stock Moves

Several major companies reported earnings or had significant stock moves in June, influencing sector swings and indices:

Tesla (TSLA): Tesla’s stock plunged approximately 14% in a single day (June 5) after CEO Elon Musk engaged in a very public spat with President Trump. The multi-hour tirade between Musk and Trump, which included Musk claiming Trump “would have lost” without him, and Trump calling Musk “crazy” and threatening to cut off government contracts, rattled investors. Tesla’s market value tumbled by approximately 150 billion dollars, knocking the company out of the trillion dollar market cap club. This high-profile feud contributed to a broader market dip in early June, underscoring how political risk can impact individual stocks. Notably, Tesla shares were already down approximately 20% year to date at that point, amid softening EV demand in key markets.

Nike (NKE): The athletic apparel giant delivered stellar earnings, sparking a big stock jump. Nike reported quarterly results in late June that beat Wall Street expectations, and importantly, management detailed plans to mitigate the impact of tariffs on its supply chain. Shares of Nike surged about 15% on the news, their biggest one-day gain in years, making Nike the top gainer in the Dow and S&P 500 that day. This strong performance in a consumer-facing stock boosted confidence that U.S. consumer demand remains healthy despite trade headwinds.

Nvidia (NVDA): The semiconductor and AI powerhouse extended its remarkable 2025 rally. Nvidia’s stock jumped around 4% to reach new record highs during June, at one point briefly becoming the world’s most valuable company by market cap. Investors piled in due to Nvidia’s leadership in AI chips and robust earnings. By late June, Nvidia’s year to date gain was enormous, and its one-day surge helped it reclaim the title of largest market cap globally. This underscores how AI excitement has made Nvidia a centerpiece of the market’s momentum.

Boeing (BA): Aerospace stocks got a lift from improving trade sentiment. Boeing’s share price climbed approximately 6% in mid-June after a U.S.–China trade framework was announced and analysts at Rothschild upgraded the stock to “Buy.” The upgrade cited accelerating aircraft production and better financial trends for the aviation giant. Since Boeing is a major exporter, progress on U.S.–China trade negotiations (and the delay of tariffs on EU goods, including aerospace) buoyed its outlook. Boeing’s rebound contributed to industrial sector strength and was a positive signal for the air travel and manufacturing outlook.

FedEx (FDX): The delivery and logistics bellwether had mixed news. FedEx announced fiscal Q4 earnings in late June that beat profit estimates, but it simultaneously issued disappointing guidance and suspended its full-year outlook due to economic uncertainty. The cautious forward outlook, after FedEx had already cut forecasts multiple times, spooked investors. FedEx shares fell over 5% in response, continuing a downtrend. FedEx stock was approximately 18% down in 2025 to date. As a global shipper, FedEx is seen as an economic barometer, so its hesitation on guidance fueled some worries about cooling demand in industrial and e-commerce sectors. The stock’s drop also weighed on transportation indices.

Coinbase (COIN): The cryptocurrency exchange operator saw its stock skyrocket in late June, reflecting the resurgence of crypto markets. Coinbase shares jumped nearly 12% in one session and over 40% for June as a whole. The rally was fueled by Bitcoin’s climb to record highs (driving trading activity) and a bullish analyst call from Bernstein, which gave a big price target upgrade. After a tough first half, Coinbase benefited from improving sentiment in digital assets and potentially greater regulatory clarity on crypto in the U.S. The stock’s surge made it one of the top S&P 500 gainers late in the month.

BP (BP) and Energy M&A: In the oil sector, BP PLC (British Petroleum) saw U.S.-listed shares leap almost 10% on reports that peer Shell was in talks to acquire it. Such a megamerger rumor between two of Europe’s largest oil supermajors was significant. It suggested confidence in the energy market’s outlook and potential industry consolidation. While neither company confirmed a deal in June, the news drove BP’s stock sharply higher and lifted energy ETFs. It also sparked debate on antitrust and strategic implications of a Shell-BP combination. Energy stocks overall were volatile due to oil price swings, but this M&A chatter provided a late-month jolt to the sector.

Palantir (PLTR): Data analytics and defense-tech firm Palantir continued its hot streak as an unlikely AI play. PLTR shares hit a fresh all-time intraday high (approximately 148 dollars) during June and were up roughly 90% year to date. Investors have bid up Palantir on optimism about its government contracts (especially given geopolitical tensions) and its pivot into AI-driven software. The stock did pull back slightly on days when geopolitical risks eased (since a chunk of its business relates to defense), but overall Palantir’s momentum underscored the market’s appetite for anything AI or defense-related. Its huge year to date gain made it one of 2025’s best performers so far, albeit with elevated volatility.

Other notable moves: Enphase Energy (ENPH), a solar technology firm, saw seesaw action. It spiked double-digits mid-month on hopes that Congress’s budget would preserve solar tax credits, then fell approximately 5% the next day as those hopes moderated. General Mills (GIS) slipped after missing sales expectations, highlighting consumer staples headwinds. Mega-cap Apple (AAPL) quietly made some gains by late June, though it was more subdued than its peers, finishing the month roughly flat as investors rotated into more “exciting” tech names.

Bitcoin and Ethereum

June 2025 was a milestone month for Bitcoin. The largest cryptocurrency’s price climbed to unprecedented highs, breaching the 100,000 dollar level and closing the month around 107,000 dollars, its highest monthly close ever. In fact, on June 30 Bitcoin traded as high as approximately 108,000 dollars. This rally was fueled by strong institutional inflows. U.S. spot Bitcoin ETFs attracted over 4 billion dollars of net inflows during June, as large investors poured money into bitcoin-backed funds.

BlackRock’s Bitcoin ETF saw record weekly volumes, and overall there were more than 15 consecutive days of inflows into bitcoin ETFs by month-end. This surge of institutional demand provided a firm price floor for BTC. Additionally, a risk-on mood in markets and hopes for regulatory clarity boosted crypto sentiment. By end of June, Bitcoin was up roughly 13% for 2025 year to date, and its total market cap reached about 2.1 trillion dollars, making BTC as large as some of the biggest publicly traded companies.

In contrast, Ethereum (ETH), the second-largest crypto, underperformed in June. Ether’s price fluctuated in the mid 2,000s (around 2,400 dollars at month-end), and it actually declined slightly over the month even as Bitcoin rose. For the first half of 2025, ETH was down over 20%, a stark divergence from Bitcoin’s gains. Several factors explain this lag. Investors are prioritizing Bitcoin due to the ETF-driven rally and its perception as “digital gold,” while regulatory approval for an Ethereum ETF or major institutional product was still lacking.

That said, Ethereum isn’t stagnant. June saw about 1.1 billion dollars of inflows into ETH-based products, including one notable allocation shift by BlackRock from BTC to ETH. Yet Ethereum’s network metrics (such as DeFi activity and NFT volumes) remained tepid, and many altcoins underperformed as Bitcoin dominance rose to approximately 65% of the crypto market. In short, Bitcoin took the spotlight in June’s crypto rally, while Ethereum and others lagged, causing the crypto market’s leadership to narrow.

Crypto markets remained volatile and sensitive to news in June. Mid-month, the Israel-Iran conflict and U.S. strikes in the Middle East triggered a global risk-off move that knocked Bitcoin briefly below 99,000 dollars over a weekend. That dip (over 10% intraday) led to large liquidations of leveraged positions. However, as geopolitical tensions eased with a cease-fire, Bitcoin rebounded swiftly back above 100,000 dollars, demonstrating its resilience. Each pullback was met with institutional buying. ETFs saw their largest single-day inflow of nearly 1 billion dollars during the mid-June dip.

Apart from geopolitics, the crypto space saw positive developments. U.S. regulators continued reviewing multiple spot Bitcoin ETF applications with increasing market optimism for approvals, and some major traditional finance firms hinted at crypto initiatives. There were also technical milestones, such as Ethereum’s network upgrades proceeding quietly in the background. Overall, crypto sentiment improved markedly in June, with Bitcoin’s new highs marking a sense of renewed confidence in digital assets after a shaky start to the year.

Concluding Thoughts

June 2025 was marked by strong equity performance, a cooling macro backdrop, and easing geopolitical tensions. The Fed held interest rates steady while signaling potential cuts later this year, as inflation moderated and labor market strength softened slightly. Political noise from trade tensions and Middle East conflict created short-term volatility, but markets shook it off, with the S&P 500 and Nasdaq hitting record highs, driven by renewed AI enthusiasm and strong earnings from names like Nvidia and Nike.

Bitcoin surged past $100,000 on ETF inflows and institutional adoption, while Ethereum lagged behind. Commodities like oil spiked temporarily on geopolitical risk but faded later, while gold remained strong as a hedge. Global equities joined the rally, aided by a weaker dollar and signs of global economic resilience.

Based on current conditions, investors should maintain a bullish stance on U.S. equities, particularly in sectors such as technology, artificial intelligence, and semiconductors, where companies like Nvidia and Palantir continue to lead. However, it is important to stay alert to any signs of exhaustion or overextension in the mega-cap rally. Defensive sectors like consumer staples and utilities remain under pressure in this risk-on environment and may warrant a reduction in exposure.

For those looking to rotate capital, energy and industrials offer attractive opportunities, especially on market pullbacks, as ongoing trade negotiations and merger activity could continue to support these sectors. In the crypto space, Bitcoin appears to be the clear leader, and investors may consider accumulating positions during periods of weakness, supported by strong institutional demand and sustained ETF inflows. Ethereum and other altcoins, however, continue to lag, and caution is advised until leadership broadens.

A modest allocation to gold remains prudent as a hedge against both geopolitical shocks and rising fiscal risk in the U.S. Looking ahead, Q3 earnings and upcoming economic data should be closely monitored, particularly for early signs that tariffs may be feeding through to inflation or dampening consumer demand. Finally, if the Fed moves toward rate cuts later this year, long-duration Treasuries and high-quality bonds could offer meaningful upside as yields retreat.

In summary, June delivered a textbook “soft landing” narrative. The trend remains up, but selectivity, risk management, and preparation for rotation or volatility spikes are key going forward.