Thumbnail What is the CPI Consumer Price Index

Recently, one of the hottest economic indicator is the Consumer Price Index (CPI), and it has been one of major maker movers, but what exactly does it tell us?

Released once a month, it measures the average change in prices of a basket of goods and services consumed by consumers, providing insight into inflation and the cost of living.

It is widely followed by economists, investors, and policy makers and can have a significant impact on financial markets.

In this blog post, we will delve into the origin, calculation, and key numbers of the CPI report, and explain how this data is relevant to you as a trader or investor.

We’ll also explore how traders and investors use the information from the CPI to make their investment decisions.


Infographic What is the CPI Consumer Price Index and How to Trade it


What is the CPI and its Origin?

The Consumer Price Index (CPI) is a measure of the average change over time in the prices paid by consumers for a basket of goods and services.

It is used to calculate the inflation rate, which is the rate at which the general level of prices for goods and services is rising and thus purchasing power is falling.

The CPI is used by governments, central banks, and economists to make informed decisions.

The origin of the Consumer Price Index can be traced back to the late 19th century, when the US Bureau of Labor Statistics (BLS) began collecting data on the prices of goods and services.

The BLS was officially tasked with calculating the CPI in 1918, and the first official US CPI was published in 1919.

Today, the CPI is used in many countries as a measure of inflation and is widely used as an indicator of changes in purchasing power and the cost of living.

How is the Data Calculated?

The Consumer Price Index (CPI) is calculated using a statistical survey that collects data on the prices of a representative basket of goods and services purchased by consumers.

The basket of goods and services is based on the expenditures of a typical consumer, and is designed to represent the purchasing patterns of the general population.

The prices of the goods and services in the basket are collected at regular intervals, usually monthly or quarterly, from a sample of retail outlets, service providers, and rental markets.

The data collected on prices is used to calculate the average change in prices for the basket of goods and services over time.

This average change is then used to calculate the inflation rate, which is the percentage change in the CPI over a specific time period.

The inflation rate provides an indication of how much the cost of living has increased, and how much the purchasing power of consumers has declined.

The calculation of the CPI involves several steps, including:

  • Selection of goods and services: A basket of goods and services is selected to represent the typical expenditures of consumers. The basket is updated periodically to reflect changes in consumer spending patterns.
  • Collection of price data: The prices of the goods and services in the basket are collected at regular intervals from a sample of retail outlets, service providers, and rental markets.
  • Weighting of prices: The prices are weighted according to their importance in the overall basket of goods and services. This weighting is based on data on consumer expenditures.
  • Calculation of average prices: The weighted prices of the goods and services in the basket are used to calculate an average price for the basket.
  • Calculation of the inflation rate: The average price for the basket is compared over time to calculate the inflation rate, which is the percentage change in the average price of the basket over a specific time period.

Note that the CPI is just one of many measures of inflation, and there are other methods of calculating inflation, such as the Producer Price Index (PPI) and the Gross Domestic Product Deflator (GDP Deflator).

What are the Key Numbers of the CPI Report?

The Consumer Price Index (CPI) report contains several key numbers that provide information on the changes in the prices of goods and services over time and the level of inflation in an economy.

These key numbers include:

  • The overall Consumer Price Index (CPI): This is the most widely used and well-known number from the CPI report, which measures the average change over time in the prices of a basket of goods and services consumed by consumers.
  • Core Consumer Price Index (CPI): This is the Consumer Price Index excluding the volatile food and energy prices, and provides a more accurate measure of underlying inflation trends in the economy.
  • Inflation rate: This is the percentage change in the Consumer Price Index over a specified time period and indicates the rate at which the cost of living is rising and the purchasing power of consumers is declining.
  • Food and Beverage Index: This measures the average change over time in the prices of food and beverages purchased by consumers.
  • Energy Index: This measures the average change over time in the prices of energy products, such as gasoline, electricity, and heating oil.
  • Housing Index: This measures the average change over time in the prices of housing, including rent, owners’ equivalent rent, and shelter.
  • Transportation Index: This measures the average change over time in the prices of transportation services and goods, such as gasoline, motor vehicle insurance, and public transportation.
  • Medical Care Index: This measures the average change over time in the prices of medical care services and goods, such as hospital services, physician services, and prescription drugs.
  • Apparel Index: This measures the average change over time in the prices of clothing and footwear.

These key numbers provide important information on the overall level of inflation, as well as the specific components of inflation, such as food, energy, housing, transportation, and medical care.

This information can be used by governments, central banks, economists, and businesses to make informed decisions about monetary and fiscal policy, as well as to analyze economic trends and conditions.

How is this Data Relevant to Traders and Investors?

The Consumer Price Index (CPI) is relevant to traders and investors because it provides important information on inflation, which can have a significant impact on financial markets.

Inflation affects the purchasing power of consumers and the value of money, and can have a direct impact on the demand for goods and services, as well as the supply of goods and services.

Inflation can also have an indirect impact on financial markets, as central banks often use monetary policy tools, such as adjusting interest rates, to control inflation.

If inflation is rising too rapidly, central banks may raise interest rates to curb inflation, which can lead to a decrease in consumer spending and economic growth, and can have a negative impact on financial markets.

Conversely, if inflation is too low, central banks may lower interest rates to encourage consumer spending and economic growth, which can have a positive impact on financial markets.

Traders and investors use the Consumer Price Index, as well as other inflation measures, to make informed investment decisions, such as determining the expected direction of interest rates, and adjusting their portfolios accordingly.

They also use inflation data to make predictions about the future direction of financial markets, such as stock markets and bond markets, and to make decisions about the timing and size of their trades.

The Consumer Price Index provides valuable information on the level of inflation in an economy, and is an important tool for traders and investors to monitor and analyze economic trends and conditions, and make informed investment decisions.

News Trading on CPI Data

Traders can use different data points from the Consumer Price Index (CPI) report to make informed trading decisions.

Some specific examples of how traders might use these data points are:

  1. The overall Consumer Price Index (CPI) and the core Consumer Price Index (CPI) excluding food and energy prices: Traders may use the overall and core CPIs to gauge the level of inflation in an economy and to make predictions about the future direction of interest rates. If the overall CPI or core CPI is rising rapidly, it may signal that inflation is becoming a concern, and traders may expect the central bank to raise interest rates, which can have a negative impact on financial markets. On the other hand, if the overall CPI or core CPI is low or declining, traders may expect the central bank to keep interest rates low, which can have a positive impact on financial markets.
  2. Inflation rate: Traders may use the inflation rate to assess the pace of inflation in an economy and to make predictions about future inflation trends. If the inflation rate is high, it may signal that inflation is becoming a concern, and traders may expect the central bank to raise interest rates, which can have a negative impact on financial markets. On the other hand, if the inflation rate is low or declining, traders may expect the central bank to keep interest rates low, which can have a positive impact on financial markets.

These data points from the Consumer Price Index report provide valuable information on the level of inflation in an economy and its components, and traders use this information to make informed trading decisions, such as adjusting their portfolios, predicting the future direction of interest rates, and making decisions about the timing and size of their trades.

Concluding Thoughts

In summary, the Consumer Price Index (CPI) is a critical measure of inflation that can have a significant impact on financial markets.

As a new trader or investor, understanding the origin, calculation, and key numbers of the CPI report is crucial in making informed decisions.

The data provides insights into inflation, purchasing power, and economic trends, which can help you navigate the financial market and make sound investment choices.

Now that I have covered all about the importance of the CPI report, is it something that you will add to your trading toolbox?

Let me know in the comments below.

Thumbnail What is the NFP Non Farm Payroll and How to Trade it

The Non-farm payroll (NFP) is one of the most watched economic indicator by traders and investors, as it provides insight into the health of the US labor market.

Released on the first Friday of each month, the NFP report tracks the change in the number of employees excluding farm employees, government employees, and non-profit organizations.

It is widely followed by economists, investors, and policy makers and can have a significant impact on financial markets.

In this blog post, you’ll learn about the origin of the NFP, how the data is collected and calculated, and what the key numbers in the report mean.

We’ll also explore how traders and investors use the information from the NFP to make their investment decisions.

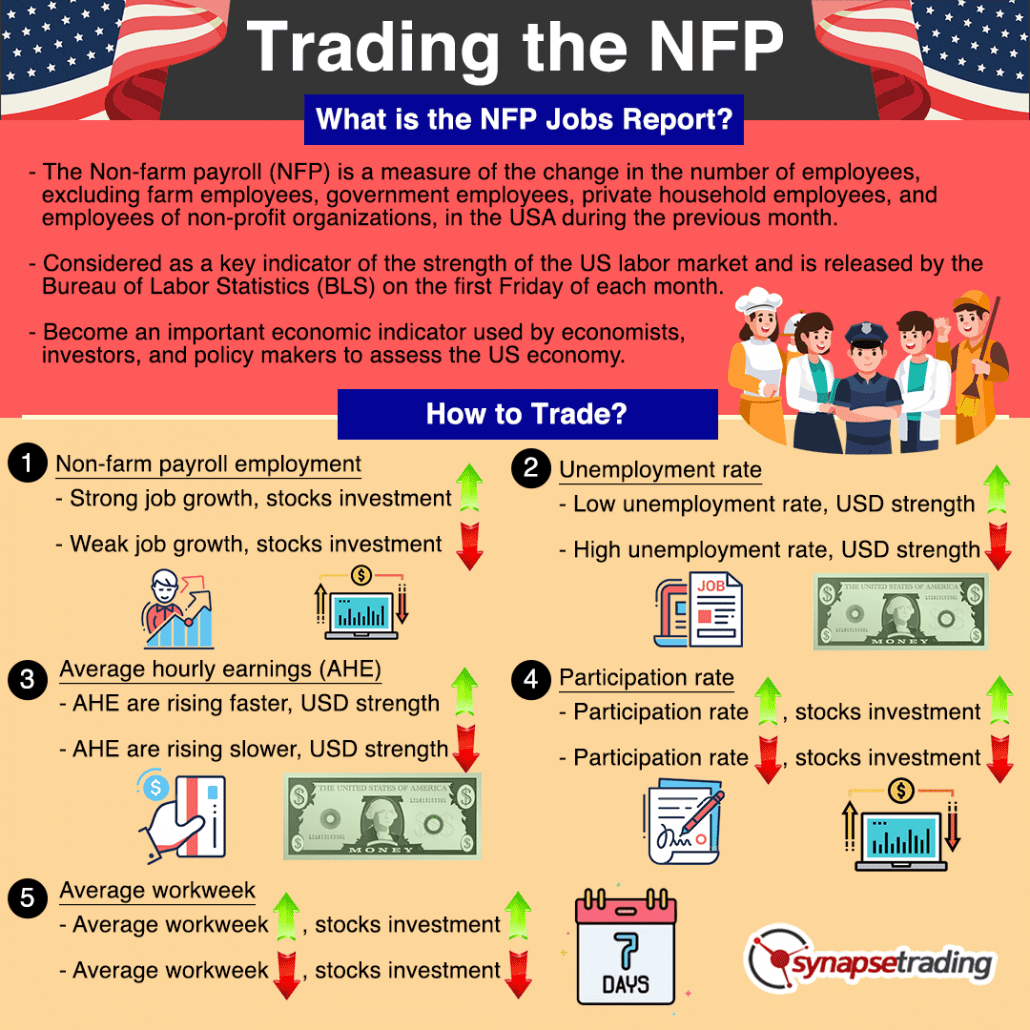
Infographic What is the NFP Non Farm Payroll and How to Trade it


What is the NFP and its Origin?

The Non-farm payroll (NFP) is a measure of the change in the number of employees, excluding farm employees, government employees, private household employees, and employees of non-profit organizations, in the US during the previous month.

It is widely considered as a key indicator of the strength of the US labor market and is released by the Bureau of Labor Statistics (BLS) on the first Friday of each month.

The NFP report has its origin in the early 20th century when the US government started collecting data on employment and labor force characteristics.

The NFP report was established as a regular monthly release in the 1940s and has since become an important economic indicator used by economists, investors, and policy makers to assess the health of the US economy.

How is the Data Calculated?

The NFP data is collected and tabulated by the Bureau of Labor Statistics (BLS), which is a branch of the US Department of Labor.

The BLS uses two surveys to calculate the NFP: the Establishment Survey and the Household Survey.

The Establishment Survey, also known as the payroll survey, collects data from a sample of approximately 141,000 businesses and government agencies and covers roughly one-third of all non-farm employment in the US.

The survey collects data on the number of employees on payrolls and the number of hours worked by each employee.

The Household Survey, also known as the survey of households, collects data from a sample of approximately 60,000 households and covers the remaining two-thirds of non-farm employment in the US.

The survey collects information on the employment status of individuals, including those who are unemployed and looking for work.

The NFP data is calculated as the difference between the total number of employed persons in the Establishment Survey and the Household Survey in the current month compared to the previous month.

The NFP data is seasonally adjusted to account for regular patterns in the labor market, such as seasonal hiring during the holidays.

What are the Key Numbers of the NFP Report?

The Non-farm payroll (NFP) report released by the Bureau of Labor Statistics (BLS) contains a number of important data points that traders and investors pay attention to:

  1. Non-farm payroll employment: This is the main number in the NFP report and is a measure of the change in the number of non-farm jobs in the US during the previous month. A positive number indicates job growth, while a negative number indicates job losses.
  2. Unemployment rate: This is the percentage of the labor force that is unemployed but actively seeking work. A lower unemployment rate is typically seen as a sign of a strong labor market, while a higher unemployment rate is seen as a sign of weakness.
  3. Average hourly earnings: This measures the average pay per hour of all non-farm employees and is an important indicator of wage growth and inflationary pressures. A significant increase in average hourly earnings can signal an increase in inflation, which can lead to higher interest rates and a stronger US dollar.
  4. Participation rate: This is the percentage of the civilian non-institutionalized population that is either employed or actively seeking work. A lower participation rate can indicate a lack of job opportunities, while a higher participation rate can indicate a strong labor market.
  5. Average workweek: This measures the average number of hours worked per week by all non-farm employees. A decrease in the average workweek can indicate a slowdown in economic activity, while an increase can signal economic strength.

Each of these data points provides valuable information about the state of the US labor market and economy and traders and investors often pay close attention to them when making investment decisions.

However, the relative importance of each number will vary depending on the current economic conditions and the outlook for future growth.

How is this Data Relevant to Traders and Investors?

The NFP data is relevant to traders and investors because it provides valuable information about the state of the US labor market and the overall economy.

A strong NFP report, meaning an increase in the number of non-farm payroll jobs, is often seen as a positive sign of a growing economy and can lead to increased demand for stocks and a stronger US dollar.

On the other hand, a weak NFP report, meaning a decrease in the number of non-farm payroll jobs, is often seen as a negative sign of a slowing economy and can lead to decreased demand for stocks and a weaker US dollar.

Traders and investors pay close attention to the NFP data and may adjust their portfolios in response to the report.

For example, if the NFP report shows strong job growth, traders and investors may increase their investments in stocks, while if the report shows weak job growth, they may decrease their investments in stocks and instead invest in safer assets such as bonds.

In addition to the overall level of job growth, traders and investors also pay attention to other details in the NFP report, such as the average hourly earnings and the unemployment rate.

These data points can provide further insight into the health of the US economy and the direction of future monetary policy, which can also have an impact on financial markets.

News Trading on NFP Data

Here are specific examples of how traders might use each of the data points from the NFP report to make trading decisions:

  1. Non-farm payroll employment: Traders might use the non-farm payroll employment number to assess the overall health of the US labor market and economy. For example, if the NFP report shows strong job growth, traders might see this as a positive sign and increase their investments in stocks, as a growing economy is generally seen as supportive of corporate profits. On the other hand, if the NFP report shows weak job growth, traders might decrease their investments in stocks and look for safer assets such as bonds.
  2. Unemployment rate: Traders might use the unemployment rate to assess the strength of the labor market and the potential for future interest rate changes. For example, if the unemployment rate is low and declining, traders might expect the Federal Reserve to raise interest rates in order to keep inflation in check. This could lead to a stronger US dollar and a decrease in demand for riskier assets such as stocks.
  3. Average hourly earnings: Traders might use the average hourly earnings data to assess inflationary pressures and the potential for future interest rate changes. For example, if the average hourly earnings are rising faster than expected, traders might expect the Federal Reserve to raise interest rates to combat inflation. This could lead to a stronger US dollar and a decrease in demand for riskier assets such as stocks.
  4. Participation rate: Traders might use the participation rate to assess the health of the labor market and the potential for future economic growth. For example, if the participation rate is declining, traders might see this as a sign of a weak labor market and decrease their investments in stocks. On the other hand, if the participation rate is increasing, traders might see this as a sign of a strong labor market and increase their investments in stocks.
  5. Average workweek: Traders might use the average workweek data to assess the potential for future economic growth. For example, if the average workweek is increasing, traders might see this as a sign of a strong economy and increase their investments in stocks. On the other hand, if the average workweek is declining, traders might see this as a sign of a weak economy and decrease their investments in stocks.

It’s important to note that these examples are general and that traders might also consider other factors, such as broader economic and market conditions, when making investment decisions.

Additionally, the impact of NFP data on financial markets can vary depending on expectations and the magnitude of the surprise in the report.

Concluding Thoughts

In summary, the Non-farm payroll (NFP) report provides valuable information about the state of the US labor market and by extension, the overall economy.

Whether you’re a seasoned trader or just starting out, understanding the NFP is crucial to making informed investment decisions.

Traders and investors pay close attention to the NFP data, including the non-farm payroll employment, unemployment rate, average hourly earnings, participation rate, and average workweek, and adjust their portfolios in response to the report.

Now that I have covered all about the importance of the NFP report, is it something that you will add to your trading toolbox?

Let me know in the comments below.

Thumbnail What is the FOMC Federal Open Market Committee Meeting and How to Trade it

One of the most important piece of news data for traders and investors is the FOMC meeting, so you probably have heard it many times on the news.

But what exactly do they discuss, and why is it so important?

The Federal Open Market Committee, or FOMC, is a powerful branch of the Federal Reserve System that plays a crucial role in shaping the U.S economy.

In this blog post, you’ll learn about the origin and responsibilities of the FOMC, how it operates, and how its decisions can impact traders and investors.

We’ll also explore how traders and investors use the information from the FOMC to make their investment decisions.


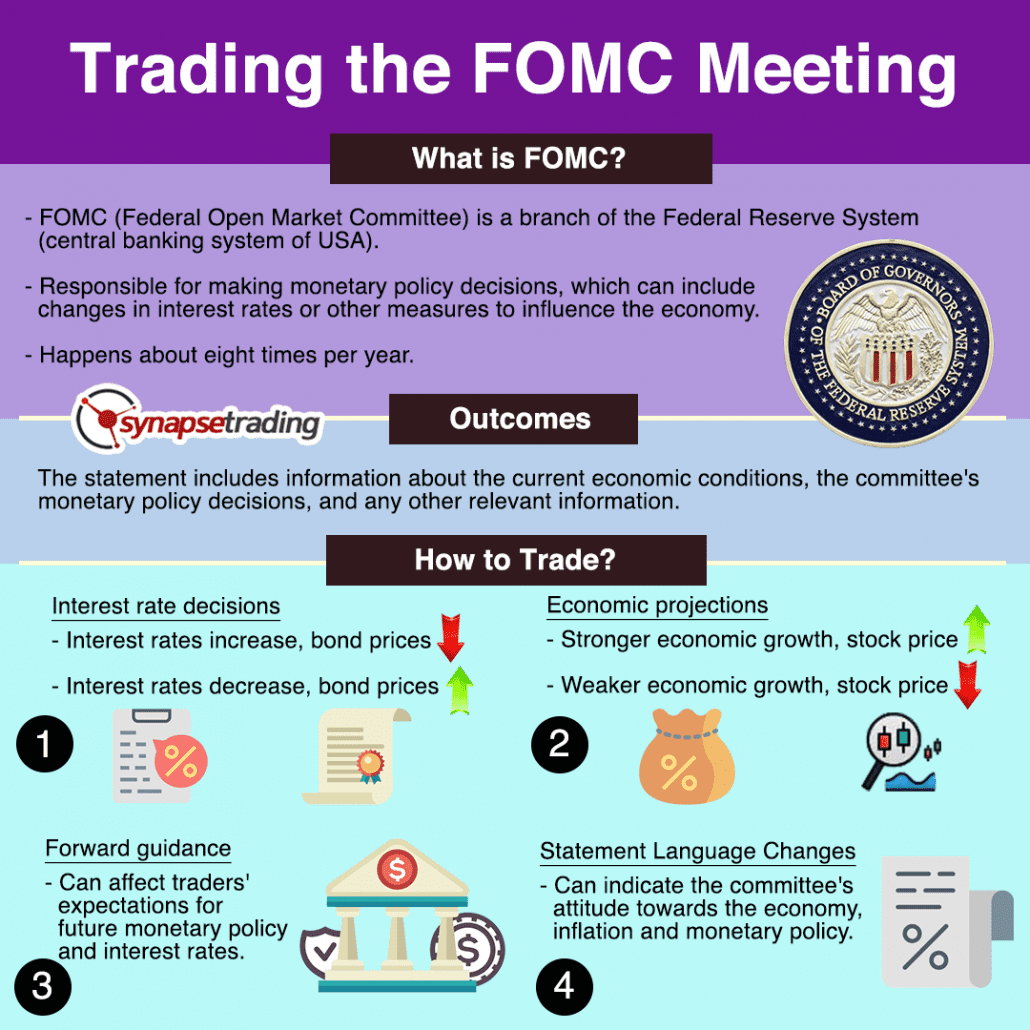
Infographic What is the FOMC Federal Open Market Committee Meeting and How to Trade it

What is the FOMC and its Origin?

The FOMC is a branch of the Federal Reserve System, which is the central banking system of the United States.

The FOMC was created by the Banking Act of 1935, which also created the Federal Reserve System.

The FOMC is responsible for making monetary policy decisions, which can include changes in interest rates or other measures to influence the economy.

The FOMC is made up of 12 voting members, including the seven members of the Board of Governors of the Federal Reserve System and five of the 12 Federal Reserve Bank presidents.

The Board of Governors is appointed by the President of the United States, subject to Senate confirmation, and serves for a 14-year term.

The five Reserve Bank presidents who serve on the FOMC are chosen by their respective Reserve Banks and serve one-year terms.

How Does the FOMC Operate?

The Federal Open Market Committee (FOMC) typically meets eight times per year, with meetings held about every six weeks.

Meetings are held on a schedule that is set well in advance.

The schedule of meetings can be found on the Federal Reserve’s website.

The meetings are held in Washington, D.C. and typically last two days.

What are the Outcomes of FOMC Meetings?

The outcomes of Federal Open Market Committee (FOMC) meetings are typically published in a statement released after the meeting.

The statement includes information about the current economic conditions, the committee’s monetary policy decisions, and any other relevant information.

The statement is closely watched by investors and market participants, as it provides insight into the committee’s thinking and can affect financial markets.

The FOMC statement typically includes the following information:

  • The current target range for the federal funds rate (the interest rate at which banks lend money to each other overnight)
  • The outcome of the vote, including any dissents
  • Economic projections, including the expected path of interest rates, GDP, unemployment rate, and inflation
  • An assessment of the current economic conditions and the balance of risks
  • Any other relevant information, such as changes to the statement language or the forward guidance.

The data published in the FOMC statement is not revised or updated after the meeting, but the committee releases new economic projections and updates the statement language at each meeting.

The committee also releases the minutes of the meeting three weeks after the meeting which provides more detailed information about the discussions and the reasoning behind the decisions.

How is this Data Relevant to Traders and Investors?

The data and information published by the FOMC is closely watched by traders and investors, as it provides insight into the committee’s thinking and can affect financial markets.

The statement and the economic projections released after the FOMC meetings can affect the direction of interest rates, and in turn, the value of stocks, bonds, and other financial assets.

Traders and investors typically use the information from the FOMC statements and economic projections to inform their investment decisions.

They pay attention to the current target range for the federal funds rate and any changes to it, as changes in interest rates can affect the value of bonds and other fixed-income securities.

They also pay attention to the economic projections, as they can provide insight into the committee’s view on the future performance of the economy and can affect the direction of stocks and other riskier assets.

For example, if the FOMC projects that the economy will perform well in the future, traders and investors may be more likely to invest in stocks, as they expect the market to perform well.

On the other hand, if the FOMC projects that the economy will perform poorly, traders and investors may be more likely to invest in bonds, as they expect the market to be more stable.

Traders and investors also pay attention to the forward guidance provided by the FOMC, as it can affect the expectations of future monetary policy.

For example, if the FOMC states that it expects to keep interest rates low for an extended period, traders and investors may be more likely to invest in stocks, as they expect the market to perform well in the short-term.

On the other hand, if the FOMC states that it expects to raise interest rates soon, traders and investors may be more likely to invest in bonds, as they expect the market to be more stable in the short-term.

News Trading on FOMC Data

Traders use the information from the Federal Open Market Committee (FOMC) meetings and statements to make trading decisions in a variety of ways.

Here are a few examples:

  1. Interest rate decisions: If the FOMC raises interest rates, it can lead to higher bond yields, which can cause bond prices to fall. Similarly, if the FOMC lowers interest rates, bond prices may rise and traders may adjust their positions accordingly.
  2. Economic projections: If the FOMC’s economic projections indicate stronger-than-expected economic growth, traders may anticipate that this could lead to higher stock prices. Conversely, if the FOMC’s projections indicate weaker-than-expected economic growth, traders may anticipate that this could lead to lower stock prices.
  3. Forward guidance: If the FOMC changes its forward guidance, this can affect traders’ expectations for future monetary policy and interest rates. For example, if the FOMC signals that it plans to raise interest rates in the near future, traders may anticipate that this will cause bond prices to fall.
  4. Statement Language Changes: FOMC statement language changes can indicate the committee’s attitude towards the economy, inflation and monetary policy. Traders can use this information to make predictions about the future direction of interest rates, GDP, unemployment rate, and inflation, which can help them to make trading decisions.

Concluding Thoughts

In summary, the FOMC is a vital component of the Federal Reserve System that is responsible for making monetary policy decisions.

These decisions can have a significant impact on financial markets, making it essential for traders and investors to stay informed about the FOMC’s actions.

Whether you’re new to the world of finance or a seasoned professional, understanding the FOMC is crucial to making informed investment decisions.

Now that I have covered all about the importance of the FOMC meeting, is it something that you will add to your trading toolbox?

Let me know in the comments below.

Thumbnail How to Profit from Inflation

Thumbnail How to Profit from Inflation


Wondering what the deal is with inflation and how it affects the economy?

No worries, we’ve got you covered.

Inflation is when the overall price of stuff goes up over time, which means the same amount of money can buy less.

There are a few things that can cause it, like more demand for stuff, higher production costs, or more money being available.

In this blog post we’ll talk about the different types of inflation, how it can affect the economy, and some ways you might be able to profit from it.


What in Inflation?

Inflation is when the overall price of stuff goes up over time, which means the same amount of money can buy less.

For example, if inflation has driven up the price of everything, that means the same amount of cash is now worth less because it can buy fewer things.

There are a few things that can cause inflation, like more demand for stuff, higher production costs, or more money being available. Inflation can also happen when there’s less stuff available, like during a recession or war.

To measure inflation, we use something called the consumer price index (CPI), which tracks the prices of a bunch of things that households usually buy.

The CPI helps us calculate the rate of inflation, which is the percentage change in price over a certain period of time.

The Federal Reserve (the central bank in the US) uses the rate of inflation as part of its decision-making for monetary policy.

There are different types of inflation, like demand-pull (more demand than supply), cost-push (higher production costs), and structural (problems in the economy like using resources poorly or not having enough stuff).

Impact of Inflation

Inflation can have both good and bad effects on an economy.

On the plus side, it can boost economic growth by encouraging people to spend and invest more, since they might want to buy things before prices go up even more.

Inflation can also make debt less of a burden, since the value of the debt decreases over time due to the decrease in purchasing power of the currency.

On the downside, inflation can create uncertainty and instability, since people might be hesitant to make long-term financial plans because of how hard it is to predict.

Inflation can also disproportionately affect certain groups, like people with low incomes or fixed incomes, who might not be able to handle price increases as easily.

To manage inflation, we use monetary policy, which is when we control the supply of money and credit in an economy.

Central banks, like the Federal Reserve, can use things like interest rates, reserve requirements, and open market operations to influence the supply of money and credit in order to keep prices stable.

How to Profit from Inflation

There are a few ways you might be able to profit from inflation:

  1. Cash: While cash may not provide a high return, it can be a good way to preserve purchasing power during times of inflation. It’s important to keep in mind that the value of cash may be eroded over time by inflation, so it may be necessary to periodically reevaluate the amount of cash you hold in your portfolio.
  2. High-yield savings accounts: High-yield savings accounts are savings accounts that offer a higher interest rate than traditional savings accounts. While the returns on these accounts may not be sufficient to fully offset the impact of inflation, they may provide a way to preserve the purchasing power of your savings.
  3. Fixed deposits: Fixed deposits, also known as term deposits, are a type of investment product offered by banks and other financial institutions. They are characterized by a fixed term and a fixed interest rate, and are often considered to be a low-risk investment option.
  4. Stocks (general): While stocks can be volatile in the short term, they have historically provided good returns over the long run, including during times of inflation. Companies may benefit from inflation because they can pass on higher costs to consumers in the form of higher prices.
  5. Small cap stocks: Small cap stocks, which are stocks of smaller, less established companies, may be more sensitive to changes in the economy and may outperform larger cap stocks during times of inflation.
  6. Emerging market stocks: Stocks of companies in emerging markets, such as China and India, may be a good choice during times of inflation because these markets may be less affected by rising costs.
  7. High dividend-yielding stocks: Stocks that pay a high dividend yield may provide a steady stream of income that can help to offset the impact of inflation on purchasing power.
  8. Infrastructure stocks: Companies that own and operate infrastructure assets, such as utilities and transportation companies, may benefit from inflation because they can pass on higher costs to consumers in the form of higher prices.
  9. Natural resource stocks: Companies that own and operate natural resources, such as oil, gas, and mining companies, may benefit from inflation because the demand for their products tends to remain stable and because they can pass on higher costs to consumers in the form of higher prices.
  10. International stocks: Stocks of companies based in other countries may be a good choice during times of inflation because they may be less affected by rising costs in the domestic economy. However, it’s important to be aware of the potential risks associated with investing in international stocks, such as currency risk and political instability.
  11. Preferred stocks: Preferred stocks are stocks that pay a fixed dividend and have priority over common stock in the event that a company goes bankrupt or is liquidated. Preferred stocks may provide a steady stream of income and may be less affected by inflation compared to common stocks.
  12. Real estate: Real estate can be a good hedge against inflation because the value of property tends to increase over time. As the cost of living goes up, the value of real estate may also appreciate.
  13. Agricultural land: Agricultural land can be a good hedge against inflation because the value of land tends to increase over time and because the demand for food typically remains stable even during times of economic uncertainty.
  14. Timberland: Timberland can be a good investment during times of inflation because the demand for wood products tends to remain stable and because the value of timberland can appreciate over time.
  15. Infrastructure bonds: Infrastructure bonds are bonds issued by companies or governments that fund infrastructure projects, such as the construction of roads, bridges, and airports. These bonds may provide a steady stream of income and may benefit from inflation because the value of the underlying assets may appreciate over time.
  16. Floating rate bonds/notes: Floating rate bonds or floating rate notes (FRNs) are bonds that pay a variable interest rate that is tied to a benchmark rate, such as the London Interbank Offered Rate (LIBOR). These bonds may be a good choice during times of inflation because the interest rate adjusts as market rates change, helping to preserve the purchasing power of the bond’s income.
  17. Treasury Inflation-Protected Securities (TIPS): These are bonds issued by the U.S. government that provide a guaranteed return above the rate of inflation.
  18. Inflation-linked bonds: Inflation-linked bonds, also known as linkers, are bonds that provide a return that is linked to the rate of inflation. These bonds may be issued by governments or corporations, and may provide a way to protect against the erosive effects of inflation on the purchasing power of the bond’s income.
  19. Corporate bonds: Corporate bonds are bonds issued by companies to raise capital. While the value of corporate bonds may be affected by inflation, they may also provide a steady stream of income that can help to offset the impact of rising costs. It’s important to carefully consider the creditworthiness of the issuing company and the overall risk of the bond before investing.
  20. Municipal bonds: Municipal bonds are bonds issued by state and local governments to fund public projects. While the value of municipal bonds may be affected by inflation, they may also provide a steady stream of tax-free income that can help to offset the impact of rising costs. It’s important to carefully consider the creditworthiness of the issuing municipality and the overall risk of the bond before investing.
  21. Index funds (general): Index funds are mutual funds or ETFs that track a specific market index, such as the S&P 500. While the value of index funds may be affected by inflation, they may also provide exposure to a diverse range of assets and may be a good choice for long-term investors.
  22. Real asset funds: Real asset funds are mutual funds or ETFs that invest in physical assets, such as real estate, commodities, and infrastructure. These funds may provide a hedge against inflation because the value of the underlying assets may appreciate over time.
  23. Balanced funds: Balanced funds are mutual funds or ETFs that invest in a mix of stocks, bonds, and other assets, with the goal of providing a balance of growth and income. These funds may be a good choice during times of inflation because they provide diversification and may be less affected by rising costs.
  24. Infrastructure funds: Infrastructure funds are mutual funds or exchange-traded funds (ETFs) that invest in infrastructure assets, such as utilities, transportation companies, and infrastructure bonds. These funds may provide a steady stream of income and may benefit from inflation because the value of the underlying assets may appreciate over time.
  25. Commodity funds: Commodity mutual funds or ETFs invest in a basket of commodities, such as gold, oil, and agricultural products. These ETFs may provide a hedge against inflation because the prices of commodities tend to rise when the cost of living increases.
  26. Real estate investment trusts (REITs): REITs are companies that own and operate real estate assets, such as commercial and residential properties. REITs may provide a steady stream of income and may benefit from inflation because the value of real estate tends to increase over time.
  27. Floating rate loan funds: Floating rate loan funds are mutual funds or ETFs that invest in floating rate loans, which are loans that pay a variable interest rate that is tied to a benchmark rate, such as the LIBOR. These funds may provide a steady stream of income and may be less affected by inflation because the interest rate adjusts as market rates change.
  28. Municipal bond funds: Municipal bond funds are mutual funds or ETFs that invest in a basket of municipal bonds, which are bonds issued by state and local governments to fund public projects. These funds may provide a steady stream of tax-free income and may be less affected by inflation compared to other types of bonds.
  29. Collectible assets: Certain collectible assets, such as art, antiques, and rare coins, can appreciate in value over time, especially during times of inflation when the cost of living is rising. However, it’s important to be aware that the value of collectibles can be difficult to predict and can be subject to significant fluctuations.
  30. Alternative investments: Alternative investments, such as hedge funds and private equity, may offer the potential for higher returns compared to more traditional investments, and may be less affected by inflation. However, it’s important to be aware that alternative investments are typically less liquid and more risky than traditional investments, and may not be suitable for all investors.
  31. Cryptocurrencies: Some investors believe that cryptocurrencies, such as Bitcoin, can be a good investment during times of inflation because their value is not tied to traditional fiat currencies, which can lose value as the cost of living increases.
  32. Commodities: Commodities such as gold, oil, and agricultural products can be a good hedge against inflation because their prices tend to rise when the cost of living increases.
  33. Master limited partnerships (MLPs): MLPs are companies that own and operate assets in the energy sector, such as pipelines and oil and gas wells. MLPs may provide a steady stream of income and may benefit from inflation because the demand for energy tends to remain stable and because they can pass on higher costs to consumers in the form of higher prices.

Concluding Thoughts

Inflation can have both good and bad effects on an economy, and it’s important to be aware of how it might impact your personal finances.

By understanding some ways you might be able to profit from inflation, like holding cash, investing in stocks or infrastructure, or buying inflation-linked bonds, you can take steps to protect the purchasing power of your wealth.

It’s also worth noting that while some strategies may help to minimize the impact of inflation on your purchasing power, they may not necessarily provide a profit.

Just keep in mind that no investment is a sure thing and it’s always important to carefully evaluate the potential risks and rewards before making any financial decisions.

Now that you have learnt all about inflation and all the different ways to profit from it, which assets are you planning to add to your portfolio?

Are there any other types of investments I have missed out?

Let me know in the comments below.