For subscribers of our “Daily Trading Signals”, we now also include a “Weekly Market Report”, where we provide a weekly deep-dive on the market, including fundamentals, technicals, economics, and portfolio management:
Click here for last week’s market report (21 August 2023)
Click here to subscribe for the latest market report (28 August 2023)
Click here to see the archives of all our past market reports
Market Recap & Upcoming Week
Last week witnessed significant developments in the tech industry, particularly surrounding Nvidia. The company, known for its pioneering role in AI technology, had earlier set the stage with an impressive revenue forecast that captured Wall Street’s attention.
With heavyweights like Microsoft and Alphabet backing AI’s potential, Nvidia’s anticipation of its Q2 results became a major focal point. As the tech juggernaut predicted sales of $12.4 billion for the quarter, all eyes were on them to see if they could live up to this forecast amidst challenges like potential GPU shortages and market shifts.
Moreover, the AI-driven surge that Nvidia demonstrated truly paid dividends. They announced a staggering $13.5 billion revenue for the fiscal second quarter, primarily driven by the increasing demand for their latest AI chips. This robust performance not only exceeded expectations but also elevated the firm beyond the coveted $1 trillion valuation threshold.
Their stronghold in the data center space has, however, garnered attention from competitors. Nvidia’s unprecedented success now faces challenges from rivals like Advanced Micro Devices, while tech behemoths like Google and Amazon are considering their own chip solutions.
In the upcoming week, financial enthusiasts should keep a keen eye on the U.S. market landscape, focusing especially on pivotal indicators such as inflation, jobs, and home prices.
Key corporate results from giants such as Pinduoduo, Hewlett Packard, Best Buy, Salesforce, and others will roll out, potentially offering a fresh perspective on market dynamics.
On the data front, the JOLTS report on Tuesday, ADP’s Employment Report on Wednesday, and the significant nonfarm payrolls report on Friday are set to provide insights into the U.S. employment scenario.
Furthermore, with the release of the Case-Shiller National Home Price Index and the BEA’s PCE Price Index, market participants will gain clarity on the housing sector and the inflationary trajectory—two crucial components that heavily influence the Fed’s policy decisions.
Daily Trading Signals (Highlights)
We cover 3 main markets with a total of 200+ counters, so we will never run out of trading opportunities:
- Forex, CFDs, commodities, bonds
- US stocks, ETFs, global stock indices
- Cryptocurrencies, crypto indices
By covering a broad range of markets, we can focus our attention (and capital) on whichever market currently gives the best returns.
Subscribe for real-time alerts and weekly reports:
👉🏻 https://synapsetrading.com/daily-trading-signals

USDSGD – Looks like the trading range is still intact, after prices failed to break out of the range to the upside.

NASDAQ 100 (US100) – The pullback (~9%) might be over, good chance of prices heading to test prior highs.
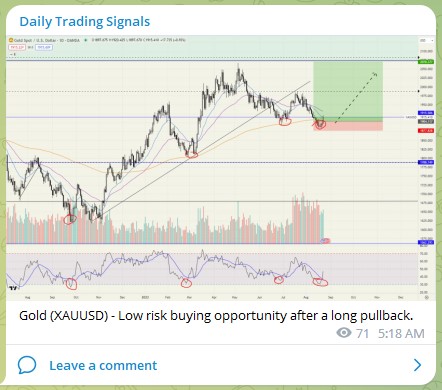
Gold (XAUUSD) – Low risk buying opportunity after a long pullback.

Bitcoin (BTCUSD) – RSI extremely oversold, good chance of a bullish rebound.