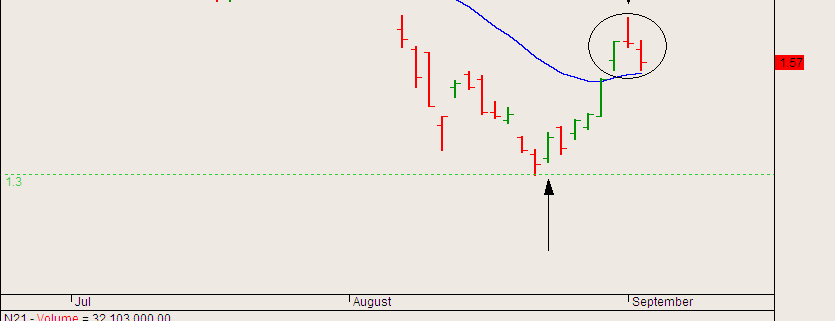
After the rebound for Noble, it is now setting up an evening star pattern, which is a short-term psychological pattern signalling an exit by the smart money. This trade was triggered last Friday, and I am expecting the SG markets to open down tomorrow after the bad news (or rather lack of good news) on the US markets. Since the US markets are closed tomorrow, there will be much apprehension in the SG markets, as evinced by the extremely low volume last Friday. I will be watching for more short opportunities. Good luck trading!
In my previous post, I mentioned that Genting was going to continue its decline, and currently it is below 1.50. The STI Index has closed on a new low, below the previous low of 2720. What does this mean? It means that there is a good chance of seeing new lows, either with or without a consolidation phase first. One tell-tale sign is the weakness in major sectors like the financials and O&M. Let’s take a look at DBS, one of the 3 financial giants.
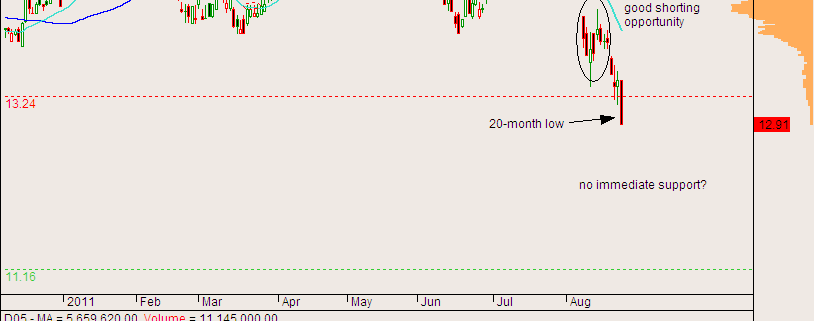
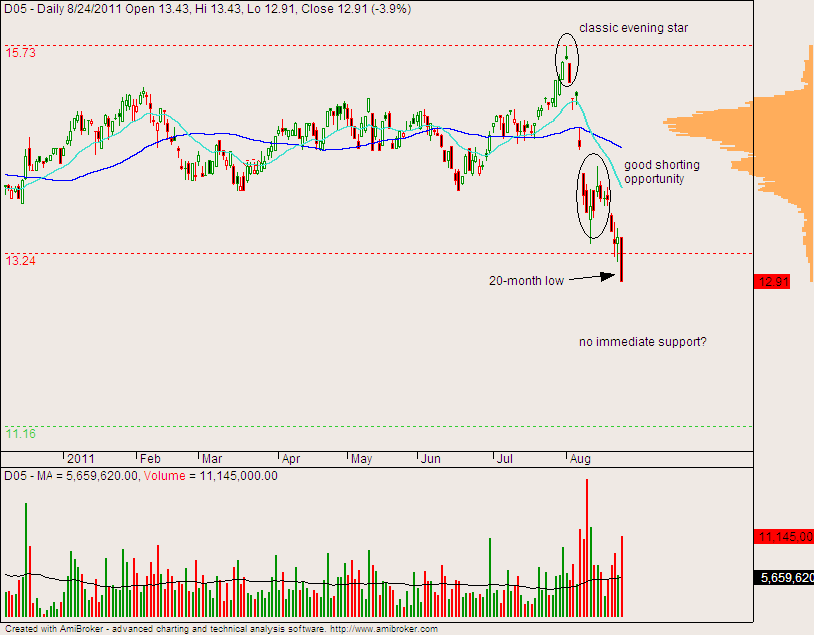
After a classic evening star reversal early this month, DBS has gone down to make a new 20-month low, providing several good shorting opportunities (can you spot them?) along the way. The worse part is, there seems to be no immediate support level. This means that the markdown has potentially a lot of room to go, since there will be no psychological level for the bulls to rally. I would be keeping an eye out for more opportunities to go short.
In order to derive meaning from life experiences, people have developed an innate propensity for classifying objects and thoughts. When they confront a new phenomenon that is inconsistent with any of their preconstructed classifications, they subject it to those classifications anyway, relying on a rough best-fit approximation.

There are two main types of representativeness bias, namely (i) base-rate neglect and (ii) sample-size neglect. We will focus on the latter, since it occurs more frequently in trading.
In sample-size neglect, traders, when judging the likelihood of a particular trade outcome, often fail to accurately consider the sample size of the data from which they base their judgments. They incorrectly assume that small sample sizes are representative of populations. This is also known as “the law of small numbers”.
This problem is observed when traders try to backtest systems by using small sample sizes of data, and extrapolate their favourable results. However, these results are most likely not representative of the effectiveness of the system. This is a common tactic applied in marketing gimmicks.
Another common phenomenon has to do with hot tips. For example, you might hear someone say “my broker gave me three great stock picks over the past month, and each stock is up by over 10%”. While this is enough to sway most people, thinking that the broker is a genius, this assessment is based on a very small sample size.
What is the best solution for this?
If you want to evaluate the effectiveness of system or the stock-picking skills of a person, make sure you do it over a large sample size, and count both the hits and misses. This will give you a more complete representation of reality.
When newly acquired information conflicts with preexisting understandings, people often experience mental discomfort – a psychological phenomenon known as cognitive dissonance. Cognitions, in psychology, represents attitudes, emotions, beliefs, or values; and cognitive dissonance is a state of imbalance that occurs when contradictory cognitions intersect.

This term encompasses the response that arises as people struggle to harmonize cognitions and thereby relieve their mental discomfort. For example, a trader might take a long position in s stock thinking that the trend is up, however when a new cognition that favours a downtrend is introduced, representing an imbalance, cognitive dissonance then occurs in an attempt to relieve the discomfort with the notion that perhaps the trader did not make the right decision.
People will go to great lengths to convince themselves that the decision they made was the right one, to avoid the mental discomfort associated with their wrong decision.
Psychologists hence conclude that people often perform far-reaching rationalizations in order to synchronise their cognitions and maintain psychological stability. There are actually two kinds of cognitive dissonance bias – (i) selective perception, where people only register information that appears to affirm a chosen course, and (ii) selective decision making, where people rationalise actions in order to stick to an original course.
The dangers are obvious. Traders who are not bias-free cannot read the markets objectively, and will not be able to adapt fast enough to changing market conditions. Selective decision making could also lead to a resistance to cutting losses, and coming up with various excuses to avoid admitting their initial entry was indeed erroneous.
What is the best solution for this?
The key to overcoming this is to immediately admit that a faulty cognition has occurred, address feelings of unease and take appropriate rational action. If you think you have made a bad trading decision, analyse the decision; if the fears prove correct, confront the problem head-on and rectify the problem.
This above all: to thine own self be true,
And it must follow, as the day the night.
– Polonius to Laertes, in Shakespeare’s Hamlet
One aspect of market analysis is statistical analysis, which is using statistics to find correlations and patterns, where opportunities of skewed probabilities may lurk, giving you an edge over the market in the long run. For investors, this lets you know the best month to start building your portfolio, or to rebalance/adjust your portfolio allocation.
Seasonality is a characteristic of a time series in which the data experiences regular and predictable changes which recur every calendar year. Any predictable change or pattern in a time series that recurs or repeats over a one-year period can be said to be seasonal.
This is different from cyclical effects, as seasonal cycles are contained within one calendar year, while cyclical effects (such as boosted sales due to low unemployment rates) can span time periods shorter or longer than one calendar year.
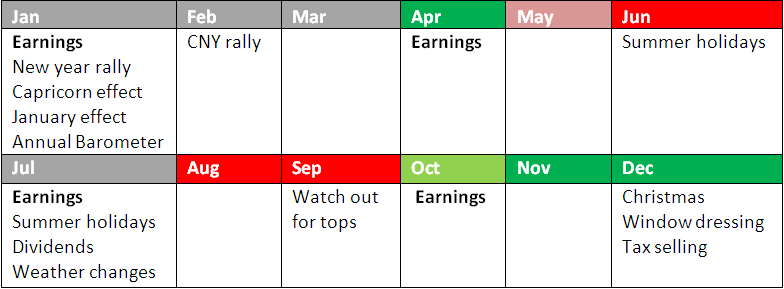
For the Singapore stock market, I have done a seasonality study, showing which months are more bullish and bearish. Contrary to popular belief, October is actually a rather bullish month. Every month has its unique characteristics, which skews the probability. As a trader,anything that tilts the probability in our favour is considered an edge.
Here are the results of my research:
Some key points to note: the best months for being LONG are April, November and December, while the best months for being SHORT are June, August and September.
There are many other patterns (some less obvious) which could have a significant impact on the stock market. Although your trading decisions should not be based solely on these, they can act as a powerful confirming indicator, or help you adjust your position-aggressiveness.
Latest Blog Posts
 A Deeper Look at the US-China Trade War & Possible SolutionsApril 18, 2025 - 10:49 pm
 Best Assets to Invest in Under President Donald TrumpNovember 10, 2024 - 10:55 pm
 The 2024 U.S. Presidential Election: What to Buy if Donald Trump or Kamala Harris Wins?November 2, 2024 - 12:38 am
Contact Us
Synapse Trading Pte Ltd
Registration No. 201316168H
FB Messenger: synapsetrading
Telegram: @iamrecneps
Email: info@synapsetrading.com
Disclaimer
Privacy policy
Terms & Conditions
Contact us (main)
Partnerships

