Last week, I was having Army training in camp, so I didn’t have much trades, since I was limited to taking those hands-free trades. Still, it was a pretty good week, as most of my trades turned out well, netting a decent profit for me while I was out in the jungle serving my country. Unfortunately next week I will be having a 4D3N outfield exercise and will not be able to enter new trades, except for my existing positions.
Without further ado, here are some of my trades from last week, starting with some forex trades. I went short on 1 lot of AUD/CAD for 190 pips, raking a profit of US$1884 after price hit my TP while I was away from my screen. I only realised it after one of traders in the network mentioned it in our private forum.


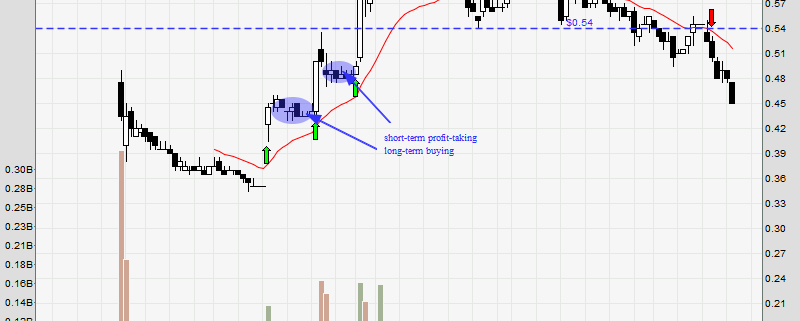
Genting was an interesting trade, because it first tried to form a classical head-and-shoulders breakout to the wrong side, before triggering our long setup. Our TP of 1.63 was hit after a few strong moves, and price promptly reversed after hitting our TP.

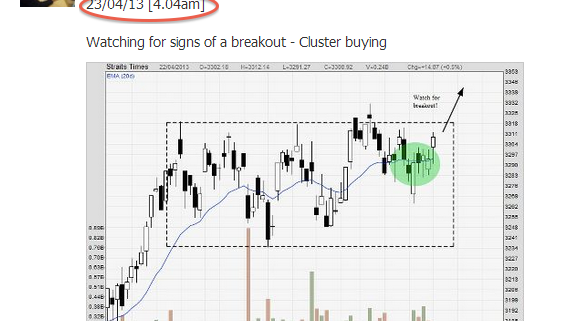
Next week, the STI will drop to test the conviction of weak buyers the coming week, which would provide good entry opportunities for shrewd market-timers. I will be holding onto my shorts on Indofood Agri, as per my previous call to go short. I am looking forward to my next seminar once I return back from my Army training, and I will be able to share more about these recent trades.