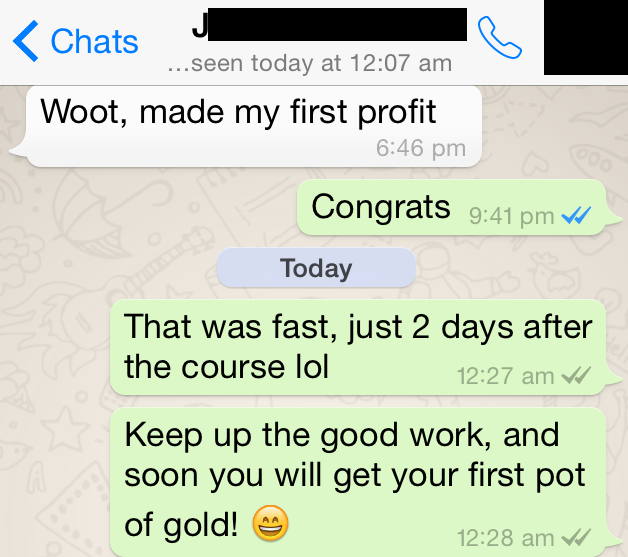
How fast would you like to see a transformation in your life? How about 2 days?
That’s how long it took our new traders to start making their first profits in the market.
With our unique 7 Step Formula and 4 Proprietary Trading Strategies, 15 minutes a day is all we need to start making consistent profits, and create a 2nd source of passive income.
We are proud to announce that another batch of successful graduates have learnt the secrets of behavioral analysis and how professional traders time the market! Now it is time for them to put what they have learnt into practice, and start reaping profits from the market!
And once again, we have 100% positive reviews and a strong YES! when asked if they would recommend their friends and family.
Here at Synapse Trading, our goal is not to sell you some magical blackbox software, but to impart real professional trading skills which can stand the test of time and work under all market conditions. As the head trainer, I have traded professionally at private equity and proprietary funds, and I am an internationally certified CFTe under the IFTA. This is why I am the youngest professional trainer for SGX, helping to train both retail and seasoned traders.
We take special pride in our post-course support and training, and daily discussions in our private forum and live chat groups, which is why most of our new students come from referrals from past graduates, and we have a long waiting list of people eager to join our exclusive network. Unfortunately, there is one of me, and I only have time to train 20 new traders each quarter.

Table of Contents
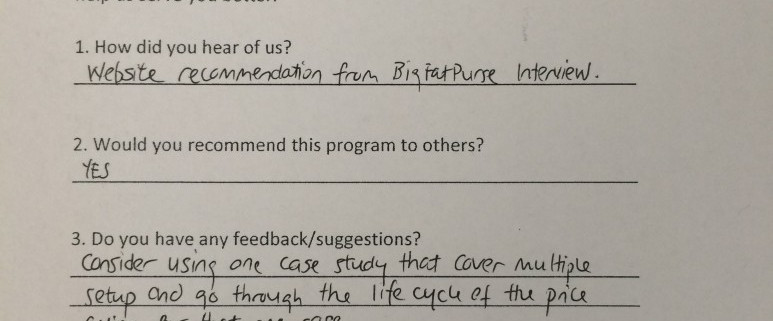
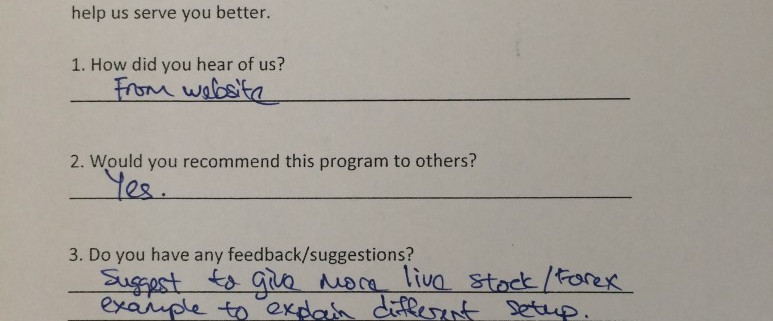
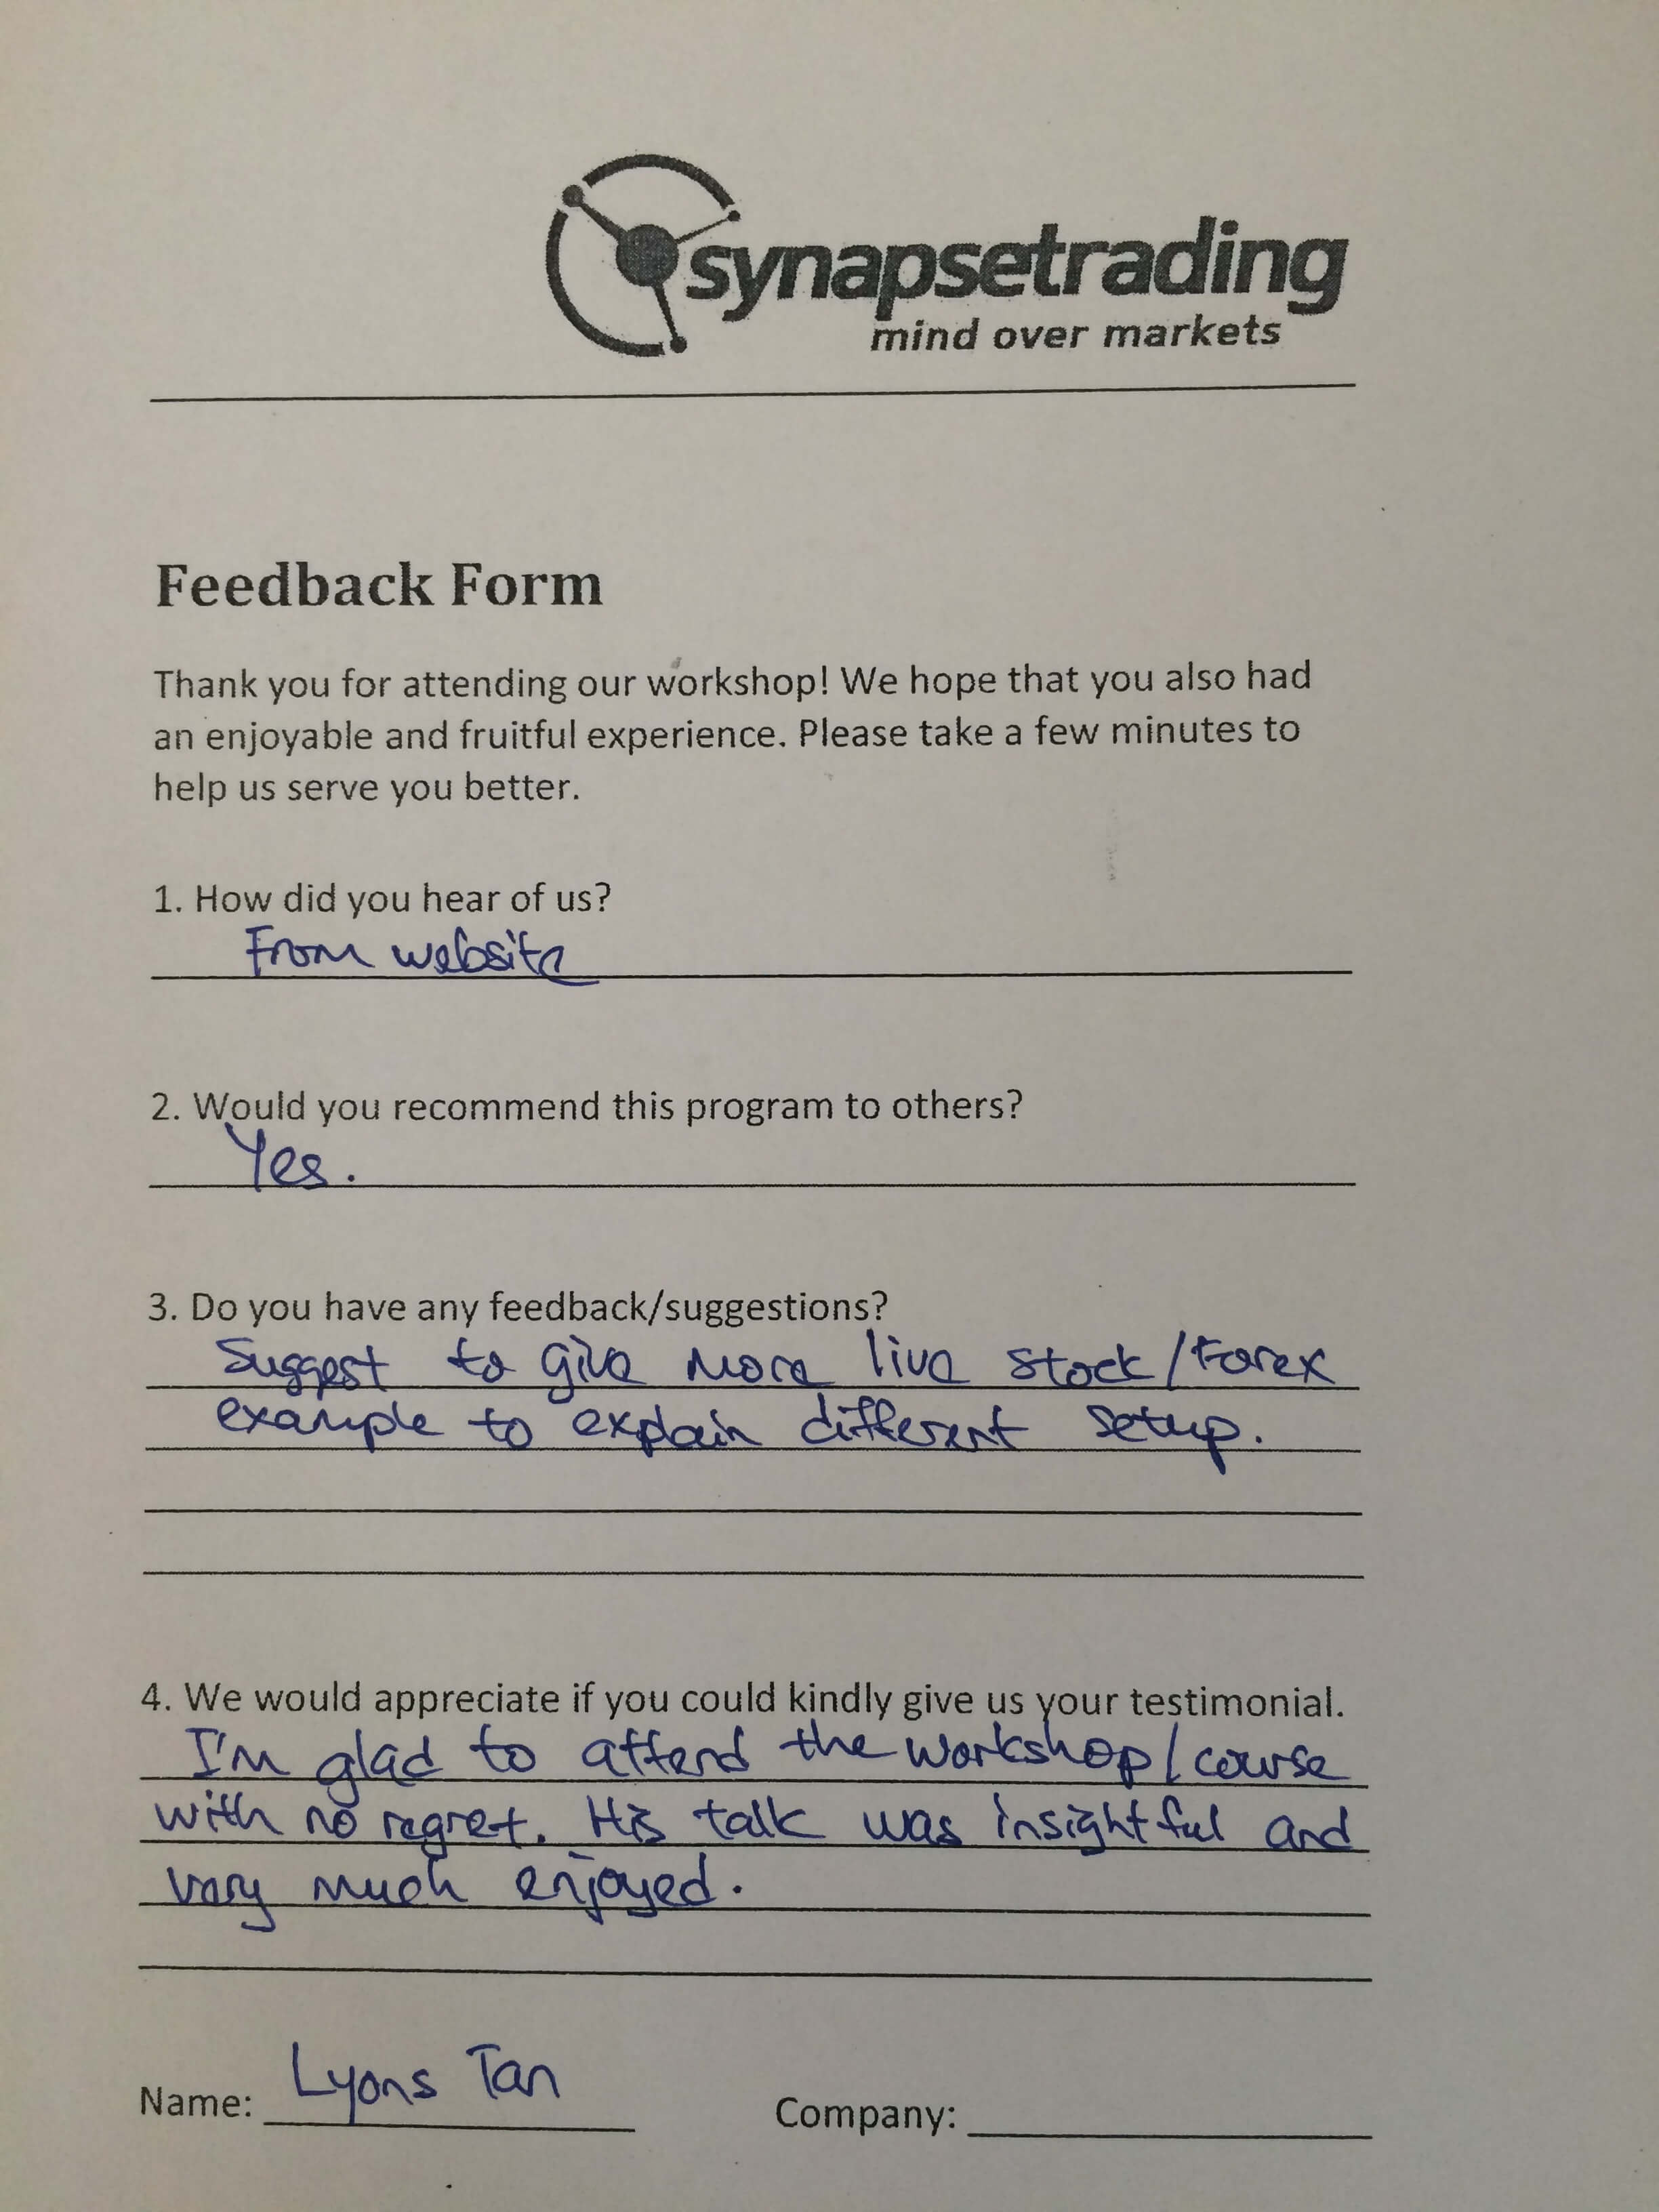
Q2 2015 Training Program Feedback
“The setups and course structure is a very logical approach. Simple and yet powerful.” – Tong Mun Kit
“This course teaches you the fundamentals of trading and also the trading psychology. It gives you quite a solid understanding of the markets.” – Kelwin, OCBC
“Very good! :)” – Neo Wei Jie
“This program is suitable for beginner and experienced traders. Strategies are taught as advertised.” – Chong Wei Nian
“This program is good for beginners. It provides the basis and methodology for systematic and effective trading for a passive income.” – Stephen, New trader
“Good coverage of topics. Very knowledgeable on TA. Good pace.” – Teo KB
“Informative workshop. Able to apply (eg. 7 step formula). Use of charts for illustration, which made learning easier.” – RC, KPMG
“Good pace with very good information provided in the course. Also a great thing to have followups such as trading workshops/refreshers/LIVE chats. Worth every penny!” – Alwyn Loh, KPMG
“Very detailed and informative.” – Kenneth
“I have more confidence in my trading with the 7 step formula.” – Kelvin Leong
“I learnt how to apply the 7 behaviors steps which makes it a more disciplined way of trading.” – Roy Chiam Zhi Wei
“Thanks for making this easy & simple to follow. I was overloaded with information from many sources but you cut away the non-important ones and helped me focus on what is necessary.” – Jonathan Chow, Solomon Alliance
“It was a good and informative training for beginner to understand what trading is about.” – Chua Piah Keng, New trader
“Provides us with the fundamental technical analysis & strategy for trading.” – Gaw Hui Shan, New trader
“Spencer is very knowledgeable and the course had good coverage of all the areas needed to become a good trader. Highly recommended.” – Iris Goh
“Excellent coaching and unique trend spotting techniques.” – Nasser

Trading Results after just 2 days
Immediately after the course, I have continued to post my stocks and forex trades for our Synapse Network to trade together, and here are some of the results:

My recent forex positions and profits

Would you like a taste of success too?
To see more testimonials, please visit https://synapsetrading.com/testimonials/
To find out more about our training program, please visit https://synapsetrading.com/the-synapse-program/