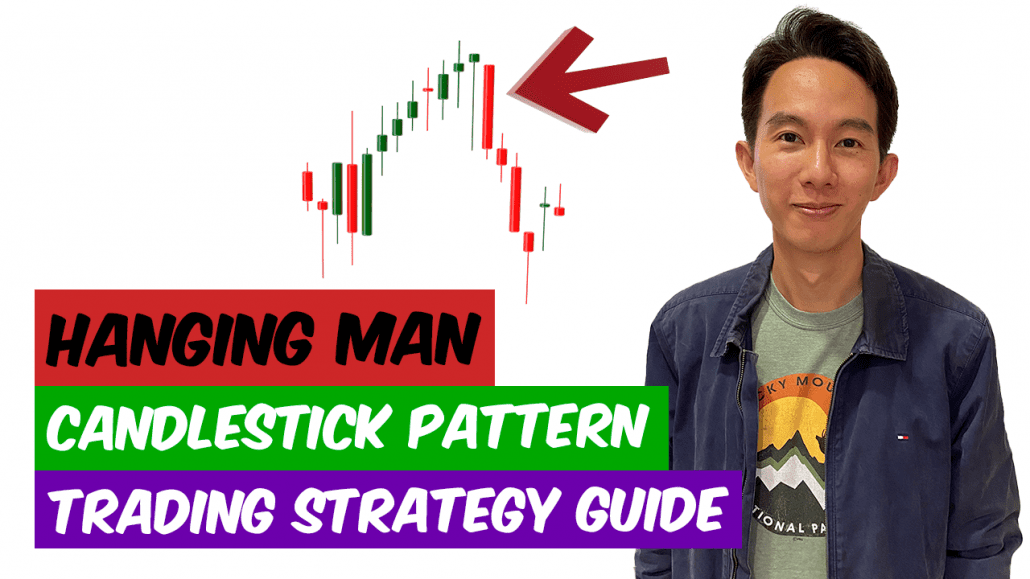
Hanging Man Candlestick Pattern Trading Strategy Guide
Join our Telegram channel for more market analysis & trading tips: t.me/synapsetrading
The Hanging Man Candlestick Pattern is a technical analysis tool used in trading to identify potential reversals in the market.
This pattern is formed when the price of an asset opens at a high and then closes lower, creating a candle with a long downward wick and a small body.
The pattern gets its name from the shape of the candle, which looks like a person hanging by their feet.
While it is not as well-known as other candlestick patterns, such as the Bullish Engulfing Pattern or the Bearish Engulfing Pattern, the Hanging Man Pattern can be a valuable tool for traders looking to enter or exit a position.
In this blog post, I’m going to teach you all about this candlestick pattern, how to identify it, the strategies to trade it, and some practical applications of this pattern.
Table of Contents
How to Identify the Hanging Man
- The Hanging Man Pattern is characterized by a small body and a long downward wick.
- The small body can be either bullish or bearish, but the long downward wick is always bearish.
- The body of the candle is typically located at the top of the candle, near the open price, and the downward wick extends below the body.
Psychology of the Pattern
- The Hanging Man Pattern is often seen as a bearish reversal pattern, indicating that the price may be about to fall after a uptrend.
- This pattern suggests that the bears are starting to gain control of the market, as they push the price down from the high open.
- However, it is important to note that the Hanging Man Pattern is not always a strong reversal signal and should be used in conjunction with other technical analysis tools.
How to Use it to Trade
- One way to use the Hanging Man Pattern is to trade the reversal by selling a long position or buying a short position.
- Another way to trade the pattern is to wait for confirmation of the reversal, such as with a bearish candle following the Hanging Man Pattern.
- It is also important to consider the overall trend and the strength of the pattern when making a trade decision.
Trading Strategies for the Hanging Man Pattern
- One strategy for trading the Hanging Man Pattern is to enter a short position after the pattern has formed and wait for the price to fall.
- Another strategy is to enter a long position on a breakout above the high of the Hanging Man Pattern, as this may indicate a continuation of the uptrend.
- It is also possible to use the Hanging Man Pattern as a stop loss strategy, by placing a stop loss order below the low of the pattern.
Where to Enter a Trade
- One option for entering a trade based on the Hanging Man Pattern is to place a market order at the open of the next candle following the pattern.
- Another option is to use a limit order, setting the entry price at a level above or below the pattern, depending on the direction of the trade.
Where to Place the Stoploss
- One option for placing a stop loss when trading the Hanging Man Pattern is to use a percentage of the asset’s trading range, such as 2-3%.
- Another option is to place the stop loss at a level below the low of the Hanging Man Pattern, as this may provide a clear level for the stop loss to be triggered if the price moves against the trade.
Where to Take Profit on the Trade
- One way to take profit when trading the Hanging Man Pattern is to use a target price based on the size of the pattern and the expected move.
- Another option is to use a trailing stop loss, which allows the trade to remain open as long as the price continues to move in the desired direction.
How to Combine with Trendlines
- Trendlines can be a useful tool for identifying the trend and potential reversal points in the market. When combined with the Hanging Man Pattern, trendlines can help traders confirm the reversal signal and make more informed trade decisions.
- For example, if the Hanging Man Pattern forms after an uptrend and is accompanied by a trendline break, this may provide further confirmation of a potential trend reversal.
- Similarly, if the Hanging Man Pattern forms after a downtrend and is accompanied by a trendline bounce, this may indicate a potential trend continuation.
How to Combine with Support and Resistance Levels
- Support and resistance levels can also be useful for identifying potential reversal points in the market. When combined with the Hanging Man Pattern, these levels can help traders confirm the reversal signal and make more informed trade decisions.
- For example, if the Hanging Man Pattern forms near a strong support level, this may indicate that the price is likely to bounce off the support and continue the uptrend.
- On the other hand, if the Hanging Man Pattern forms near a strong resistance level, this may indicate that the price is likely to break through the resistance and continue the downtrend.
How to Combine with Price Patterns
- Combining the Hanging Man Pattern with other price patterns, such as head and shoulders or double tops, can also provide further confirmation of a potential trend reversal.
- For example, if the Hanging Man Pattern forms at the top of a head and shoulders pattern, this may indicate that the price is about to reverse and move lower.
- Similarly, if the Hanging Man Pattern forms at the top of a double top pattern, this may also indicate a potential trend reversal to the downside.
How to Combine it with Price Action
- Price action trading involves analyzing the movement of the price itself, rather than relying on indicators or other technical analysis tools. Combining the Hanging Man Pattern with price action analysis can provide a more complete picture of the market and help traders make more informed trade decisions.
- For example, traders can look for other price action signals, such as bearish engulfing patterns or bearish harami patterns, to confirm the reversal signal provided by the Hanging Man Pattern.
How to Combine it with Trend-following Indicators
- Trend-following technical indicators, such as moving averages and MACD, can be useful for identifying the overall trend and potential reversal points in the market. When combined with the Hanging Man Pattern, these indicators can help traders confirm the reversal signal and make more informed trade decisions.
- For example, if the Hanging Man Pattern forms after an uptrend and is accompanied by a bearish crossover in the moving averages or a bearish divergence in the MACD, this may provide further confirmation of a potential trend reversal.
How to Combine with Oscillators
- Oscillator indicators, such as RSI and Stochastics, can be useful for identifying overbought and oversold conditions in the market. When combined with the Hanging Man Pattern, these indicators can help traders confirm the reversal signal and make more informed trade decisions.
- For example, if the Hanging Man Pattern forms after an uptrend and is accompanied by an overbought reading in the RSI or a bearish crossover in the Stochastics, this may provide further confirmation of a potential trend reversal.
Limitations of Hanging Man Pattern
- It is important to note that the Hanging Man Pattern is not a reliable reversal signal on its own and should be used in conjunction with other technical analysis tools.
- The pattern may also be less reliable in volatile or low volume markets, as these conditions may create false signals.
- Additionally, the Hanging Man Pattern may not always indicate a trend reversal, as it can also occur during a consolidation or sideways movement in the market.
Practical Applications
The Hanging Man Pattern has helped me in my personal trading by providing potential reversal signals that I can use to enter or exit positions.
For example, when trading for a living as a full-time trader, it is important to be able to identify potential reversals in order to maximize profits and minimize losses.
By using the Hanging Man Pattern as one of my technical analysis tools, I have been able to improve my trade timing and make more informed decisions about when to enter or exit a position.
As a professional trader, I have found that the Hanging Man Pattern can be a valuable tool for identifying potential reversals in the market.
By using this pattern in combination with other technical analysis tools, such as trendlines and oscillator indicators, I have been able to improve my trade accuracy and increase my profits.
For example, when the Hanging Man Pattern forms at a key resistance level and is accompanied by a bearish divergence in the RSI, I have often found this to be a strong signal to sell.
Concluding Thoughts
In conclusion, the Hanging Man Candlestick Pattern is a technical analysis tool that can be used to identify potential reversals in the market.
While it is not a reliable signal on its own, it can be a useful tool when combined with other technical analysis techniques, such as trendlines, support and resistance levels, and oscillator indicators.
By using the Hanging Man Pattern in my personal trading, I have been able to improve my trade timing and make more informed decisions about when to enter or exit a position.
However, it is important to remember that no single technical analysis tool is foolproof and that it is always important to consider the overall market conditions when making trade decisions.
Now that I have covered all about this candlestick pattern, is it something that you will add to your trading toolbox?
Let me know in the comments below.

If you would like to learn more about all the different candlestick patterns, also check out: “The Definitive Guide to Candlestick Patterns”
 Our flagship mentoring program is suitable for both beginners and advanced traders, covering the 4 strategies which I used over the past 15 years to build up my 7-figure personal trading portfolio.
 If you're looking for a reputable brokerage that covers all products (SG stocks, US stocks, global stocks, bonds, ETFs, REITs, forex, futures, crypto) and has one of the lowest commissions, this is what I currently use.
After trading for 18 years, reading 1500+ books, and mentoring 1000+ traders, I specialise in helping people improve their trading results, by using tested trading strategies, and making better decisions via decision science.


Leave a Reply
Want to join the discussion?Feel free to contribute!