Recently, there has been a lot of volatility in the Crypto market, with many bullish and bearish factors moving the market, which resulted in a big crash.
In this post, I’m going to do an overview of the crypto and forex market, review some of our recent trades, and discuss the current trading opportunities.
If you want to get all the analysis and charts mentioned in this post ahead of time, don’t forget to join our free telegram channel! https://t.me/synapsetrading
Covid updates
Before we go into the markets, let’s take a quick look at the Covid situation, with a focus on vaccination.

As you can see from this chart, the developed countries have surged ahead with vaccinations, with 50-60% of their population getting at least one dose.
For many of these places, life has almost gone back to normal, and the economic recovery has started.
Unfortunately, this recovery is going to be another K-shape recovery, because if you look at the overall numbers, only 10-15% of the global population has had at least one dose.
My guess is that by Q3 or Q4 this year, travel will resume in some developed countries.
Bitcoin: Shorting the Big Crash!
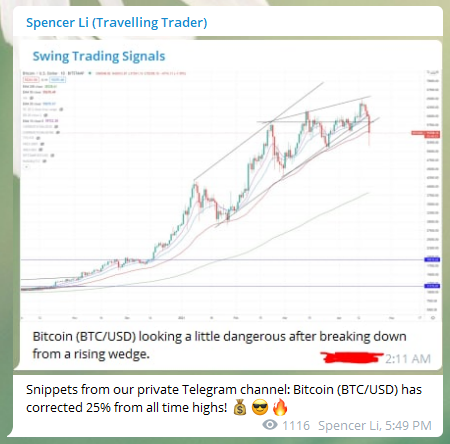
In early May this year, I started calling for a short on Bitcoin, after seeing the rising wedge pattern which evolved into a head and shoulders pattern.

Bitcoin (BTC/USD) is starting to form a potential reversal pattern. We need to watch out in case this price movement develops. Trade according to the trend! ??

Following up from our Bitcoin (BTC/USD) analysis just a few days ago, we accurately predicted the sharp drop of Bitcoin before it happened!
Congrats to those who followed and shorted! ???
Bitcoin: Buying Opportunity Now?
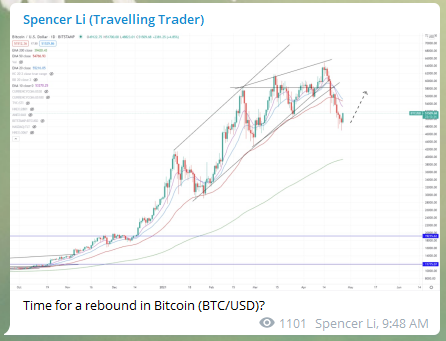
More recently, I noticed that Bitcoin has bottomed out for the medium-term, so I issued a buy call, which is still valid now.
Following up on our series of uncanny accurate predictions on Bitcoin (BTC/USD), it has now formed a mini double bottom (tweezer bottom), and we could well see a medium-term swing upwards, after the huge sell-down that went into oversold territory.
Though the major trend might still be bearish, this looks like a good low-risk counter-trend buying opportunity to capture a swing up.

Following up on Bitcoin (BTC/USD), this is the 3rd test of support (and it held), which is a sign of bullishness.
Looks like a good time to start accumulating some. ??
Ethereum: Profits from the Crash

Looks like Ethereum (ETH/USD) is in for some correction as well, with the first major support at 3000. Will reevaluate when prices get there.
Following up on Ethereum (ETH/USD), our prediction was also spot-on, and the crash exceeded our expectations and went all the way to TP3 in just one day!
Congrats to those who followed and shorted! ???
Recent Forex Trades: AUD/CHF & EUR/JPY

Looking at the chart of AUD/CHF, it has tried 3 times to break the resistance to new highs, but failed 3 times.
This suggests that there may be more downside, especially if it breaks the bullish trendline.

Following up from AUD/CHF, it has broken to new lows as predicted, and is now trending downwards.
Congrats to those who followed! ???
EUR/JPY remains on a strong uptrend, clearing the recent resistance, and formed a bull flag after pulling back to the 10&20-EMAs.

Following up on EUR/JPY, it has gone up by +276 pips since our last analysis.
Congrats to those who followed! ???
I have come to the end of this market analysis.
Now that I have shared my views on the various markets, do you think it is a good time to start buying cryptocurrencies?
Let me know in the comments below!
P.S. Check out our mentoring programs if you are keen to start your trading journey today!
After trading for 18 years, reading 1500+ books, and mentoring 1000+ traders, I specialise in helping people improve their trading results, by using tested trading strategies, and making better decisions via decision science.