Intraday Trading with Price Action

Using 3 timeframes of 5-min, 1-hour and 1-min, this is a simple way to pinpoint entries and exits to scalp the EUR/USD, as well as take longer term intraday swing positions.

From the chart, it is obvious the price action is contained in a downwards sloping channel, which means that most opportunities will have a short bias, since the edge lies in that direction – the path of least resistance.

In total, there were at least 20 good entry opportunities which provided a scalp/swing ranging from 4 to 16 ticks (each tick is USD 12.50 per contract), for those who are thinking of trading intraday. I am waiting for it to pull back to the top of the channel for another opportunity to catch another major swing down.

Another Breakdown

After my previous post, the EUR/USD has continued downwards and hit my profit target, where I took profit on my accumulated shorts and watched to see if the next support would be broken.

Despite the bullish news in the evening today, which caused a major spike up on most equity and Euro-related forex futures, the EUR/USD gave up its gains and went back into negative territory.

Watching the price action throughout the day, I knew that while retail traders might be going long for a breakout play, professionals were already taking the chance to liquidate their longs and were initiating short positions.

I started scaling in shorts after the major spike, and managed to get in most of my positions near the day high. I used the 5-minute charts to scale out my positions and take profit as price started to break down.

Now, I am still net short, and I am waiting to see if price manages to convincingly break the support for another leg down.

Stayed tuned in the Synapse forum!

Cheers
Spencer

Hi peeps

I hope the market has been treating you well, with bullish stock markets and volatile forex markets. This has provided many good trading opportunities, and I hope you didn’t miss out on them.
Breakdown on the daily

On the 29th of June, I was looking to initiate shorts, and subsequently did, using a range trading strategy to stack my position size. Although I did have several intraday trades on the 5-min charts, my larger view was bearish, hence I also held on to the bulk of my positions.

This is an example of a breakout play, where price breaks support and provides opportunities for trading when it comes back to test the breakout point.

For this EUR/USD chart, price came back twice to test the support-turned-resistance, giving me opportunities to stack my shorts.

If we zoom in on the smaller timeframe, such as the hourly charts, we start seeing more obvious signals like the shooting star reversal bar, and also a nice downward sloping trendline which provided many shorting opportunities.

My minimum target is the test of the previous swing low, which is likely to get hit before the market closes for the weekend, but I have already started scaling out my positions to lock in the profit.

Cheers
Spencer

Regarding the market, we are likely to see a strong opening tomorrow given the strong close on Friday. The Dow closed up 277 points, due to the bullish news coming out of Europe, with new measures to “avert” the latest crisis.

It’s funny how the cycle plays out:
Crisis event – FEAR, FEAR, FEAR, it’s the end of the world!!!
Discussion – leaders discuss how to solve it, and markets creep down as the clock ticks. People are worried that no solution will emerge and markets become oversold.
Just in time! – Just when the sand is about to run out of the hourglass, the solution emerges and everyone is happy.
Next crisis – rinse and repeat

So, the big question is: how long is this bullishness going to last? Let’s not forget the core problems are still not solved. The charts will inform us when the time comes.

The end of Q2

Let’s also not forget that last Friday was the last trading day for Q2, which signifies something very important: WINDOW DRESSING. We shall see whether this optimism carries on into the next week

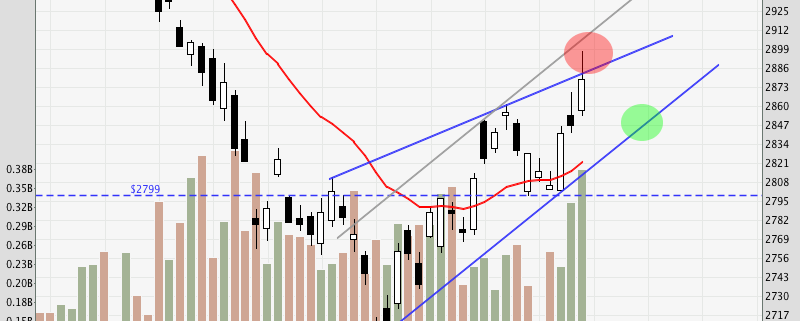
Looking at the chart above, I would prefer to go long near the green circled area instead of the red circled area, where weakness in the form of upper shadows. Given the bullishness, there may not be any pullback, so I will be looking to go long on any intraday pullback or pause bar.

////////  Do note that the current short-term trend is bullish, so stay bullish until the price informs us of a change in direction. ////////

Cheers
Spencer

On Saturday, we had another full-house seminar on candlestick patterns. It was conducted at City Index, as part of our collaboration with them. Besides covering the basic patterns, we delved deeper into blended candles, and talked about the most important candlestick pattern – the universal candle pattern.

The Most Important Candlestick Pattern

The Most Important Candlestick Pattern 2

The Most Important Candlestick Pattern 3

Do stay tuned for more of our educational series of free seminars, where we will be covering various trading topics. Thanks for all your feedback and support!

Sign up for our mailing list to keep updated of the latest workshops and seminars!
For program enquiries, please email info@synapsetrading.com