Bearish Harami
Join our Telegram channel for more market analysis & trading tips: t.me/synapsetrading
Table of Contents
What Is a Bearish Harami?
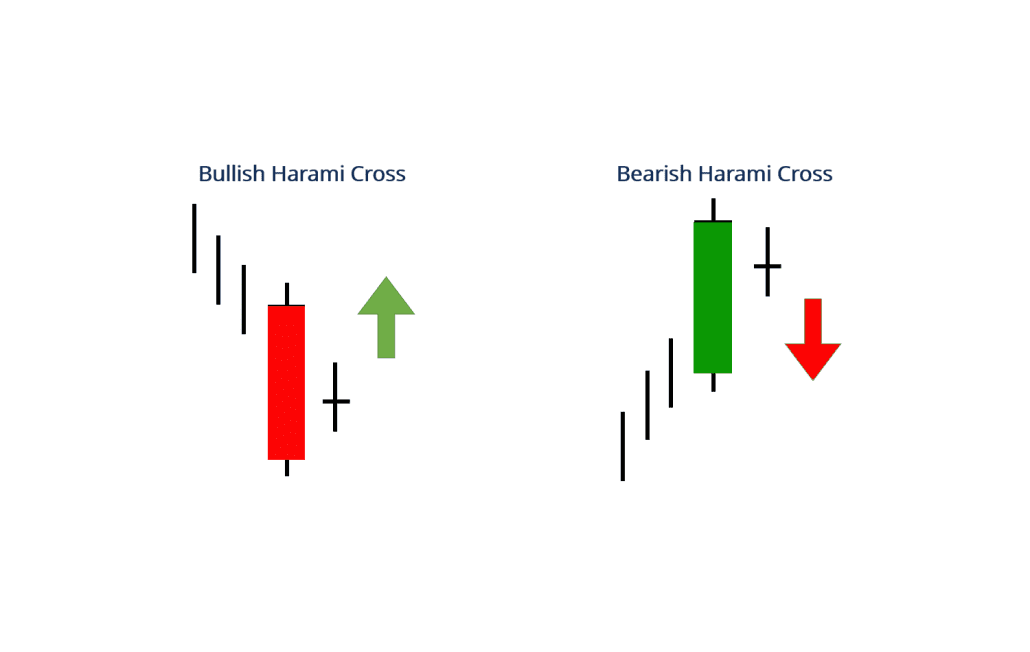
A bearish harami is a two-bar Japanese candlestick pattern that suggests prices may soon reverse to the downside.
The pattern consists of a long white candle followed by a small black candle.
The opening and closing prices of the second candle must be contained within the body of the first candle.
An uptrend precedes the formation of a bearish harami.
Bearish Harami Explained
The size of the second candle determines the pattern’s potency; the smaller it is, the higher the chance there is of a reversal occurring.
The opposite pattern to a bearish harami is a bullish harami, which is preceded by a downtrend and suggests prices may reverse to the upside.
The bearish harami received its name because it resembles the appearance of a pregnant woman.
“Harami” is the Japanese word for pregnant.
Traders typically combine other technical indicators with a bearish harami to increase the effectiveness of its use as a trading signal.
For example, a trader may use a 200-day moving average to ensure the market is in a long-term downtrend and take a short position when a bearish harami forms during a retracement.
Trading a Bearish Harami
Price Action: A short position could be taken when the price breaks below the second candle (harami candle) in the pattern.
This can be done by placing a stop-limit order slightly below the harami candle’s low, which is ideal for traders who don’t have time to watch the market, or by placing a market order at the time of the break.
Depending on the trader’s appetite for risk, a stop-loss order could be placed above either the high of the harami candle or above the long white candle.
Areas of support and resistance might be used to set a profit target.
Indicators: Traders can use technical indicators, such as the relative strength index (RSI) and the stochastic oscillator with a bearish harami to increase the chance of a successful trade.
A short position could be opened when the pattern forms and the indicator gives an overbought signal.
Because it is best to trade a bearish harami in an overall downtrend, it may be beneficial to make the indicator’s setting more sensitive so that it registers an overbought reading during a retracement in that trend.
Profits could be taken when the indicator moves back into oversold territory.
Traders who want a larger profit target could use the same indicator on a larger time frame.
For example, if the daily chart was used to take the trade, the position could be closed when the indicator gives an oversold reading on the weekly timeframe.
Concluding Thoughts
The bearish harami is a valuable pattern for traders looking to identify potential reversals in an uptrend.
While the pattern alone can signal a bearish reversal, its effectiveness is enhanced when used in conjunction with other technical indicators like the RSI or stochastic oscillator.
As with all trading strategies, proper risk management is crucial, and traders should be mindful of using stop-loss orders to mitigate potential losses.
Incorporating the bearish harami into a broader trading strategy that includes trend analysis and confirmation signals can lead to more informed trading decisions and potentially better outcomes.
 Our flagship mentoring program is suitable for both beginners and advanced traders, covering the 4 strategies which I used over the past 15 years to build up my 7-figure personal trading portfolio.
 If you're looking for a reputable brokerage that covers all products (SG stocks, US stocks, global stocks, bonds, ETFs, REITs, forex, futures, crypto) and has one of the lowest commissions, this is what I currently use.
The Synapse Network is our dedicated global support team, including event managers, research teams, trainers, contributors, as well as the graduates and alumni from all our previous training program intakes.


Leave a Reply
Want to join the discussion?Feel free to contribute!