

Monthly Market Wrap (October 2026)
Want the daily routine? Get the free 15-Minute Swing Trader’s Checklist. Get it free →
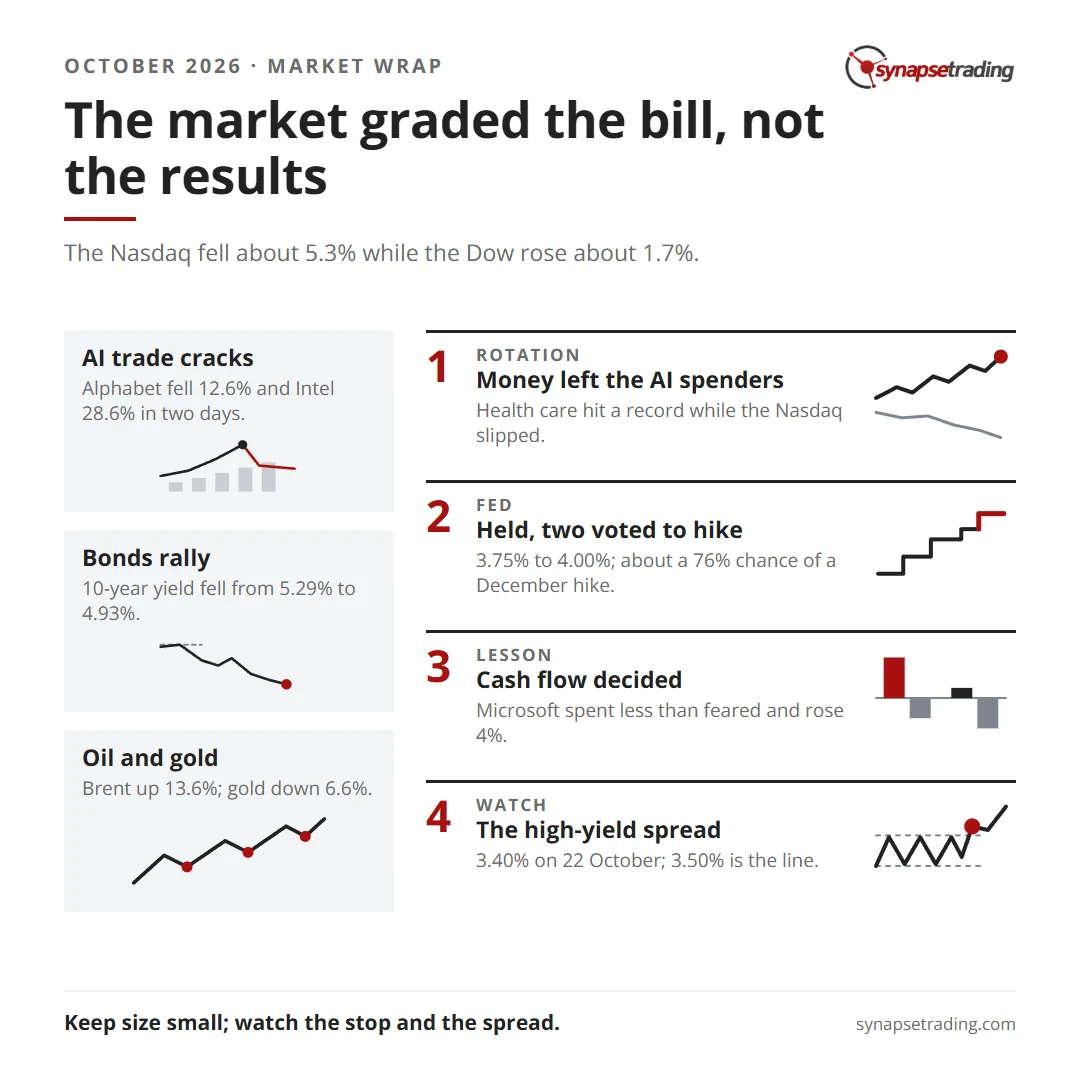
Have you ever seen the Nasdaq set a record close and then lose 5% in the same month, while the Dow quietly went up? That was October 2026. The Nasdaq Composite fell about 5.3% to 25,437, its worst month since March 2025, the S&P 500 slipped about 0.9% to 7,580, and the Dow rose about 1.7% to 51,771. Underneath, the Fed held rates at 3.75% to 4.00% with two members voting to hike, and the 10-year Treasury yield fell from 5.29% to 4.93%. Brent crude gained 13.6%, gold lost 6.6%, and Alphabet had its worst day since it listed in 2004. So let’s go through what actually happened, and what I’m watching into November.
Table 1: October 2026 in numbers
| Measure | October 2026 |
| S&P 500 | 7,580.07, down about 0.9% |
| Dow Jones | 51,771.14, up about 1.7% |
| Nasdaq Composite | 25,437.00, down about 5.3% |
| Fed funds rate | 3.75% to 4.00%, held on 28 October with two dissents for a hike |
| 10-year Treasury yield | 4.93%, down from 5.29% |
| Brent crude | about $113, up 13.6% |
| Gold | about $3,885 an ounce, down 6.6% |
| Bitcoin | about $77,400, down about 7% |
Global Stock Market Trends
The month began where September left off, with the AI trade carrying everything. On 6 October the S&P 500 closed at a record 7,818.95 and the Nasdaq at a record 27,599.79. Nvidia had touched a record $237.87 four days earlier, taking its market value close to $6 trillion.
Then the trade cracked. From the debt side first. On 14 October CoreWeave fell 15.5% as the yield on its 2032 bond rose to 14.8%. Dell lost 11% after a Barclays downgrade, and Oracle dropped 9%. By 16 October the Nasdaq had lost 4.5% on the week, its worst since June, and both it and the S&P 500 closed below their 50-day moving averages. Why would a bond yield at one company shake the whole sector? Because the AI build-out is being paid for with borrowed money, and when the lenders flinch, every company counting on that money gets repriced at once.
What made October different from a normal tech sell-off is where the money went. On 20 October health care hit a record high while the Nasdaq slipped. A week later the Dow was setting new highs while the Nasdaq fell. Energy was the best sector of the month, communication services the worst. The index level hid a rotation: out of the companies spending on AI, into the companies that sell them power, oil and insurance.
The last two sessions decided the month. On 29 October Alphabet fell 12.6% and ServiceNow 27%, and on 30 October Intel fell 28.6% and Reddit 29%. The Nasdaq lost 2.86% on the final day alone, and the Nasdaq 100 finished the month down 6.65%, just short of a correction. Do note that the S&P 500 fell only 0.9% for the whole month. That gap between the AI family and everyone else is now the single most important feature of this market.
Outside the US the story split by region. Europe’s STOXX 600 closed at 646.75 and logged its best month since June. Japan’s Nikkei 225 fell about 5.2% to 63,290 after crossing 70,000 on 5 October. Korea took the hardest hit of any major market. The Kospi fell 7.6% on 15 October with a 20-minute trading halt and lost 17.11% between 1 and 16 October. It jumped 6.63% on 28 October when SK Hynix reported, and still ended the month down more than 16%. China’s CSI 300 entered a bear market on 22 October, 20% below its June peak after ten straight weekly losses. Indonesia’s stock index crashed 11.6% on 16 October after MSCI proposed reclassifying it as a standalone market, and Brazil’s Ibovespa fell 13.9% on 26 October after Lula’s surprise re-election, with trading halted for 30 minutes.
Macroeconomic and Central Bank Developments
So what did the data say? It said two opposite things at once, and the Fed chose to believe the second one.
The soft side came first. September payrolls, released on 2 October, showed just 29,000 jobs added against 84,000 expected, with unemployment up to 4.2%. The University of Michigan’s preliminary October sentiment index fell to 46.3, and a Fed survey found nearly 20% of families behind on loan payments, the worst reading since the survey began in 2010.
Then inflation came in hot. September consumer prices rose 3.7% from a year earlier against 3.6% expected, with gasoline up 9.1% on the month. Producer prices jumped 1.3% in a single month against 0.5% forecast, the biggest rise since March 2022. Retail sales rose 0.8% against 0.3%. Jobless claims fell to 194,000, near their lowest since 1969. Hard data hot, soft data cold. That is the same K-shaped economy I wrote about last month, and the Fed is still setting policy for the top of the K.
On 28 October the Fed held at 3.75% to 4.00%, but Governor Lisa Cook and Cleveland Fed President Beth Hammack dissented in favour of a quarter-point hike. Chair Kevin Warsh called the economy strong and said he does not believe in forward guidance. Two days later the data backed the hawks: third-quarter GDP grew at a 3.4% annualised pace against 3.1% expected, and September PCE inflation ran at 3.6% with core at 3.1%. By month end St. Louis Fed chief Alberto Musalem wanted another hike “soon”, Dallas Fed chief Lorie Logan saw at least two more, and futures priced about a 76% chance of a hike in December. In a Reuters poll taken mid-month, all 100 economists expected a December hike, up from fewer than half a month earlier.
Now for the part that confused people. Hike odds went up and the 10-year yield went down. The 10-year started the month at 5.29%, traded above 5.33% on 8 October, and closed the month at 4.93%. On 22 October alone it fell more than 17 basis points, its biggest one-day drop since March 2023, as money ran out of tech stocks and into Treasuries. “It is a flight to safety,” said Mitch Goldberg of ClientFirst Strategy. When yields fall while the Fed talks about hiking, the bond market is telling you it cares more about growth and credit than about inflation.
It was not only the Fed. The European Central Bank held its deposit rate at 2.50% with euro-area inflation at 3.8%, its highest since September 2023, and Christine Lagarde announced she will step down on 7 February 2027, nearly nine months early. The Bank of Japan held at 1.25% but said for the first time since 2013 that underlying inflation is “generally consistent” with its 2% target. Britain’s 30-year gilt yield rose above 6% for the first time since 1998, with two Bank of England hikes priced by year-end. France’s 10-year yield crossed 5% for the first time since 2002 after riots over its budget, Spain called a snap election for 29 November, and the euro fell to a 17-month low near $1.11. China grew 4.5% in the third quarter with exports up 36.3%. Four of the world’s big central banks are now either hiking or debating it, into an energy shock, and none of them is sure the growth is real.
Geopolitical Developments
If September was the month the Iran conflict reached a second chokepoint, October was the month it stopped moving and started costing.
The Strait of Hormuz became a minefield. Iran laid about a dozen mines, a container ship called the GFS Pride sank after being struck, and on 30 October Iran said four tankers had hit mines. The International Maritime Organization counted at least 30 ships attacked in October, double September’s figure. The Houthis struck Riyadh’s main airport, killing 12, and hit Aramco facilities at Yanbu, Dhahran and the Shaybah oilfield. Saudi Arabia postponed its flagship Future Investment Initiative conference to 2027.
Washington’s response ran on two tracks. On 8 October Trump said the US would not attack Iran before the 3 November midterms, and oil eased. On 22 October the New York Times reported that the US and Israel plan renewed strikes after those midterms, and after the close Trump invoked the Defense Production Act to back oil production and refining. The G7 agreed to release up to 100 million barrels of crude and diesel over four months, and the Treasury waived sanctions on Russian diesel through April 2027. A Category 3 hurricane shut about 63% of US Gulf of Mexico output for several days. Brent still rose from about $103 to about $113. Supply kept arriving. The price kept rising. A tanker crew does not care how many barrels the G7 releases.
The AI money story became a political one. Anthropic filed to list on the Nasdaq as “ANT” with first-half revenue of $16.29 billion, up from $1.16 billion a year earlier. Meta launched a $35 billion stock offering with another $60 billion planned for 2027. Broadcom lined up $63 billion from a group of banks to buy chips for lease to Anthropic, and SpaceX was in talks to raise $40 billion of debt to buy Nvidia chips. The IMF warned that hyperscalers now make up 10% of global investment-grade bond issuance, from under 1% in 2024. Binance suffered the largest crypto theft on record, about $6.3 billion, which TRM Labs and Chainalysis linked to North Korean hackers. And Trump set up a committee to investigate Fed Governor Lisa Cook, with a hearing on 5 November. She dissented in favour of a hike three weeks later.
Corporate Earnings and Stock Market Movers
October is the heaviest earnings month of the year, and this one taught a lesson I keep coming back to. The market did not grade the results. It graded the bill.
A lens from outside markets helps. In psychology, a result is never judged on its own but against a reference point, and the same number can feel like a gain or a loss depending on where that point sits. October moved the reference point for every AI spender from “how much revenue” to “how much cash is left after capex”. Alphabet grew Cloud revenue by more than 100% and lost 12.6% in a day. Microsoft grew Azure 48% and rose 4%. The difference was free cash flow, which is to say the reference point.
Table 2: October 2026 Earnings Movers
| Company | Revenue | Adjusted EPS | Stock reaction |
| PepsiCo | about $25.3 billion | $2.34 vs $2.29 | full-year growth cut to 1% to 2% |
| Goldman Sachs | record trading quarter | $17.01 vs about $13 | fell on the day |
| Netflix | $12.87 billion, in line | $0.87 vs $0.82 | down 5% to 6% |
| SpaceX | $14.6 billion, up 161% | not disclosed | up 7.8% to $159.31 |
| Tesla | $28.05 billion vs $27.9 billion | $0.48 vs $0.43 | down about 3% |
| Meta | $64.60 billion vs $63.37 billion | $7.40 before a $25 billion legal charge | down nearly 7% |
| Alphabet | $127.58 billion vs $127.96 billion | $2.67 vs about $3.01 | down 12.6%, worst day since 2004 |
| Microsoft | $92.28 billion, up 19% | $4.89 vs $4.73 | up 4% |
| ServiceNow | $4.11 billion, in line | $1.00 vs $1.02 | down 27%, worst day on record |
| Amazon | $201.9 billion vs $202.3 billion | $1.89 vs $1.96 | down 7% premarket, closed down 1.4% at $240.35 |
| Intel | $16.5 billion, up 21% | $0.52 vs $0.41 | down 28.6% to $65.76, worst day since the 1970s |
PepsiCo and Delta opened the season with beats and cuts. PepsiCo earned $2.34 a share against $2.29 on about $25.3 billion of revenue, yet cut full-year growth to 1% to 2% as North American beverage volumes fell about 2%. Delta cut its 2026 profit forecast to $5.10 to $5.60 a share from $6.50 to $7.50, absorbing a $6 billion rise in fuel costs.
The banks reported on 13 and 14 October, and the reaction was the first sign of what was coming. Goldman Sachs earned $17.01 a share against forecasts near $13 and still fell. Morgan Stanley earned $3.03 with equities trading up 41% and dropped 2.75%. Citigroup fell 5.6%, and Bank of America lost 4.76% after a fine of more than $1.2 billion. A record quarter at Goldman could not lift the stock.
Netflix reported revenue of $12.87 billion in line and earnings of $0.87 a share against $0.82. The stock fell 5% to 6% because fourth-quarter guidance of $13.44 billion missed the $13.51 billion wanted, the 2026 advertising forecast was cut to about $2.7 billion, and about 6% of staff will go. A $70 million gap on a $13 billion guide cost the stock 5%.
SpaceX had the best reaction of the month. Revenue jumped 161% to $14.6 billion against about $12.7 billion expected, and Elon Musk said SpaceX and Tesla have formed committees to explore a merger. The shares rose 7.8% to $159.31. Earlier in the month its purchase of 800 MHz spectrum sent T-Mobile down 13.3% in its worst day since 2013.
Tesla beat, with adjusted earnings of 48 cents against 43 cents on revenue of $28.05 billion, but car revenue fell 3% and the stock slipped about 3%. Investors looked past the beat to the shrinking core business.
Meta was the clearest case of the month’s grading rule. Revenue of $64.60 billion beat the $63.37 billion expected, and earnings excluding a $25 billion New Mexico privacy charge were $7.40 a share against about $5.70. The stock still fell nearly 7%. What investors saw was free cash flow of minus $2.12 billion, a 2026 capex floor raised to $135 billion, and five-year credit default swaps at an all-time high above 124 basis points. A week later Meta launched a $35 billion stock offering.
Alphabet had its worst day since Google listed in 2004. Revenue of $127.58 billion was roughly in line, adjusted earnings of $2.67 a share missed the $3.01 expected, and Google Cloud more than doubled to $30.7 billion. None of that mattered next to free cash flow of negative $9.07 billion against the negative $2.70 billion pencilled in, with 2026 capex guided at $195 billion to $205 billion. The stock fell 12.6%, wiping out roughly $500 billion of market value.
Microsoft reported the same evening and went the other way. Revenue rose 19% to $92.28 billion, earnings of $4.89 a share beat the $4.73 expected, and Azure grew 48% with guidance of 49% to 50% for the December quarter. The line that lifted the stock 4% was capex of $45.2 billion, under the $50.67 billion expected. Same AI boom, same evening, opposite reaction, because Microsoft spent less than feared.
ServiceNow fell 27% on 29 October, its worst day on record, on revenue of about $4.11 billion in line and earnings of $1.00 a share, a 2 cent miss. A miss that small does not cause a drop that large on its own. The fear was that AI will upend the software business model, and a soft quarter made the fear concrete.
Amazon missed on both lines, with revenue of $201.9 billion against $202.3 billion and earnings of $1.89 a share against $1.96, even as AWS grew 39%. Quarterly capex hit $77.3 billion and trailing free cash flow swung to negative $42.4 billion, with 2026 capex kept near $220 billion. The stock fell 7% in premarket trading, then clawed most of it back to close down 1.4% at $240.35.
Intel was the month’s single worst story. Revenue of $16.5 billion rose 21% and earnings of 52 cents beat the 41 cents expected. Then it guided fourth-quarter revenue to $15 billion to $16 billion against $17.1 billion, citing a PC slowdown and an extended shutdown at its Israel plant after an explosion. The stock fell 28.6% to $65.76, its worst day since the 1970s. Reddit fell 29.2% to $91.73 the same day after warning that Google’s AI answers have cut its search traffic.
TSMC and SK Hynix showed the same pattern from the supply side. TSMC posted a sixth straight record profit, net income up 68.7% to NT$763.06 billion, yet its US shares fell 1.8% because gross margin slipped to 66.4% from 67.7%. SK Hynix reported operating profit of 83.33 trillion won against 76.72 trillion expected and said it will return about 100 trillion won to shareholders. The stock jumped 10.89%. When the chipmaker promises cash back, the market pays. When the spender promises more spending, it does not.
Elsewhere, Oracle jumped 10.7% after its investor day forecast $225 billion of fiscal 2030 revenue and capped further fundraising at $20 billion. Constellation Energy rose 12.3% on a 3,590-megawatt power deal with Alphabet. Boeing sank 10.7%, General Motors fell 6.8%, and CoreWeave ended the month down 29% with its five-year default swaps at a record 1,194.5 basis points.
Commodities, Bonds, and Other Assets
If you only read one section of this wrap, make it this one again, because the bond market changed its mind in October.
In September the 10-year yield rose on soft inflation data, which told you supply was the problem. In October it fell while hike odds rose, which tells you growth and credit are now the problem. The 10-year went from 5.29% to above 5.33% on 8 October, when a $22 billion 30-year auction cleared at 5.618%. Then it turned, dropping more than 17 basis points on 22 October alone and closing the month at 4.93%. A yield curve that flattens while the Fed talks about hiking is a market pricing a slowdown, whatever the Fed says.
Credit told the same story more loudly. CoreWeave’s default swaps hit a level generally seen as distressed, Meta’s reached all-time highs, and credit desk sources told CNBC the high-yield market is effectively on hold until after the midterms. The high-yield spread, the extra yield investors demand to hold junk bonds over Treasuries, was 3.40% as of 22 October, up from about 2.84% in late September. That is the number I’m watching most closely into November.
Oil did what oil does in a war. Brent rose from about $103 to a six-month high, with the expiring December contract settling at $117.64 on 30 October and the January contract at $113.43, a gain Reuters put at 13.6% for the month. WTI rose 15.2% to $102.95. Both logged a fourth straight monthly gain, and Exxon and Chevron touched all-time highs as refining profits surged.
Gold had its second bad month in a row, and this time the reason was different. In September it fell because real yields rose. In October yields fell and gold fell anyway, down 6.6% to about $3,885 an ounce, a one-year low, breaking below $4,000 on 23 October for the first time since July. Silver was worse, down roughly 18% and closing under $50. Why would a haven fall during a flight to safety? Because in October the haven was Treasuries, and gold traded like a leveraged position being unwound. The dollar index finished near 102, roughly flat, as the euro’s fall offset the yuan’s rise to its strongest since July 2022.
Bitcoin and Ethereum
Bitcoin spent October doing the opposite of September. It fell with the Nasdaq instead of rising against the Fed.
It started the month near $83,400 and held above $80,000 for most of it. The break came on 29 October, when Binance said it was investigating “a potential security issue” and Tether, Circle and others froze about $1.8 billion tied to the incident. Bitcoin fell below $80,000 and traded near $77,400 by 30 October, down about 7% for the month. The 4% drop on the day was milder than the 8.3% average first-day fall after past exchange hacks, per Anchorage Digital, which tells you the market had already been selling for other reasons.
Ethereum did worse. It usually does when risk comes off. It fell from about $2,671 to about $2,233, a drop of roughly 16%. Spot Bitcoin ETF flows turned negative late in the month. Crypto in October traded as a high-beta Nasdaq, and the Nasdaq was falling.
Concluding Thoughts
October leaves the S&P 500 at 7,580, almost exactly where it was at the September Fed meeting. The range I described last month still holds: the floor is 7,551.81, the closing low on the day of the September hike, and the ceiling is now 7,818.95, the record from 6 October. The range survived. The leadership did not.
What breaks it? I think the answer this month is credit, and the number is the high-yield spread. At 3.40% on 22 October it was 10 basis points short of 3.50%, a level that would say the AI funding problem has spread beyond CoreWeave and Meta into the broad junk market. If I had to make an estimate, I’d say there is a bit better than a coin-flip chance it closes November above that line. The spenders now have to raise equity and debt into a market that just punished them for spending. What would make me wrong is a quiet earnings tail: Apple on 2 November and Nvidia later in the month reporting capex that comes in under forecasts, the way Microsoft’s did. If the spread holds under 3.50% through 30 November with the 10-year still under 5%, the rotation reading was right and the floor at 7,551.81 should hold. If it crosses, the stocks that led October will not be enough to hold the index.
The calendar is loaded. The midterms are on 3 November, the Cook hearing on 5 November, October payrolls on 6 November, and the strike reports say the Iran question gets answered after the vote. A Fed hike in December is now the consensus. A month ago it was a coin flip. When consensus moves that far that fast, the trade is usually already in the price.
Personally, I’ve spent the month doing the same thing I did in September, which is less. When Alphabet can lose $500 billion in a day on a cash-flow number, position sizes have to be small enough that a 12% gap in any single name is an annoyance rather than a disaster. I don’t know whether the AI build-out is a bubble or the best investment of the decade, and I don’t need to know. I need to know where my stop is, what the spread is doing, and which side of the rotation the money is on this week.
If you’d like to follow these moves as they happen, with analysis of what they actually mean for your trading, come join us in our trading community. See you inside!
Previous wrap: Monthly Market Wrap (September 2026)
Want the daily routine? Enter your email for the free 15-Minute Swing Trader's Checklist.
Free 5-page PDF, then occasional trading emails. Education only, not financial advice. Unsubscribe anytime. Kit stores your email in the US: see our privacy policy.
Want to learn the full method? The Trading Mastery Program teaches the 4 strategies I have traded since 2011. It suits beginners and experienced traders.
Rather follow the trades as they happen? Daily Trading Signals is our Telegram channel: my trade ideas with entry, stop and exit, and every trade is public.
Questions about this post? Ask in the free Telegram channel →
Educational content only, not personalised financial advice. Trading carries risk, including loss of capital. Past performance is not indicative of future results. Synapse Trading is not licensed or regulated by MAS.
