How to Read Price Bars (Candlestick Bars)
Join our Telegram channel for more market analysis & trading tips: t.me/synapsetrading
Now that we have learnt how to read price charts, the next step is for us to zoom in on the individual bars that make up the price charts.
Since these charts are called candlestick charts, the individual bars are called candlestick bars. For convenience, most people will also refer to them simply as price bars.

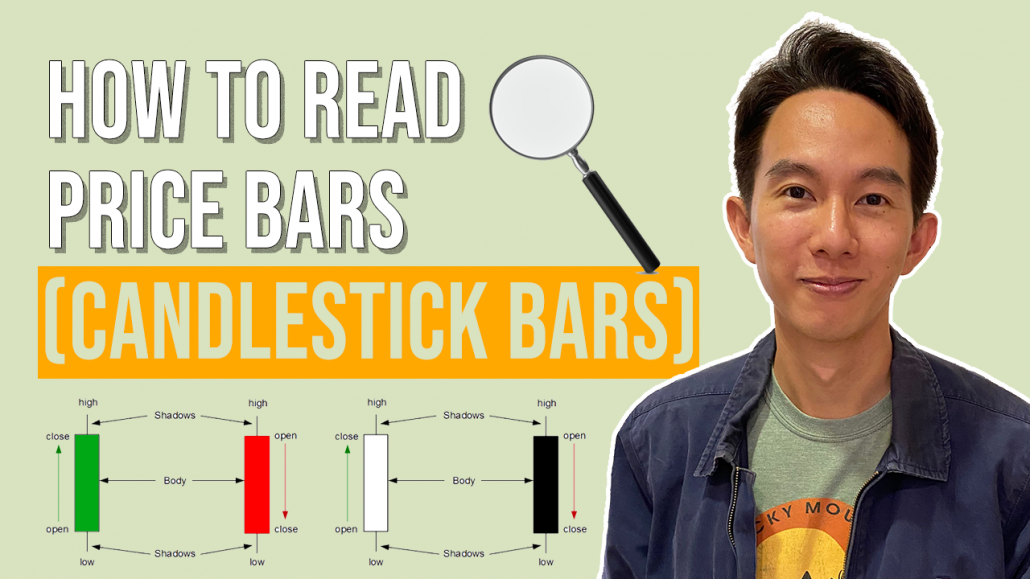
Each candlestick bar consists of 4 data points:
- Open – this is the opening price of the bar, which refers to the first transaction which occurred in this time period.
- Close – this is the closing price of the bar, which refers to the last transaction which occurred in this time period.
- High – this refers to the highest transaction price which occurred in this time period.
- Low – this refers to the lowest transaction price which occurred in this time period.
Based on these 4 data points, all candlestick bars will have 2 components:
- Body – this is the “fat” part of the candle, and its length is determined by the distance between the open and close.
- White body – If the closing price is higher than the opening price, it means that prices moved up, and it represents bullishness.
- Black body – If the closing price is lower than the opening price, it means that prices moved down, and it represents bearishness.
- Shadow – this shadow is the “thin” part of the candle, and represents the extreme moves of prices within the bar.
- Short shadow – this signals low volatility and less uncertainty.
- Long shadow – this signals high volatility and more uncertainty.
I will be covering more of this in my price action trading guide, so for now here are some simple rules for analysis.
Bullish factors:
- A lot of long white bars
- Short or no shadows on the top of bars
- Long or no shadows on the bottom of bars
Bearish factors:
- A lot of long black bars
- Short or no shadows on the bottom of bars
- Long or no shadows on the top of bars

If you would like to learn how to get started in trading, also check out: “The Beginner’s Guide to Trading & Technical Analysis”
 Our flagship mentoring program is suitable for both beginners and advanced traders, covering the 4 strategies which I used over the past 15 years to build up my 7-figure personal trading portfolio.
 If you're looking for the best trading opportunities every day across various markets, and don't want to spend hours doing the research yourself, check out our private Telegram channel!


Leave a Reply
Want to join the discussion?Feel free to contribute!