Tag Archive for: straits times index

2012Oct-Straits-Times-800x6001 

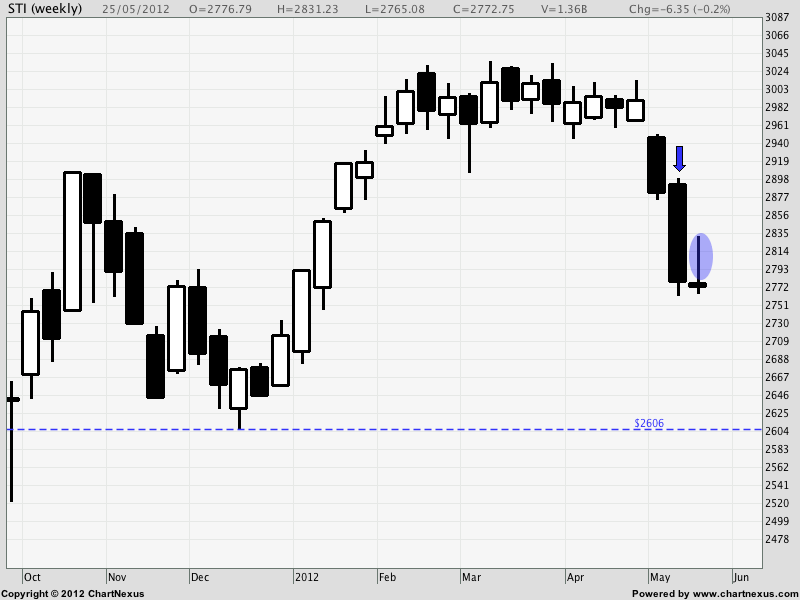
Last week, we saw a strong bullish bar breakout of the range, however this week ended with a strong bearish bar back into the range. This shows the strength of the bears, and bulls will not be looking to buy until prices have dropped to the area of the green horizontal line. If prices fall through, we will see a double top; if prices hold, we will see more range trading. A key event is the EU Summit this Thursday, where Spain may or may not request for a bailout, and this will have a significant impact on the sentiment.

Highlights from “The Synapse Forum”

Screen-Shot-2012-10-15-at-5.01.37-AM

The falling apple is acting as a drag on the NASDAQ, and hence the US markets in general. The US markets are likely to be ranging or bearish.
 

Screen-Shot-2012-10-15-at-4.40.27-AM

Although the general market is bearish, the commodity stocks are showing signs of bullishness, such as this chart of Noble. 

Regarding the market, we are likely to see a strong opening tomorrow given the strong close on Friday. The Dow closed up 277 points, due to the bullish news coming out of Europe, with new measures to “avert” the latest crisis.

It’s funny how the cycle plays out:
Crisis event – FEAR, FEAR, FEAR, it’s the end of the world!!!
Discussion – leaders discuss how to solve it, and markets creep down as the clock ticks. People are worried that no solution will emerge and markets become oversold.
Just in time! – Just when the sand is about to run out of the hourglass, the solution emerges and everyone is happy.
Next crisis – rinse and repeat

So, the big question is: how long is this bullishness going to last? Let’s not forget the core problems are still not solved. The charts will inform us when the time comes.

The end of Q2

Let’s also not forget that last Friday was the last trading day for Q2, which signifies something very important: WINDOW DRESSING. We shall see whether this optimism carries on into the next week

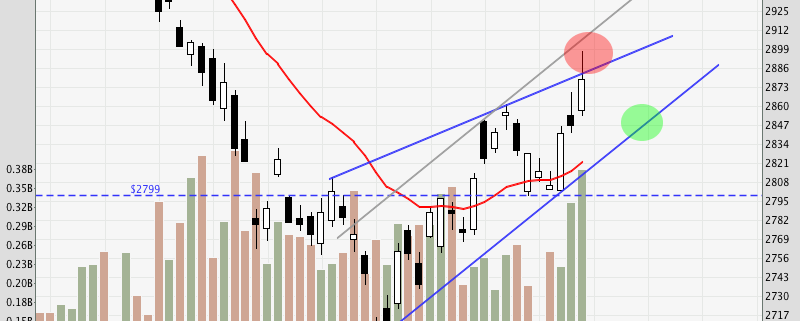
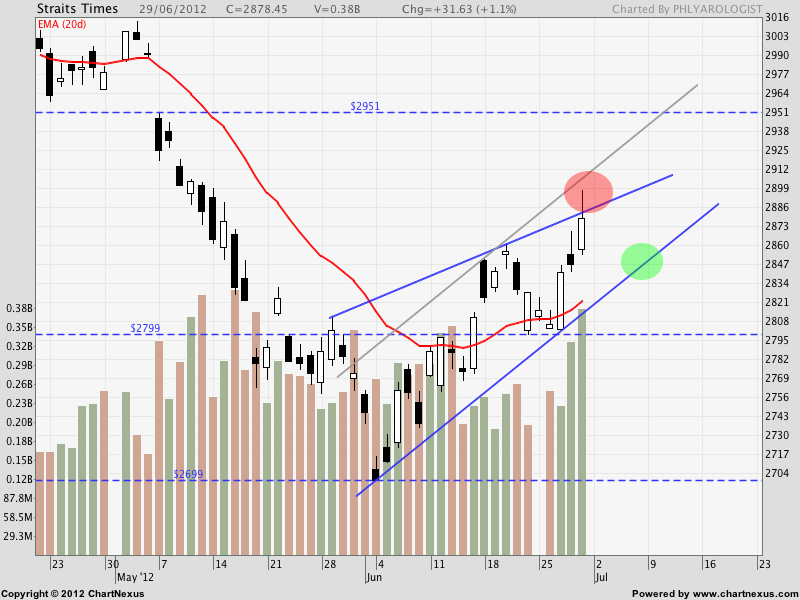
Looking at the chart above, I would prefer to go long near the green circled area instead of the red circled area, where weakness in the form of upper shadows. Given the bullishness, there may not be any pullback, so I will be looking to go long on any intraday pullback or pause bar.

////////  Do note that the current short-term trend is bullish, so stay bullish until the price informs us of a change in direction. ////////

Cheers
Spencer

Stock Indices

Stock Indices 2

Stock Indices 3

All 3 indices attempted a pullback over the week, and overall the Singapore market was the weakest, closing down for the week, albeit almost flat. Prices may attempt a sideways movement or rebound next week, but overall it still remains bearish, and prices are expected to continue drifting down in the absence of any major positive news. I am holding shorts and waiting for a chance to short more.

Global Market Highlights

China Cuts Bank Reserve Ratios
Greece Identifies $427M in Budget Cuts
Higher Prices Pinch Shoppers, Constrain Fed’s Options
Obama Urges Congress to Reward Technology Companies That Keep Jobs in U.S.
Germany drawing up plans for Greece to leave the euro
Dow nears psychological milestone: 13,000
S&P 500 nears 3-year high amid Greece bailout optimism

Global Stock Indices (Dow Jones Index) Weekly Chart

^dji-021912

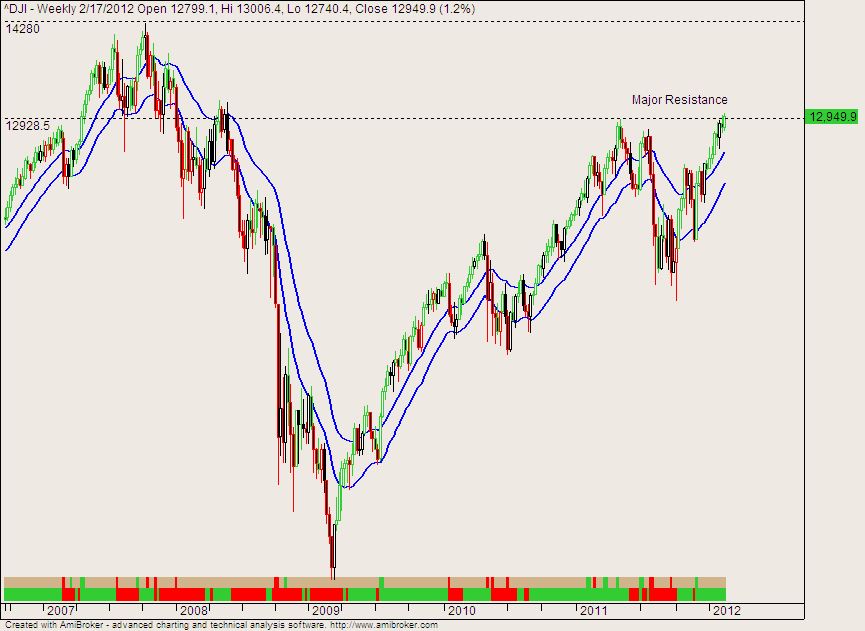
On the weekly chart, the Dow is nearing major resistance, which coincides with the psychological level of 13,000. Get ready to short on signs of weakness, or wait for a breakout pullback setup.

Forex Markets (EUR/USD) Daily Chart

eurusd-021912

Currently, for the Euro, the major trend is down, although the minor trend for the past month or so has been up. After breaking above the support-turned-resistance, the breakout has failed and prices have pulled back below that level. It is now preferable to go short, unless the failed breakout fails and becomes a breakout pullback, in which case be prepared to go long.

Singapore Stocks (Straits Times Index)

^sti-021912

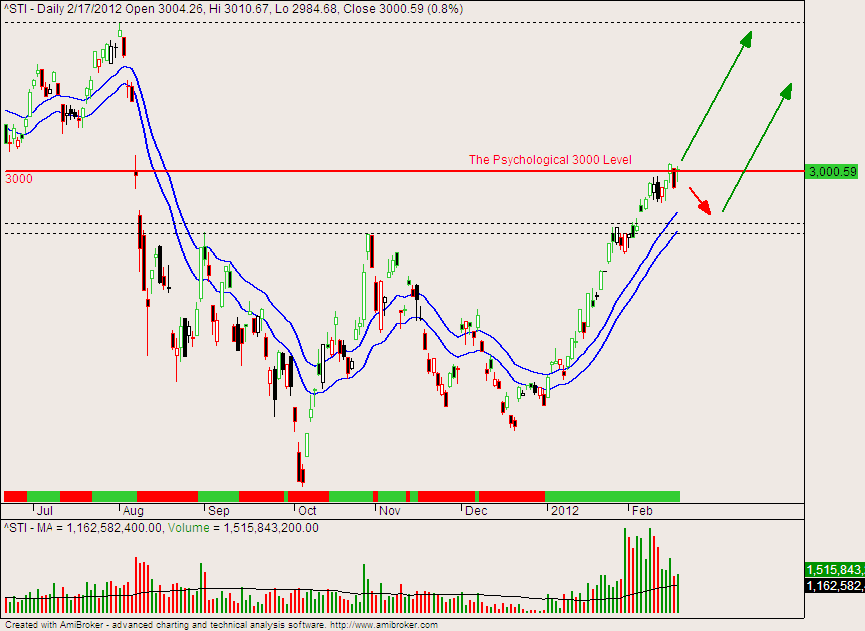
After clearing the key support-turned-resistance level, the STI has surged up to test the psychological round number of 3,000. Since there has been no significant pullback, this could be a chance for the STI to pullback before it resumes climbing up. On the other hand, prices have closed above 3,000 on Friday, and if it holds above that level, we could see higher prices.

Straits Time Index (STI)

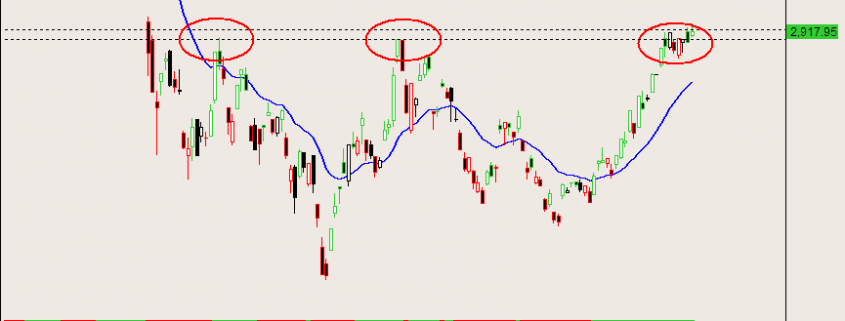
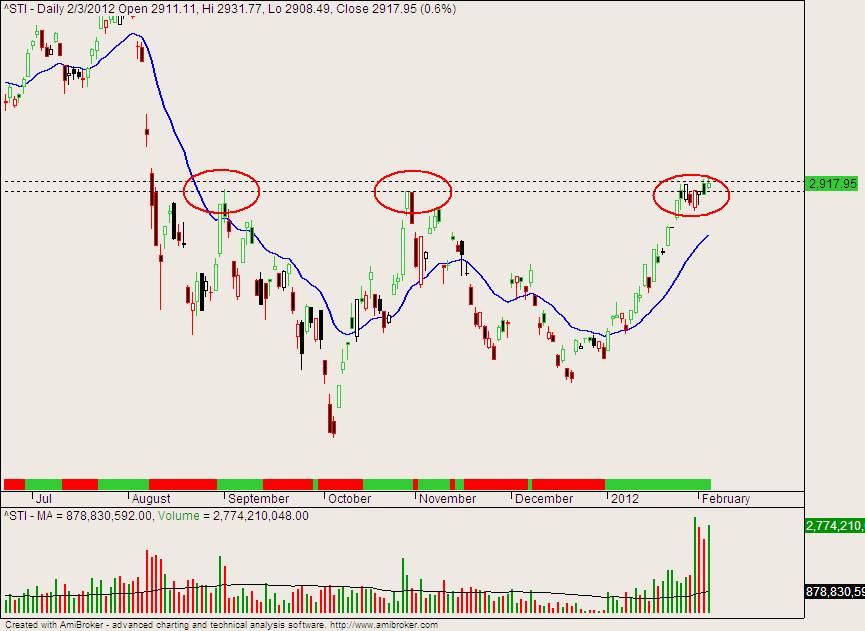
Last week, the price action was clustered around the resistance level, forming a small pullback that may be interpreted as a flag. However, we have not seen a strong breakout or follow-through from the flag, which we should be looking out for this coming week. Given the strong close on the US front after the positive jobs report on Friday, we should see the STI gap up on the open. Do not be tempted to chase the market, and wait for a good setup for entry. If you want to take a long position, go in with 1/2 or 1/3 your usual size, and trail your stops. Based on weekly swing counts, the trend is still down.

For those who have no positions, do not be sore about missing out. Trading is about making calculated risks, and part of the challenge is accepting the reality that you will be wrong 30-40% of the time. Be skeptical when people claim to consistently pick the tops and bottoms with “special” methods. If their method works so well, they would be working for a fund trading millions of dollars instead of selling their “special” methods for a quick buck. Stick to the core principles, and trust yourself. Self-proclaimed gurus come and go, but the core tools of technical analysis have stood the test of time.