

The Basics of Market Timing
Want the daily routine? Get the free 15-Minute Swing Trader’s Checklist. Get it free →
The price of every stock or financial product fluctuates over time, and no matter how strong a stock is or how solid its fundamentals, you can only make money when the stock goes up in price relative to where you bought it. That’s why it’s so important to read the market accurately and buy stocks at the right time.
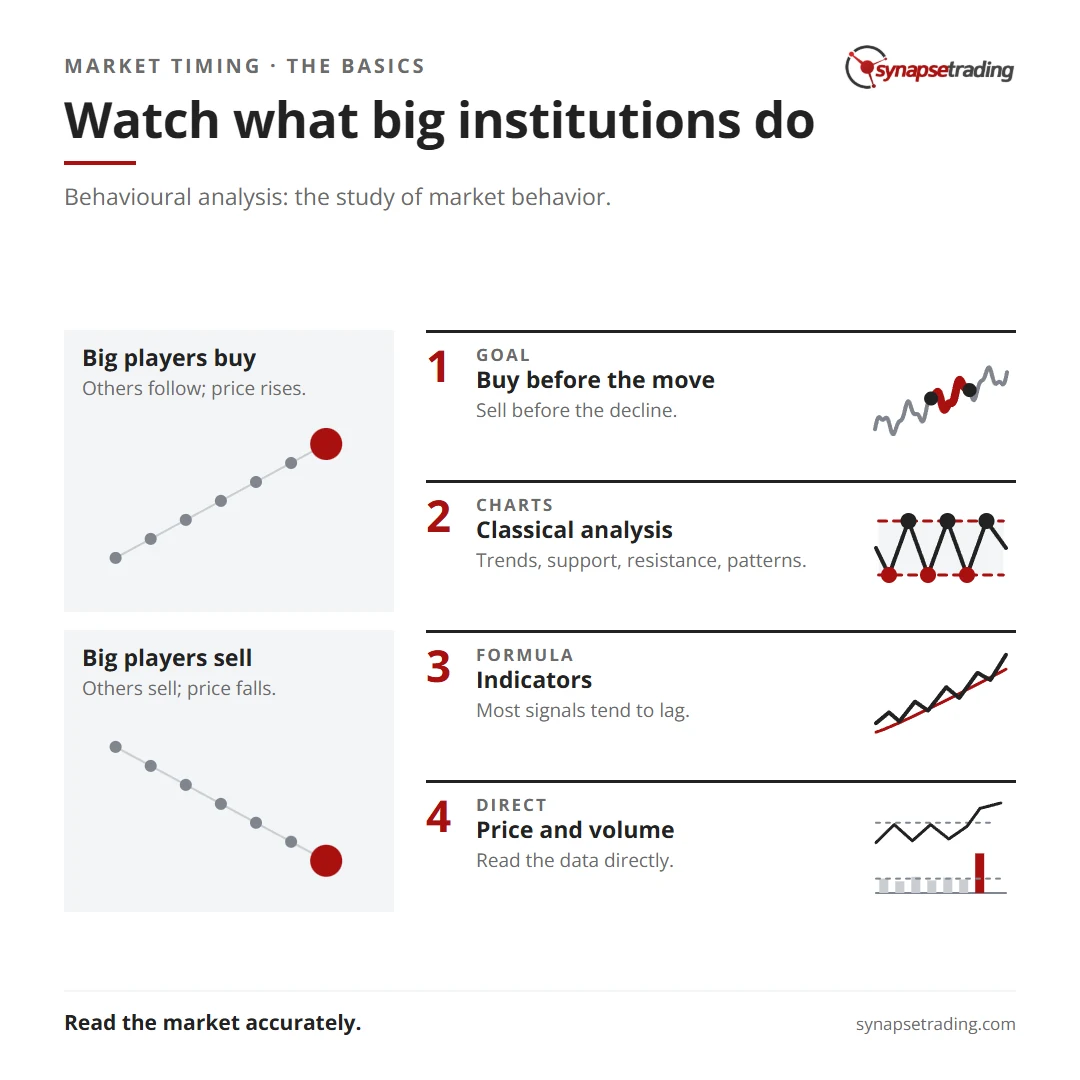
The goal for any investor is to buy a stock just before it makes a big move, and sell it just before it starts to decline. The question is how do you do it?
For starters, you want to look at the big players on the financial landscape, like banks and financial institutions.
These are the organizations who determine the direction of a stock more than any other. If they start to buy a certain stock in large numbers, chances are other investors will follow suit, leading to a rise in value. And if they start to dump a stock, then other shareholders will likely do the same, causing a decrease in value.
By keeping a close eye on what these institutions are doing, you’ll be able to spot shifts in the market before they happen.
This study of market behavior is known as behavioural analysis and encompasses three main schools of thought: classical technical analysis, indicator-based technical analysis, and price action and volume analysis.
Classical technical analysis is all about reading charts. The goal is to identify the trend lines of a particular stock and pinpoint the support and resistance zones, where buying and selling usually takes place.
Classical technical analysis also includes pattern recognition techniques, used to identify shapes on the chart which have a certain predictive value.
Then, there’s indicator based technical analysis in which you take price and volume data and plug it into a mathematical formula to figure out when to buy or sell. Unfortunately, most indicator signals tend to be lagging, which can result in misleading or inaccurate analysis.
Finally, there’s price action and volume analysis, in which a trader leverages their deep understanding of market movements to interpret price and volume data directly. It’s the methodology that most professional traders use as it allows faster, more accurate predictions.
Those are the basics.
Over the next few videos, we’ll dive a little deeper and teach you how to identify market trends and most importantly how to pinpoint the right time to buy and sell.
Want the daily routine? Enter your email for the free 15-Minute Swing Trader's Checklist.
Free 5-page PDF, then occasional trading emails. Education only, not financial advice. Unsubscribe anytime. Kit stores your email in the US: see our privacy policy.
Want to learn the full method? The Trading Mastery Program teaches the 4 strategies I have traded since 2011. It suits beginners and experienced traders.
Rather follow the trades as they happen? Daily Trading Signals is our Telegram channel: my trade ideas with entry, stop and exit, and every trade is public.
Questions about this post? Ask in the free Telegram channel →
Educational content only, not personalised financial advice. Trading carries risk, including loss of capital. Past performance is not indicative of future results. Synapse Trading is not licensed or regulated by MAS.

